> ## Documentation Index
> Fetch the complete documentation index at: https://docs.trunk.io/llms.txt
> Use this file to discover all available pages before exploring further.
# The CI tab
> Every job your organization runs, ranked by volume, duration, and pass rate - plus what is running right now.
Open the **CI** tab in the Trunk app for an organization-wide view of your CI:
every job across every repository, what it costs, and how reliably it passes.
Filters - repository, workflow, provider - are shared across the tab, so
narrowing to a repository on one screen keeps it narrowed on the next.
## Jobs
The list of every job Trunk has seen run, one row each.
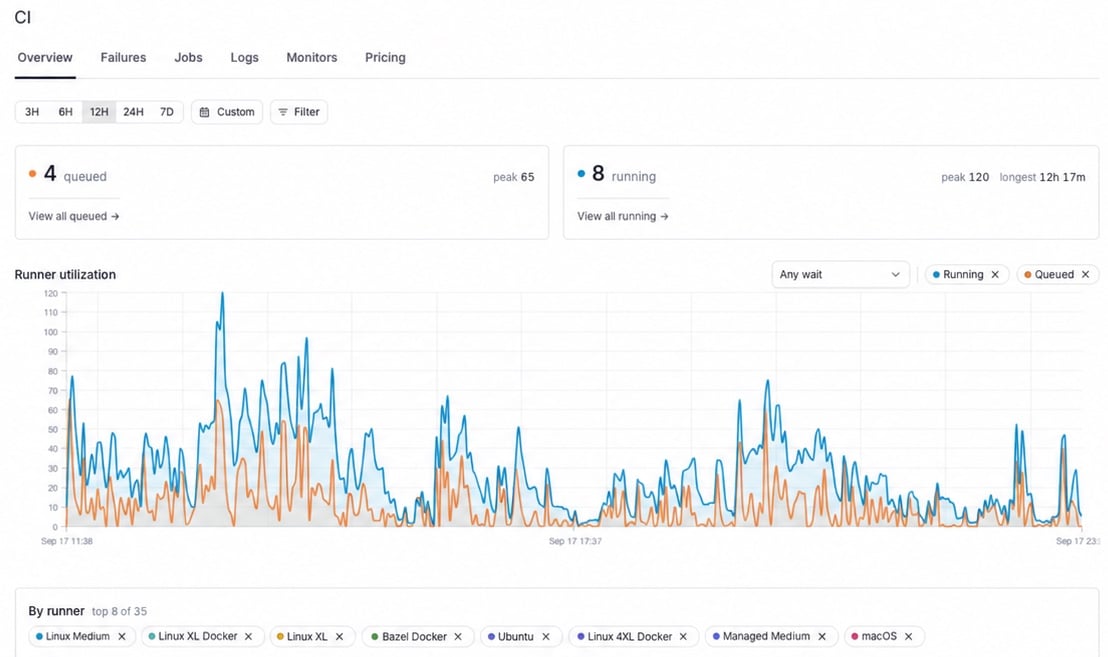 Sort by any of pass rate, duration, or total; search across job, workflow, and repository.
### How the numbers are defined
Three different questions need three different sets of runs, and a job reads the
same way everywhere in Trunk because they are used consistently:
* **Pass rate** is `success / (success + failure + timed out)`. Cancelled and
skipped runs are in neither half - a job that only ever cancelled has no pass
rate rather than a zero.
* **Runs** counts every finished run that was not skipped, including ones that took no measurable time.
A run with no measurable duration is real - timestamps are second-resolution and a job can start and finish inside one - so it is counted but cannot be plotted.
That is why a duration chart's count can sit below the run count.
## Job detail
Sort by any of pass rate, duration, or total; search across job, workflow, and repository.
### How the numbers are defined
Three different questions need three different sets of runs, and a job reads the
same way everywhere in Trunk because they are used consistently:
* **Pass rate** is `success / (success + failure + timed out)`. Cancelled and
skipped runs are in neither half - a job that only ever cancelled has no pass
rate rather than a zero.
* **Runs** counts every finished run that was not skipped, including ones that took no measurable time.
A run with no measurable duration is real - timestamps are second-resolution and a job can start and finish inside one - so it is counted but cannot be plotted.
That is why a duration chart's count can sit below the run count.
## Job detail
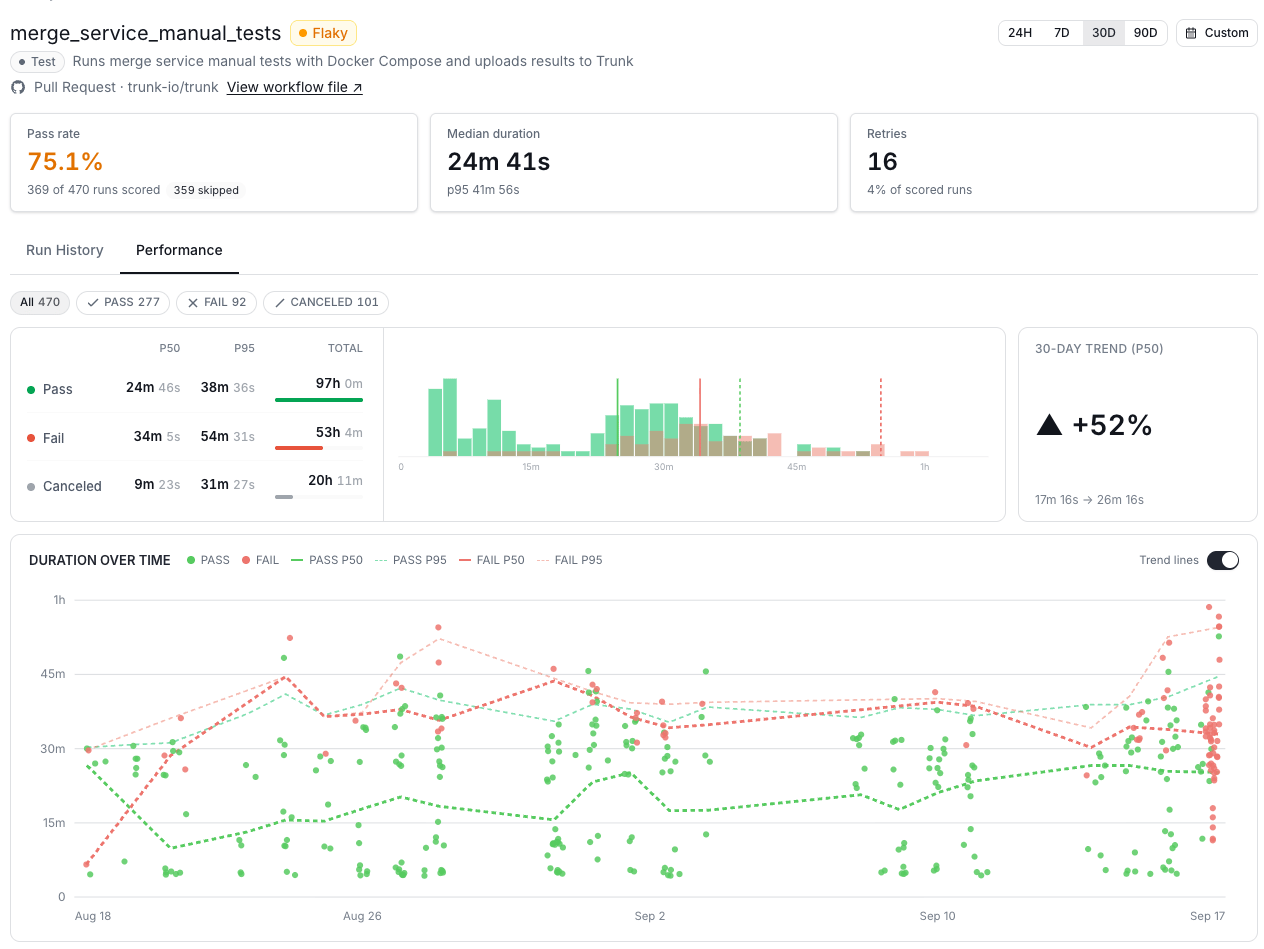 The header names the job and links to the workflow file that declares it, with a
**Healthy** or **Flaky** badge from the CI health monitors. Beneath it, three
figures over the selected range: pass rate, median duration with p95, and
retries.
**Run History** is the default tab: a daily pass/fail chart - click a bar to
filter the table to that day — over a list of every run, with its duration,
pull request, branch, test results, and commit. Filter by outcome, by what
triggered it, or by branch. Click a run to open its
[commit trace](/ci/commit-traces).
**Performance** plots duration over time for the same runs, so a job that has
been getting slower is visible as a trend rather than as a single percentile.
The header names the job and links to the workflow file that declares it, with a
**Healthy** or **Flaky** badge from the CI health monitors. Beneath it, three
figures over the selected range: pass rate, median duration with p95, and
retries.
**Run History** is the default tab: a daily pass/fail chart - click a bar to
filter the table to that day — over a list of every run, with its duration,
pull request, branch, test results, and commit. Filter by outcome, by what
triggered it, or by branch. Click a run to open its
[commit trace](/ci/commit-traces).
**Performance** plots duration over time for the same runs, so a job that has
been getting slower is visible as a trend rather than as a single percentile.