alias: `trunk run
.*)\))
```
and would result in a `trunk` diagnostic that looks like this:
```
7:81 high line too long (82 > 80 characters) regex-linter/line-length
```
In the event that multiple capture groups of the same name are specified, the nonempty capture will be preferred. If there are multiple non-empty captures, a linter error will be thrown. Adjust your regular expression accordingly to match the specifics of your output.
> Note: For additional information on building custom regular expressions, see [re2](https://github.com/google/re2/wiki/Syntax). More complicated regex may require additional escape characters in yaml configuration.
### Arcanist
You can also output JSON using the Arcanist format.
```json theme={null}
[
{
"Char": 1,
"Code": "missing_copyright",
"Description": "Message about things\nMaybe contain multiple lines and web\nlinks\nhttps://website.com/notice-about-stuff\n",
"Line": 1,
"Name": "Incorrect (or missing) copyright notice",
"OriginalText": "",
"Path": "somefile.py"
}
]
```
### Formatters
`output: rewrite` linters write the formatted version of a file to `stdout`; this becomes an autofix which `trunk` can prompt you to apply (which is what `trunk check` does by default) or automatically apply for you (if you `trunk check --fix` or `trunk fmt`).
For example, if you wanted a linter to normalize your line endings, you could do this:
```yaml theme={null}
lint:
definitions:
- name: no-carriage-returns
files: [ALL]
commands:
- output: rewrite
formatter: true
command: sed s/\r// ${target}
success_codes: [0]
```
Setting `formatter: true` will cause `trunk fmt` to run this linter.
# Output Parsing
Source: https://docs.trunk.io/code-quality/overview/getting-started/configuration/lint/output-parsing
If you have a command or utility that you want to run pretty much as-is, but Trunk doesn't natively understand how to parse it, you can inject your own custom parser to translate its output into a format that Trunk does understand!
For example, let's say that we want to use `grep` as a linter, but we want to add more context to the matches. We could define a custom linter like so:
```yaml theme={null}
lint:
definitions:
- name: todo-finder
files: [ALL]
commands:
- output: regex
# matches the parser run output
parse_regex: "((?P.*):(?P\\d+):(?P.*)\\] (?P.*) \\((?P.*)\\))"
run: grep --with-filename --line-number --ignore-case todo ${target}
success_codes: [0, 1]
read_output_from: stdout
parser:
run:
"sed -E 's/(.*):([0-9]+):(.*)/\\1:\\2:0:
[error] Found todo in \"\\3\" (found-todo)/'"
```
The execution model that `trunk` follows for a parser is that it will:
* execute the linter's `run` field, asserting that either:
* the linter's exit code is in `success_codes`, or
* the linter's exit code is not in `error_codes`;
* execute `parser.run`,
* with the `read_output_from` of the linter execution fed to `parser.run` as `stdin`,
* assert that the exit code of the parser is 0, and then
* use `output` to determine how it should parse the parser's `stdout`.
Note that you can also set `parser.runtime` to [`node`](./output-parsing#node) or [`python`](./output-parsing#python) so that you can write your parser in Javascript or Python instead, if you so prefer! You can find plenty of examples of python parsers in our [plugins repo](https://github.com/trunk-io/plugins).
**Node**
```yaml theme={null}
lint:
definitions:
- name: todo-finder-node
files: [ALL]
commands:
- output: parsable
# parse_regex matches the parser run output
parse_regex: "((?P.*):(?P\\d+):(?P.*)\\] (?P.*) \\((?P.*)\\))"
run: grep --with-filename --line-number --ignore-case todo ${target}
success_codes: [0, 1]
read_output_from: stdout
parser:
runtime: node
run: ${workspace}/todo-finder-parser.js
```
```javascript theme={null}
#!/usr/bin/env node
'use strict';
let readline = require('readline');
let rl = readline.createInterface({ input: process.stdin });
rl.on('line', function(line){
let match = line.match(/(.*):([0-9]+):(.*)/);
if (match) {
let [_, path, line_number, line_contents] = match;
console.log(`${path}:${line_number}:0: [error]`
+` Found todo in "${line_contents}" (found-todo)`);
}
```
Remember to run `chmod u+x todo-finder-parser.js` so that `trunk` can run it!
**Python**
```yaml theme={null}
lint:
definitions:
- name: todo-finder-python
files: [ALL]
commands:
- output: parsable
# parse_regex matches the parser run output
parse_regex: "((?P.*):(?P\\d+):(?P.*)\\] (?P.*) \\((?P.*)\\))"
run: grep --with-filename --line-number --ignore-case todo ${target}
success_codes: [0, 1]
read_output_from: stdout
parser:
runtime: python
run: ${workspace}/todo-finder-parser.js
```
```python theme={null}
#!/usr/bin/env python
import re, sys
for line in sys.stdin.readlines():
match = re.match("(.*):([0-9]+):(.*)", line)
if match:
path, line_number, line_contents = match.groups()
print(f"{path}:{line_number}:0: [error] "
"Found todo in \"{line_contents}\" (found-todo)")
```
Remember to run `chmod u+x todo-finder-parser.py` so that `trunk` can run it!
# Merge
Source: https://docs.trunk.io/code-quality/overview/getting-started/configuration/merge
Custom `required_statuses` defined in the `.trunk/trunk.yaml` file take precedence over the GitHub required status checks from branch protection.
Use custom `required_statuses` when your checks don't match what you configure on GitHub one-to-one.
```yaml theme={null}
version: 0.1
```
```yaml theme={null}
cli:
version: 1.16.0
merge:
required_statuses:
- Trunk Check
- Unit tests & test coverage
# Add more required statuses here
```
# Per User Overrides
Source: https://docs.trunk.io/code-quality/overview/getting-started/configuration/per-user-overrides
## Per-User Customization
Trunk can also be managed by the `.trunk/user.yaml` file in your repository. This file is optional, but it allows individual developers to customize how they want `trunk` to run on their machines.
Simply configure `.trunk/user.yaml` as you would for `.trunk/trunk.yaml`. Now you can add additional linters, enable [actions](../actions/), or specify [default command options](./#cli), without impacting the way other developers run `trunk`.
Be mindful that `.trunk/user.yaml` takes precedence over `.trunk/trunk.yaml`, so substantial modifications could violate hermeticity.
## Identity Config
Trunk also saves a user config in `$HOME/.cache/trunk/user.yaml`. This is auto-generated in order to manage [anonymous usage data](./telemetry) and persist login sessions.
# Exporting linter configs
Source: https://docs.trunk.io/code-quality/overview/getting-started/configuration/plugins/exported-configs
Reusing linter configs across projects.
Plugin repositories can also export their own linter config files to keep configuration synced across an organization. Simply add an `exported_configs` section to a `plugin.yaml`, with paths to all of the config files you want to export, relative to the repository root. For example:
```yaml theme={null}
lint:
exported_configs:
- configs:
- .eslintrc.yaml
- .trunk/configs/.shellcheckrc
```
These config files will be available for linters that enumerate them in `affects_cache`or `direct_configs` to reference. These files are automatically symlinked into the repository root during linter execution. The set of applicable config files can be viewed in the details yaml file listed when running `trunk check --verbose`.
Plugin-exported configs are sourced in lockstep with the plugin itself, so you will need to update\
the `ref` field to use the latest configs.
Note that if you're using an IDE Extension like clangd with an LSP that relies on those configs being in the root, you will need to manually create a symlink to the plugin's config. You can do this by running `ln -s .trunk/plugins// `.
For an example of a plugin repo with config files, see our own [configs](https://github.com/trunk-io/configs) repo.
### Importing configs
This process can also be reversed to import config files from a plugins repository which\
does not explicitly export them. Given a plugin sourced with id `trunk`, the sourcing repository can\
achieve the same effect by including the following in its `.trunk/trunk.yaml`.
```yaml theme={null}
lint:
exported_configs:
- plugin_id: trunk
configs:
- .eslintrc.yaml
- .trunk/configs/.shellcheckrc
```
# Share config between codebases
Source: https://docs.trunk.io/code-quality/overview/getting-started/configuration/plugins/external-repositories
Sharing configuration between codebases using public config repos
To standardize Trunk configuration across an organization, you can create and publish a public plugins repository. This repo can define new linter definitions, specify enabled linters and actions, and even [export linter configs](./exported-configs).
Once you've created your plugin repository, you can source it in other repositories to adopt shared configuration across your organization. For an example of how we do this in our own org, check out our [configs repo](https://github.com/trunk-io/configs).
Note that in order to keep linters and tools up to date in your plugin configs repo, you'll need to run `trunk upgrade --apply-to=plugin.yaml` to apply [upgrades](../../../linters/upgrades). After making a public GitHub release with your plugin changes, other dependent repos will pick up these changes automatically when running `trunk upgrade`.
### Get started
Let's walk through how to create a simple linter that warns about TODOs in your codebase.
We'll start by creating a new Git repository:
```bash theme={null}
PLUGIN_PATH=~/my-first-trunk-plugin
mkdir "${PLUGIN_PATH}" && cd "${PLUGIN_PATH}"
git init
```
And then create a linter that can find TODOs in your codebase using `grep` and `sed`:
```bash theme={null}
cat >plugin.yaml <
trunk check enable todo-finder
```
And now, to demonstrate how this works, let's `trunk check` some files where we know we have TODOs:
```bash theme={null}
trunk check $(git grep -li todo | head -n 10)
```
which will show you something like this:
```
.eslintrc.yaml:19:0
19:0 high Found todo in " # TODO(chris): Figure out why this causes a massive slowdown ... .trunk/dev-out/O1F.txt local.todo-finder/found-todo
101:0 high Found todo in " node/no-unpublished-import: off # TODO: do we want this?" local.todo-finder/found-todo
```
### Organizing your code
In the example we gave above, we put the linter's source code in `plugin.yaml`, which is fine for an example, but not really great for anything more than that. We can take the `sed` command from the plugin we created earlier and push that into the shell script:
```bash theme={null}
#!/bin/bash
sed -E 's/(.*):([0-9]+):(.*)/\1:\2:0: [error] Found todo in \"\3\" (found-todo)/'"
```
> Tip: Remember to run `chmod u+x todo-finder-parser.sh` so that `trunk` can run it!
and also point the definition of `todo-finder` at it:
```bash theme={null}
version: 0.1
lint:
definitions:
- name: todo-finder
files: [ALL]
commands:
- output: parsable
run: grep --with-filename --line-number --ignore-case todo ${target}
success_codes: [0, 1]
read_output_from: stdout
parser:
run: ${plugin}/todo-finder-parser.sh
```
We can also go another step and push the entire linter definition into a shell script:
```bash theme={null}
#!/bin/bash
grep --with-filename --line-number --ignore-case todo "${1}" | \
sed -E 's/(.*):([0-9]+):(.*)/\1:\2:0: [error] Found todo in \"\3\" (found-todo)/'"
```
```yaml theme={null}
version: 0.1
lint:
definitions:
- name: todo-finder
files: [ALL]
commands:
- output: parsable
run: ${plugin}/todo-finder.sh
success_codes: [0]
```
See our documentation on [custom linters](../../../linters/custom-linters) and [custom parsers](../lint/output-parsing) for more on what you can do, such as writing your parser in Javascript or Python!
### Publishing your plugin
To share your plugin with the world, all you have to do is tag a release and push it to GitHub, GitLab, or some other repository hosting service:
```bash theme={null}
git add .
git commit "Create a TODO finder"
git tag -a v0.0.0 --message "Initial TODO finder release"
git remote add origin
git push origin main v0.0.0
```
Now that it's available on the Internet, everyone else can just use your plugin by running:
```bash theme={null}
trunk plugins add --id=their-first-plugin v0.0.0
```
# Plugins
Source: https://docs.trunk.io/code-quality/overview/getting-started/configuration/plugins/index
### Plugin config merging
Trunk uses a plugin system where a root configuration is defined in the [trunk-io/plugin repository](https://github.com/trunk-io/plugins). You can import many plugin config sources, and fields defined at each level override the level above.
When plugin configs are merged, only fields defined in a config file are merged into the level above. You can define just the fields you wish to override in `.trunk/trunk.yaml and .trunk/user.yaml.`
When using trunk, you can merge several sets of configuration files with a `trunk.yaml` schema. Config merging proceeds as follows:
1. Remote plugins sourced in `.trunk/trunk.yaml` (and `.trunk/user.yaml`). Plugins are sourced in the order they're defined, with later plugins overriding those defined before it. The [`trunk`](https://github.com/trunk-io/plugins) plugin is implicitly sourced first.
2. Your repo level `.trunk/trunk.yaml` file, complete with a CLI version and any definitions or enables. Configurations defined here override what's defined in the remote plugins.
3. Optionally, `.trunk/user.yaml`, a local **git-ignored** file where users can provide their own overrides.
Additionally, any files enumerated in the lint `exported_configs` section are symlinked from their relevant plugin into the root of the workspace when an applicable linter is run with `trunk check`.
### Importing a plugin repository
By default, trunk imports the trunk-io/plugins repository. To import a repo add it to the `plugins.sources` list. Each repo requires a URI and ref.
```yaml theme={null}
plugins:
sources:
- id: trunk
uri: https://github.com/trunk-io/plugins
ref: v1.2.6
```
| Field | Description |
| ------------------------------------ | ---------------------------------------------------------------------------------------------------------------------------------------------- |
| `id` | unique identifier for this repository |
| `uri` | address used to clone the target repository |
| `ref` | commit id or tag to checkout. **Do not use branch names, as these can be unstable** |
| `local` | path to local (on-disk) repository. Takes precedence over uri/ref if defined |
| `import_to_global` (default: `true`) | import content into the global namespace. If set to false actions and linters defined in the plugin must be referenced by `.` |
### Plugin capabilities
Any configuration used in `trunk.yaml` can also be used in a plugin repository, with [some exceptions](./#excluded-fields). A plugin repository must have one root level `plugin.yaml` and can have any number of other `plugin.yaml` files in other subdirectories. These configuration files are then merged into one composite plugin configuration.
The most common use for a plugin repository is to define custom linters, actions, or tools. But they can also be used to define a common set of shared tools across an organization. For more info, see [organization configs](./external-repositories).
The root `plugin.yaml` file may also have a `required_trunk_version` field which governs compatibility when [upgrading](../../../linters/upgrades) between CLI versions.
#### Add a plugin to your `trunk.yaml` file
To add a plugin from GitHub:
```
trunk plugins add https://github.com/trunk-io/plugins --id=trunk
```
To add a plugin from GitHub at a specific version:
```
trunk plugins add https://github.com/trunk-io/plugins v1.2.6 --id=trunk
```
To add a plugin from a local repository:
```
trunk plugins add /home/user/self/hello-world --id=hello-world
```
Note that when specifying a remote plugin, the `ref` field must be a tag or SHA.
### Plugins scope
Plugins are merged serially, in the order that they are sourced, and can override almost any Trunk\
configuration. This allows organizations to provide a set of overrides and definitions in one\
central place.
For instance, you can create your own `my-plugins` repository with `plugin.yaml`:
```yaml theme={null}
version: 0.1
lint:
definitions:
- name: trufflehog
commands:
- name: lint
# override trufflehog to use '--only-verified'
run: trufflehog filesystem --json --fail --only-verified ${target}
enabled:
- ruff@0.0.256
```
sourced in a `.trunk/trunk.yaml` file from another repository as follows:
```yaml theme={null}
version: 0.1
plugins:
sources:
- id: trunk
uri: https://github.com/trunk-io/plugins
ref: v1.2.6
- id: my-plugins
local: ../my-plugins
```
When a user runs `trunk` in the sourcing repository, they will already have `ruff` enabled, along with the `trufflehog` override from the `my-plugins` repository.
Note that private GitHub plugin repositories are not currently supported.
### Excluded fields
Plugin `sources`, as well as the `cli` `version`, are not merged from plugin repositories to ensure\
that config merging occurs in a predictable, stable fashion.
# Runtimes
Source: https://docs.trunk.io/code-quality/overview/getting-started/configuration/runtimes
Trunk manages the hermetic installation of all required runtimes. You can also specifically pin a version of a runtime you'd like Trunk to use, or tell Trunk to reuse an already-installed runtime on the system.
Trunk makes it easy for you to run tools (such as linters and actions) because, under the hood, Trunk actually downloads everything a given tool depends on, and then executes said tool in the context of its dependencies. In other words, you can run tools like `golangci-lint` and `rubocop` without wasting hours figuring out how to install the right Go and Ruby versions on your machine, because Trunk will install a `go` and `ruby` runtime for those tools to depend on.
Importantly, just like how Trunk by design requires you to version your tools, i.e. specify which version of `golangci-lint` and `rubocop` is enabled in your repository at a given commit, Trunk also versions your runtimes. This means that you can stop asking questions like "Wait, which version of Go are you using?" and "How do I choose a Ruby version to install on this new Jenkins runner?"; instead, all you have to do is look at the `runtimes` section in your `.trunk/trunk.yaml`, and you know which version of which runtime Trunk will use for a tool at any given moment:
```
runtimes:
enabled:
- go@1.18.3
- node@16.14.2
- python@3.10.3
- ruby@3.1.0
```
## How does this work?
Runtimes are defined by a combination of configuration and native code inside Trunk itself. Let's walk through an example, `prettier`:
```yaml theme={null}
lint:
definitions:
- name: prettier
runtime: node
package: prettier
commands:
- run: prettier -w ${target}
...
```
Since Prettier uses the `node` runtime, let's also look at that definition; specifically, the `runtime_environment` and `linter_environment`:
```yaml theme={null}
runtimes:
definitions:
- type: node
linter_environment:
- name: PATH
list:
- ${linter}/node_modules/.bin
runtime_environment:
- name: HOME
value: ${home}
- name: PATH
list:
- ${runtime}/bin
```
Now we have all the config fields we need to understand what Trunk does in this example.
### Installing `prettier`
Before Trunk can run `prettier`, it needs to install `prettier`; this is done using the package manager associated with a given runtime, the mechanism for which is defined natively inside Trunk (i.e. Trunk has custom code for every runtime to manage how packages for said runtime are installed).
For most runtimes, this is as simple as executing the runtime's package manager in the context of the `runtime_environment`; in this example, that means doing `npm install ${package}` with environment variables `HOME=${home}` and `PATH=${runtime}/bin`.
### Running `prettier`
Once `prettier` is installed, we combine its runtime's `linter_environment` with any other environment variables that might be defined in a given `lint.definitions` entry (in this case there are none), and then use that as the environment when we execute the command for a given linter.
## Specifying a runtime version
If you would like to use the system-installed runtime instead of the Trunk managed version you can always use the `runtimes.definitions.system_version` property in your `trunk.yaml` file.
```yaml theme={null}
runtimes:
enabled:
- go@x.y.z
# or
runtimes:
enabled:
- go@>=x.y.z
definitions:
- type: go
system_version: allowed
```
If you choose to use a system-managed version, you will also need to specify a runtime version constraint in your enabled section, e.g. `python@>=3.0.0`.
# Telemetry
Source: https://docs.trunk.io/code-quality/overview/getting-started/configuration/telemetry
Trunk sends basic usage metrics from our local tools ([CLI](/code-quality/overview/cli/getting-started) & [VS Code Extension](../../ide-integration/vscode)) to our analytics system to help us understand our usage and improve our tools over time. We do not send your code or codebase to our backend.
## Why we collect usage data
Our product team constantly works on feature enhancement and new areas to invest in. Usage data allows us best to understand the ergonomics and performance of our tools. For example, if we add a new subcommand to the command line interface - how often is it used? Additionally, usage data is gathered to track usage and compliance against our free and paid product offerings.
To give concrete examples: we track our users' client version and operating system to understand backward compatibility requirements, and the time it takes our user base to upgrade to our latest releases.
## Example usage data
```json theme={null}
{
"anonymous_id": ,
"command": "check --all",
"launcher_version": "1.2.3",
"os": "macOS",
"release": 1.4.1,
"source": "client",
"time": ,
"exit_code": 0,
"duration_ms": 232,
"repository":
}
```
## Can I disable usage data?
Yes. You can disable usage telemetry by setting the following environment variable:
```bash theme={null}
TRUNK_TELEMETRY=off
```
# Tools
Source: https://docs.trunk.io/code-quality/overview/getting-started/configuration/tools
Tool definitions
Each tool definition shares a set of attributes:
| Field | |
| -------------------- | ---------------------------------------------------------------------------------------------------------------------------------------------------------------------------------------------------------------------------------------------------------------------------------------------------------------------- |
| `name` | The name of the tool. Must be unique. |
| `known_good_version` | The default version to initialize the tool at (required). |
| `shims` | A list of binaries exposed by the tool. Each of these will correspond to one identically named executable installed in `.trunk/tools.`In the most common case, there is exactly one shim matching the name of the tool. We'll discuss other cases below. |
| `environment` | You can specify an environment for the tool. We provide the `${tool}` template argument that resolves to the installation directory of the tool. By default, we prepend this to `$PATH` within the shim script, so this is used to locate the binary. For legacy reasons, `${linter}` also resolves to this directory. |
> Note: If the tool has a `runtime` attribute, the runtime's environment is merged in to its environment (discussed in the examples below).
Broadly speaking, there are 3 kinds of tools - download, package, and runtime-based tools. We'll look at each one in turn:
#### Download-based tools
Download-based tools are straightforward: They reference a named download configuration in the global `downloads` section. Here is an example:
```yaml theme={null}
downloads:
- name: gh
downloads:
- os:
linux: linux
cpu:
x86_64: amd64
arm_64: arm64
url: https://github.com/cli/cli/releases/download/v${version}/gh_${version}_${os}_${cpu}.tar.gz
strip_components: 1
- os:
windows: windows
cpu:
x86_64: amd64
arm_64: arm64
url: https://github.com/cli/cli/releases/download/v${version}/gh_${version}_${os}_${cpu}.zip
strip_components: 1
# macOS releases since 2.28.0 started using .zip instead of .tar.gz
- os:
macos: macOS
cpu:
x86_64: amd64
arm_64: arm64
url: https://github.com/cli/cli/releases/download/v${version}/gh_${version}_${os}_${cpu}.zip
strip_components: 1
version: ">=2.28.0"
- os:
macos: macOS
cpu:
x86_64: amd64
arm_64: arm64
url: https://github.com/cli/cli/releases/download/v${version}/gh_${version}_${os}_${cpu}.tar.gz
strip_components: 1
tools:
definitions:
- name: gh
download: gh
known_good_version: 2.27.0
environment:
- name: PATH
list: ["${tool}/bin"]
shims: [gh]
```
Note that for the downloaded archive, the binary named `gh` is inside the `bin` directory, so we use the environment to point the `$PATH` there.
#### Download fields
`strip_components`: This number of leading directory components to remove from all files in an archive when extracting.
`rename_single_file`: If an archive contains a single file, this will cause that file to be renamed to the name of the tool. This is most useful for downloads of gzip'd binaries with the platform name in the binary.
#### Package-based tools
Package-based tools depend on specified `package` and `runtime` attributes. Here is an example of configuring `mypy` as a tool:
```yaml theme={null}
tools:
definitions:
- name: mypy
runtime: python
package: mypy
shims: [mypy]
known_good_version: 0.931
extra_packages:
- types-six@1.16.21
- types-request
```
`extra_packages` behaves equivalently to a package file like `requirements.txt` for Python or `package.json` for Node. They can be optionally pinned at versions.
The version of the primary package (in this case, `mypy`) is specified in the `tools.enabled`. So to enable the `mypy` tool at `1.4.0`, list it as `- mypy@1.4.0`.
If you don't want to include additional packages in the tool definition, you can instead make them explicit in the enabled section of your `.trunk/trunk.yaml` as you would for [linters](../../linters/), for example:
```yaml theme={null}
tools:
enabled:
- mypy@1.4.0:
packages:
- types-six@1.16.21
```
#### Runtime-based tools
Runtime-based tools are a special case that are not explicitly defined. Rather, each runtime object exposes a set of `shims` (just like `tool` definitions).
If the runtime is enabled and listed in `tools.runtimes`, then shims exposed by that runtime are automatically installed in the `.trunk/tools` directory alongside those of other tools (`trunk tools enable ` does that for you). Thus you can run `python`, `pip`, etc as `trunk`-managed tools.
Example:
```yaml theme={null}
tools:
runtimes:
- python
```
If this is disruptive to your workflow, simply remove the runtime's name `(go, node, python,...)` from `tools.runtimes` section or run `trunk tools disable ` which will handle it for you. Runtimes cannot be enabled or versioned via the `tools.enabled` section, however, and runtimes must be enabled in the `runtimes` section to be available to have their shims installed.
# Code Quality CLI
Source: https://docs.trunk.io/code-quality/overview/getting-started/index
Trunk provides command-line tools for different products. Choose your product below:
* [Trunk Launcher Install](./install): Trunk uses a launcher to automatically install the appropriate CLI for your platform
* [Trunk Code Quality CLI](./commands-reference/): commands reference
* [Trunk Code Quality CLI Configuration](./configuration/): the Trunk CLI has its top-level config defined in `.trunk/trunk.yaml`
* [Trunk Tools CLI](./tools): manage tools used by your repo
* [Trunk Actions](./actions/): local workflow automation and githooks manager
## Initializing Trunk in a git repo is as simple as running:
```bash theme={null}
trunk init
```
This will scan your repository and create a `.trunk/trunk.yaml` file which enables all the linters, formatters, and security analyzers that [Trunk C](./code-quality)[ode Quality ](./code-quality)recommends.
Security-conscious users may want to also record the signature of the CLI, which the [Trunk Launcher](./install#the-trunk-launcher) will use to verify the CLI's provenance:
```
trunk init --lock
```
### Tweak the configuration
Trunk is completely controlled through the `trunk.yaml` file. If for example you are not using the `check` tool you can safely remove the `lint` section from the file.
[Learn more about CLI configuration](./configuration/)
### Single-player mode
If you want to run `trunk` inside your repository but are not ready to roll it out team-wide, you can run `trunk` in what we call single-player mode.
When in single-player mode, the `.trunk` directory will be listed in `.git/info/exclude`, which will cause git to ignore its contents. When trunk is automatically initialized by the VSCode extension, you will be started in this mode. You can also initialize this way explicitly with the `trunk init --single-player-mode` command. If at any time you wish to toggle single-player mode on or off, it can be done with the following two commands:
```bash theme={null}
# Turn single-player mode on.
trunk config hide
```
```bash theme={null}
# Turn single-player mode off.
trunk config share
```
### Only enabling detected tools
`trunk init` supports the flags `--only-detected-formatters` and `--only-detected-linters`. Each of these flags limits `trunk init` to only enable tools that we detect you are already using.
We provide support for running `trunk` in GitHub Codespaces.
[GitHub Codespaces](https://github.com/features/codespaces) are fully configured virtual containers for developing your GitHub repositories.
# Install
Source: https://docs.trunk.io/code-quality/overview/getting-started/install
### The Trunk launcher
Trunk uses a launcher to automatically install the appropriate CLI for your platform. The launcher is a bash script that downloads the appropriate Trunk CLI version and runs it. The launcher invisibly runs the Trunk CLI version specified in a project's `.trunk/trunk.yaml` file. The actual Trunk CLI is a single binary that is cached locally in `~/.cache/trunk` and is updated automatically.
### Install the launcher
The Trunk CLI can be installed in many different ways, depending on your use case.
#### Using NPM
If your project uses a `package.json`, you can specify the Trunk Launcher as a dependency so your developers can start using Trunk after installing Node dependencies.
```sh npm theme={null}
npm install -D @trunkio/launcher
```
```sh pnpm theme={null}
pnpm add -D @trunkio/launcher
```
```sh yarn theme={null}
yarn add -D @trunkio/launcher
```
```sh bun theme={null}
bun install -D @trunkio/launcher
```
Then add Trunk Launcher in your `package.json` as a script:
```json theme={null}
{
"scripts": {
"trunk": "trunk",
"lint": "trunk check",
"fmt": "trunk fmt"
}
}
```
#### Using cURL
You can install the Trunk Launcher script directly by downloading it through cURL. The launcher script supports both macOS and Linux environments.
To allow your teammates to use `trunk` without installing anything, the launcher can be committed directly into your repo:
```
curl -LO https://trunk.io/releases/trunk
chmod +x trunk
git commit ./trunk -m "Commit Trunk to our repo"
```
When the launcher is called for the first time by your teammates, the Trunk Launcher will download, manage, and run the appropriate binary for the environment.
#### Using Homebrew
You can run the following command if you prefer to install this tool via homebrew. Keep in mind that other developers on your team will also have to install manually.
```bash theme={null}
brew install trunk-io
```
#### Using Windows
From **`git-bash` or `msys2`**, download the Bash launcher and add it to your `PATH`:
```bash theme={null}
curl https://get.trunk.io -fsSL | bash
```
From **`powershell`**, download the powershell launcher:
```
Invoke-RestMethod -Uri https://trunk.io/releases/trunk.ps1 -OutFile trunk.ps1
```
Ensure you can execute powershell scripts:
```
Set-ExecutionPolicy Bypass -Scope CurrentUser
```
You can then execute trunk as `.\trunk.ps1`.
#### Compatibility
Trunk only supports Windows with the following versions and above:
| Tool | Where to Modify | Minimum Required Version |
| ------- | --------------------------------------------------- | ------------------------ |
| CLI | `cli` `version` in `.trunk/trunk.yaml` | `1.13.0` |
| Plugins | `ref` for the `trunk` plugin in `.trunk/trunk.yaml` | `v1.0.0` |
| VSCode | Reload VSCode to update | `3.4.4` |
You will also need to install [C and C++ runtime libraries](https://aka.ms/vs/17/release/vc_redist.x64.exe) in order to run some linters.
### Uninstall instructions
#### From your system
Trunk has a very minimal installation, and therefore, there's not much to uninstall. The two system paths we use are:
* `/usr/local/bin/trunk`: the [Trunk Launcher](./install#the-trunk-launcher)
* `~/.cache/trunk`: cached versions of the trunk cli, linters, formatters, etc.
You can delete those two paths to uninstall.
#### From a repo
To cleanly remove Trunk from a particular repo, run:
```bash theme={null}
trunk deinit
```
#### VS Code extension
To uninstall the Trunk VS Code extension, do so as you would any extension ([docs](https://code.visualstudio.com/docs/editor/extension-marketplace)). Then reload VS Code.
### Binary download (not recommended)
You can directly download the `trunk` binary. *We don't recommend this mode of operation because your ability to version the tool through* `trunk.yaml` *will not function when launching* `trunk` *directly from a downloaded binary.* Regardless you can bypass the launcher support by downloading the prebuilt binaries here:
| variable | options |
| -------- | --------------------------------------------- |
| version | the semver of the binary you want to download |
| platform | 'darwin\`, 'linux' |
```bash theme={null}
# for example https://trunk.io/releases/1.0.0/trunk-1.0.0-linux-x86_64.tar.gz
https://trunk.io/releases/${version}/trunk-${version}-${platform}-x86_64.tar.gz
```
### Pre-installing tools
Trunk hermetically manages all the tools that it runs. To do this, it will download and install them into its cache folder only when they are needed. If you would like to ensure that all tools are installed ahead of time, then you can use the `trunk install` command. This may be useful if you want to prepare to work offline or if you would like to include the tools in a docker image. On Linux and macOS you may find the cache folder at `$HOME/.cache/trunk`.
# Tools
Source: https://docs.trunk.io/code-quality/overview/getting-started/tools
You can use the Trunk CLI to manage tools used by your repo. Trunk CLI can install the tools needed for a project according to what's configured in the `trunk.yaml` config file and let your teammates easily install the same versions of the tools. Trunk will also help you expose those installed tools by dynamically adding them to your `PATH` when you enter the project directory, but will not pollute your `PATH` outside of the project.
### Command line
| trunk tools \ | Description |
| -------------------------------- | ------------------------------------------------------------------------------ |
| `list` | list all available tools in the repository and whether they are enabled or not |
| `install` | install your enabled tools into `.trunk/tools` |
| `enable` `[@version]` | enable the provided tool, optionally at a specified version |
| `disable` `` | disable the provided tool |
### Discovering tools
The Trunk [plugins repo](https://github.com/trunk-io/plugins) ships with a collection of tools that can help supercharge your repository and provide examples for how to write your own. To see a list of tools that you can enable in your own repo run:
```shell theme={null}
trunk tools list
```
![]() ### Configuring shell hooks
Before running any tools managed by Trunk, enable shell hooks. With shell hooks, Trunk can manage your path variable dynamically, which lets you install tools used only in specific repos without polluting your shell by installing global tools. This is especially useful if you work on two repos using the same tool, but locked to different versions.
You can enable shell hooks by running `trunk shellhooks install`, which will install the Trunk hooks to the config file of your \$SHELL. You can also run `trunk shellhooks install
### Configuring shell hooks
Before running any tools managed by Trunk, enable shell hooks. With shell hooks, Trunk can manage your path variable dynamically, which lets you install tools used only in specific repos without polluting your shell by installing global tools. This is especially useful if you work on two repos using the same tool, but locked to different versions.
You can enable shell hooks by running `trunk shellhooks install`, which will install the Trunk hooks to the config file of your \$SHELL. You can also run `trunk shellhooks install ` to install a specific shell hook.
Supported shells:
* bash
* zsh
* tcsh
* fish
* elvish
For organizations that want to require the use of the hooks, they can add to the config file:
```yaml theme={null}
# .trunk/trunk.yaml:
version: 0.1
cli:
shell_hooks:
enforce: true
```
On the next Trunk command (like check or fmt), it will update your shell RC file to load our hooks.
After reloading your shell, whenever you're inside your repo at the command line, you can just run shims installed by `trunk tools` directly by name.
N.B. There is a known incompatibility with direnv when using PATH\_ADD. To use our hooks, remove PATH\_ADD from your .envrc and add them to your Trunk config as such:
```yaml theme={null}
version: 0.1
cli:
shell_hooks:
path_add:
- "${workspace}/tools"
```
Paths can either be absolute, or relative to the workspace using the special `${workspace}` variable.
### Running tools
With shell hooks enabled, you can just run your tools by their name. For example, if you have run `trunk tools install grpcui` to install the GRPC UI tool, you can run it with:
```
grpcui
```
#### Running tools without shell hooks
Trunk installs your enabled tools into the `.trunk/tools` directory. Each tool exposes a list of **shims** (these may or may not be identically named to the tool - most typically a tool has one shim matching the name of the tool). Each shim is installed into the `.trunk/tools` directory.
You can run your tools by referring to the path `/.trunk/tools/` but this is unwieldy. We highly recommend using our shell hooks to manage your PATH.
### Troubleshooting linters
Tools enable you to run your linter binaries on the command line independent of `trunk check` and test and troubleshoot your integrations more easily.
Tools are configured in the `tools` section of `trunk.yaml`. As with other settings, you can override these values in your [User YAML](./configuration/per-user-overrides).
```yaml theme={null}
tools:
auto_sync: false # whether shims should be hot-reloaded off config changes.
enabled:
- bazel@6.0.0
- mypy@1.4.1
- ibazel@0.22.0
- helm@3.9.4
- eksctl@0.74.0
- asciinema@2.1.0
disabled:
- gt
definitions:
- name: gh
download: gh
known_good_version: 2.27.0
environment:
- name: PATH
list: ["${tool}/bin"]
shims: [gh]
```
Like with actions and linters, we have a (versioned) `enabled` section and a `disabled` section, which can be manipulated using `trunk tools enable/disable`. There is also a list of `definitions`, which are merged across your `trunk.yaml`, `user.yaml`, as well as any plugins that you use.
`auto_sync` controls whether or not Trunk automatically installs your tools for you when your config changes. This defaults to `true`. Note that the daemon must be running with the monitor in order for this to function properly.
# GitHub Codespaces
Source: https://docs.trunk.io/code-quality/overview/ide-integration/github-codespaces
We provide support for running `trunk` in GitHub Codespaces.
[GitHub Codespaces](https://github.com/features/codespaces) are fully configured virtual containers for developing your GitHub repositories.
## Installing the Trunk feature
You can install the Trunk Launcher in your codespace by including the following line in your `devcontainer.json` file under `features`:
```json theme={null}
"features": {
"ghcr.io/trunk-io/devcontainer-feature/trunk": "latest",
},
```
The feature is defined [here](https://www.github.com/trunk-io/devcontainer-feature).
To have the launcher binary install the CLI tool and associated linters, you can add `trunk install` to `updateContentCommand` in `devcontainer.json`:
```json theme={null}
"updateContentCommand": "trunk install",
```
Read the [GitHub docs](https://docs.github.com/en/codespaces/prebuilding-your-codespaces/configuring-prebuilds#configuring-time-consuming-tasks-to-be-included-in-the-prebuild) to learn more about `updateContentCommand` .
Note: You should only add `trunk install` if you have a Trunk-configured repository.
You can then [configure pre-builds](https://docs.github.com/en/codespaces/prebuilding-your-codespaces/configuring-prebuilds) to run from GitHub workflows, ensuring the `trunk` CLI and needed linters are available and ready to go when you need to boot up your codespace.
## Installing the Trunk extension
If you are using the Trunk feature, we will automatically install the Trunk extension on your behalf.
Note: We highly recommend turning off auto-save in your VSCode settings in your codespace (or set autosave to a longer timeout). Saving files triggers the extension to re-lint, which can quickly overload the extension for anything but the fastest linters. The auto-save setting is detailed [here](https://code.visualstudio.com/docs/editor/codebasics#_save-auto-save).
Otherwise, You can add `trunk` to your list of extensions in `devcontainer.json` -
```json theme={null}
"customizations": {
"vscode": {
"extensions": [..., "trunk.io"]
}
},
```
Then you're all set to run `trunk` in your Codespace!
# IDE integrations
Source: https://docs.trunk.io/code-quality/overview/ide-integration/index
Code Quality helps you shorten the feedback loop by integrating with your favorite IDEs and code editors.
### How it works
Code Quality runs a daemon that looks for files that change in real time and lints the changes using the same tools and configuration as running `trunk check`. With LSP support, you will get instant feedback on your code changes as you write.
### Supported IDEs
# Neovim
Source: https://docs.trunk.io/code-quality/overview/ide-integration/neovim
The Trunk Code Quality Neovim Plugin is available for beta!
Try it out by following the instructions below.
### Prerequisites
The Neovim Plugin needs the following prerequisites:
| Tool | Minimum Required Version |
| ------ | ------------------------ |
| CLI | 1.17.0 |
| Neovim | v0.9.2 |
### Get started
Using the [lazy.nvim](https://github.com/folke/lazy.nvim#readme) plugin manager:
```lua theme={null}
require("lazy").setup({
{
"trunk-io/neovim-trunk",
lazy = false,
-- optionally pin a version
tag = "v0.1.3",
-- these are optional config arguments (defaults shown)
config = {
-- trunkPath = "trunk",
-- lspArgs = {},
-- formatOnSave = true,
-- formatOnSaveTimeout = 10, -- seconds
-- logLevel = "info"
},
main = "trunk",
dependencies = {"nvim-telescope/telescope.nvim", "nvim-lua/plenary.nvim"}
}
})
```
For other plugin managers and installation methods, see our [Neovim Plugin repo](https://github.com/trunk-io/neovim-trunk#installation).
### Features
The Neovim Plugin is designed to mirror the [VSCode extension](./vscode). Supported features include:
* Provide inline diagnostics and auto-fixes
* Format files on save
* Run [Trunk Actions](../getting-started/actions/) notifications
* Display the linters that Trunk runs on a file
### Limitations
The Trunk Code Quality Neovim Plugin is in beta with limited support. If you encounter any issues, feel free to reach out at [support@trunk.io](mailto:support@trunk.io).
For other notes and configuration, see the [Neovim Plugins repo](https://github.com/trunk-io/neovim-trunk#trunk-check-neovim-plugin).
# OpenAI Codex Support
Source: https://docs.trunk.io/code-quality/overview/ide-integration/openai-codex-support
Trunk Code Quality for OpenAI Codex
This document provides guidance for integrating Trunk Code Quality into OpenAI Codex environments.
### Requirements
Ensure you’re running the following minimum versions in your `.trunk/trunk.yaml` file:
* Trunk CLI: v1.24.0 or later
* Trunk Plugins: v1.7.0 or later
### Installation
In your Codex environment setup script, include:
```
# Install Trunk CLI and dependent tools
curl https://get.trunk.io -fsSL | bash
trunk install
```
It's important to pre-install all trunk dependencies during the setup because codex environments are network-isolated post-setup.
#### Debugging installation
If the environment setup is slow, run the following to diagnose:
```
trunk install --debug
```
This command will detail installation timings and potential bottlenecks.
### Handling network isolation
Codex environments are network-isolated post-setup. Linters requiring network access must be excluded from running explicitly:
Example:
```
trunk check --filter=-trufflehog,-semgrep
```
### Teaching Codex how to use Trunk
Codex can automatically run trunk commands for you, by informing it to do so in your AGENTS.md file:
```
## AGENTS Instructions
### Formatting and Linting
- Run `trunk check -y --filter=-trufflehog,-semgrep` after modifying code to format and fix linting issues.
- Review and verify changes before committing.
- If only formatting is required, run `trunk fmt`.
- Exclude linters requiring network access by adding them to the negative filter list as shown above.
```
# VSCode
Source: https://docs.trunk.io/code-quality/overview/ide-integration/vscode
Trunk Code Quality is available as a [VSCode extension](https://marketplace.visualstudio.com/items?itemName=trunk.io) that you can use to streamline your linting and formatting experience.
### Get started
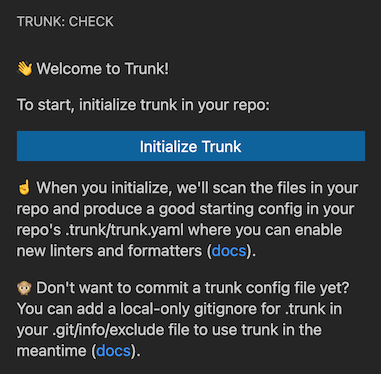
By default, Trunk will try to automatically initialize itself in single-player mode. This means that it'll create a Trunk configuration that is hidden from git, which allows you to try it out [without Trunk's versioning powers](./vscode#single-player-mode).
If Trunk has not initialized itself in single-player mode, then you will need to initialize it manually, either by pressing the 'Initialize Trunk' button in the Trunk side panel:
### Features
#### Discovery
Trunk will suggest tools that will supercharge your development, from `actionlint`, for your GitHub Actions, to`sql-formatter` and `sqlfluff` for your SQL, to`yamllint`, for your YAML files.
We believe that everything in your repository not only can be, but should be, automatically formatted and linted. We recognize that part of this is making it easy for developers to discover tools that apply to their codebases. When Trunk is initialized, we turn on as many additional tools as we can, and periodically follow up with additional suggestions.
#### Seamless user experience
On the sidebar to the left, you'll see the Trunk icon which you can use to open the side panel to view issues. By default, issues are populated for every file you open as well as any modified files.
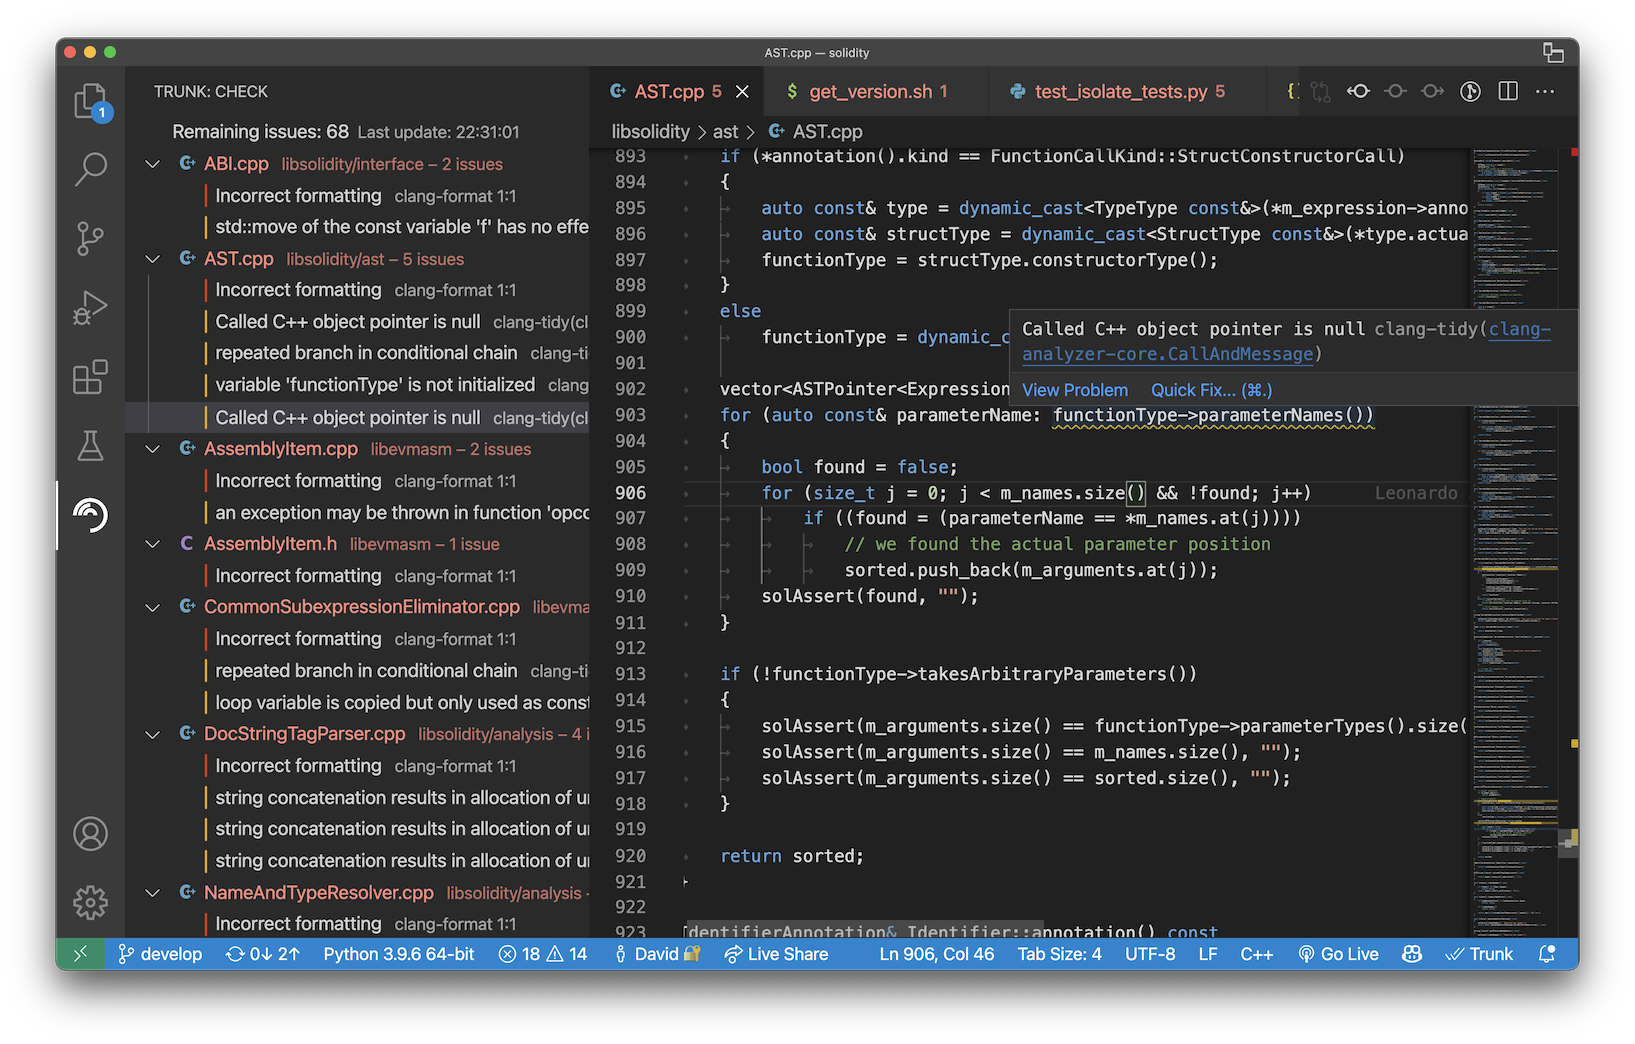
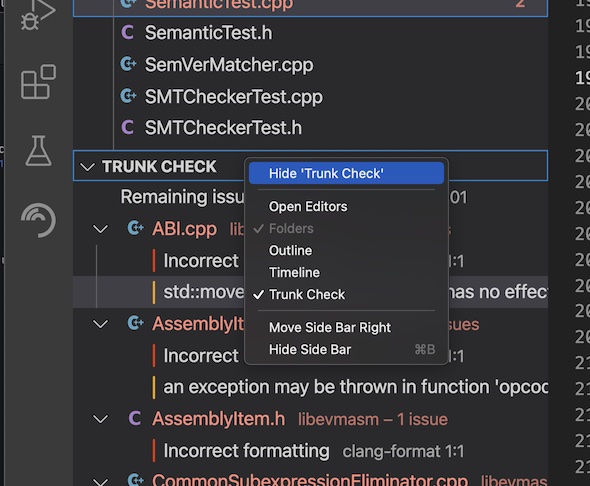
Trunk also shows Trunk Code Quality Issues in a panel in the File Explorer, but you can hide it if you wish:
#### Single-player mode
In single-player mode, Trunk creates a [configuration file](../linters/configure-linters) and hides it from Git, so that you can test out Trunk on your own and get familiar with how it works, without committing this file.
Users normally check this file into your repository so that you can run Trunk reproducibly. It pins the version of trunk, as well as that of every runtime and linter that you've enabled, allowing your team to guarantee that everyone and your CI runners are always running the same checks on your code.
To check it into your repository, all you have to do is run
```bash theme={null}
trunk config share
```
or click on the notification to "Share trunk config", which will commit `.trunk/trunk.yaml`, the Trunk configuration file.
### Trunk as default formatter
You can use Trunk as your default formatter in VSCode if you have Trunk configured for the project.
You can set `trunk.io` as the default formatter for just one language as in the example, or as a default for all languages.
In your `settings.json` like this:
```json theme={null}
"[markdown]": {
"editor.defaultFormatter": "trunk.io"
}
```
For manual formatting, open the command palette and use `Format Document With...` and select `Trunk` there.
### Learn more
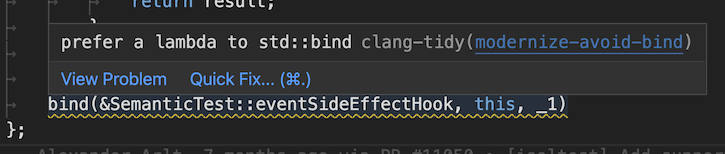
Check out how to [install the CLI](../setup-and-installation/), [set it up in CI](../initialize-trunk), [ignore issues](../linters/ignoring-issues-and-files), and set up [Custom Linters](../linters/custom-linters).
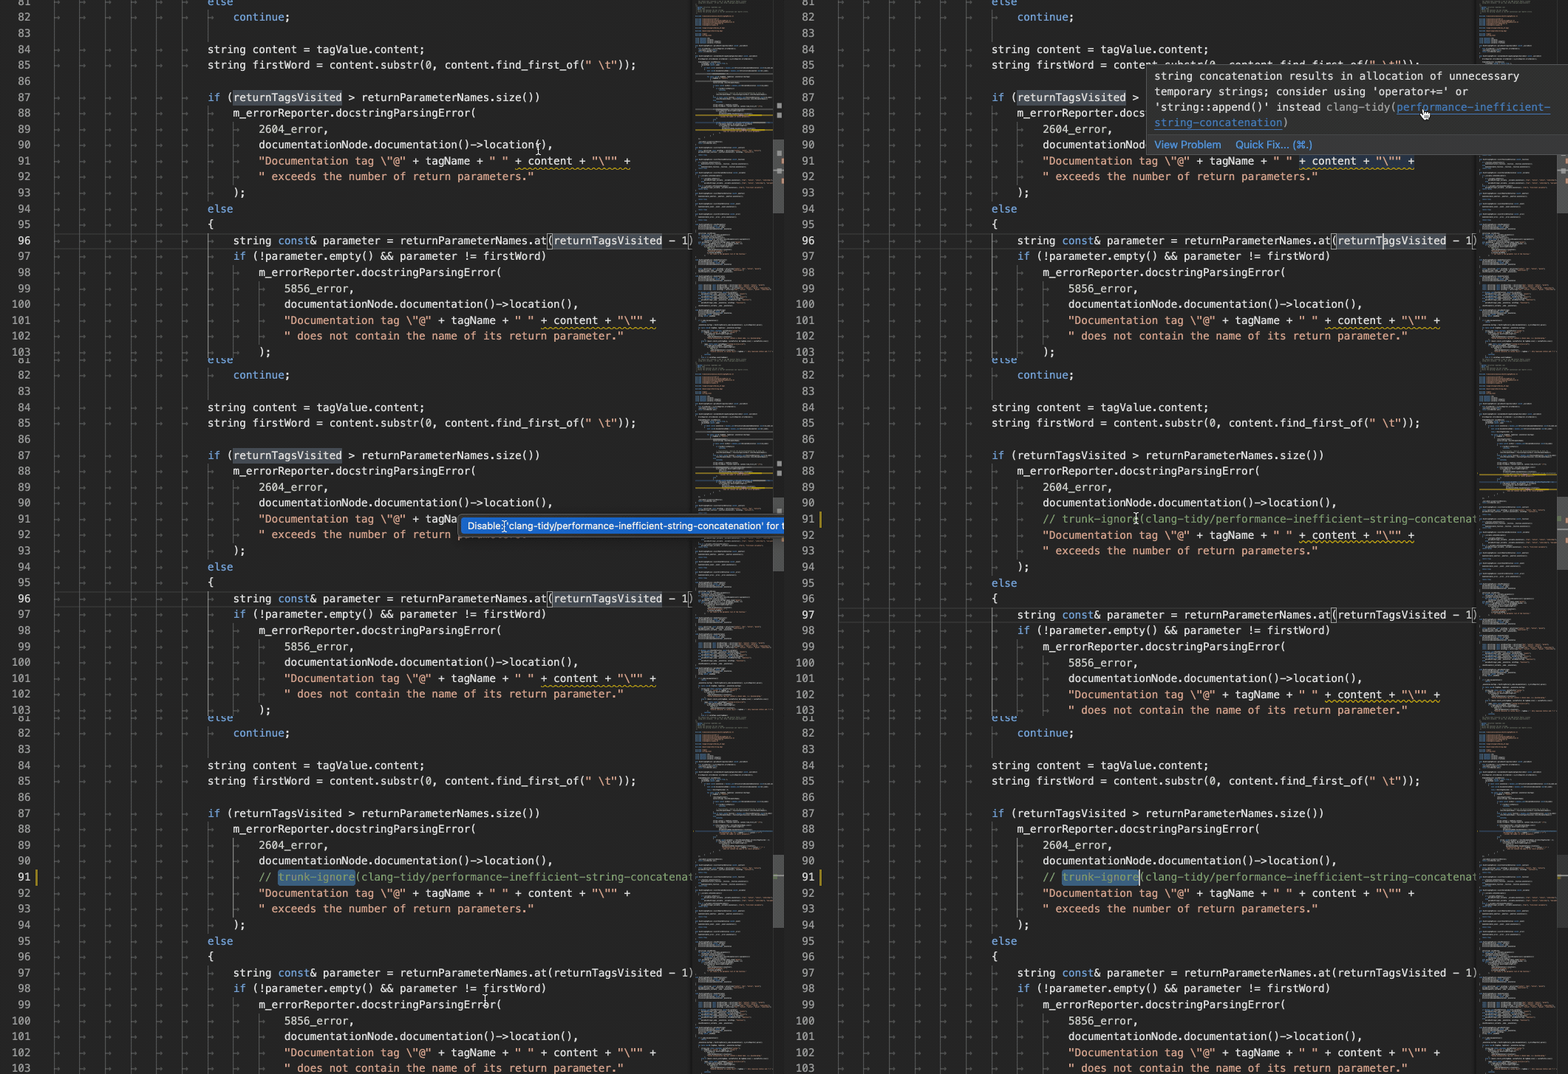
### Configuration
* `trunk.inlineDecorators` – allows you to disable inline decorators for diagnostics.
* `trunk.inlineDecoratorsForAllExtensions` – allows you to only render inline decorators for diagnostics that were generated by Trunk.
### Debugging
If you look at the "Window" output for the extension, you may find useful error logs.
### Feature requests and bug reports
Looking for another feature? Hit a bug? [Let us know!](mailto:support@trunk.io)
# Overview
Source: https://docs.trunk.io/code-quality/overview/index
Trunk Code Quality is a metalinter and static analysis manager designed to unify linting, formatting, and security scanning across polyglot repositories. It consolidates tool management, runtime isolation, and execution logic into a single CLI and daemon.
### Architecture
Trunk consists of a C++ CLI that orchestrates the download, installation, and execution of third-party static analysis tools.
#### Hermetic Tool Management
Trunk manages tools and their runtimes hermetically. Instead of relying on the host system’s environment (e.g., `/usr/bin/python` or global `npm` packages), Trunk downloads and caches specific versions of runtimes required by the linters.
* Isolation: A project requiring Python 3.10 for a specific linter will not conflict with a system installed Python 3.7.
* Consistency: All engineers and CI runners execute the exact same version of the linter and its runtime dependencies.
* Scope: Covers primary languages, Infrastructure as Code (IaC), build scripts, CI configurations (YAML), and documentation.
#### The Trunk Daemon
The CLI (`trunk check`) launches a background daemon. This process:
1. Monitors file system events.
2. Triggers jobs to precompute linting results in the background.
3. Caches results to speed up subsequent checks.
4. Serves real-time annotations to IDE extensions (VSCode, Neovim).
Users can override background execution behavior by modifying the `run_when` configuration for specific tools if they are too compute-intensive.
### Execution Model
#### Git-Aware Scanning
Trunk optimizes execution by checking only modified files or lines. It relies on git diffs to determine the scope of analysis, preventing full-repo scans during standard development workflows.
### Hold-the-line
**Hold The Line** (HTL) is the principle that Trunk Code Quality will *only run on new changes* in your codebase rather than every file in the whole repo. This allows you to use Check to improve your codebase **incrementally** rather than having to address all of the issues at once. HTL also runs checks much faster than scanning the entire codebase would.
*Hold The Line* **works at the line level** of your source code. For example, if a single line has multiple pre-existing issues and a new linter is added, which reports the new issue, then Trunk Code Quality will report just the new issue and not the previous ones.
By default, Trunk runs in hold-the-line mode:
```
trunk check foo.file
```
You can still run on all files.
```
trunk check --all
```
***Hold the Line*** is built into Trunk Code Quality itself. This means existing linters that do not support line-by-line functionality will still work with *Hold the Line*. Even [custom linters](./linters/custom-linters) you write yourself.
### Daemon
The Trunk CLI, specifically `trunk check`, runs a daemon that monitors relevant file changes and triggers jobs to precompute in the background while you work. The daemon is used both to support real-time background checking in supported extensions such as [VSCode](./ide-integration/vscode) and [Neovim](./ide-integration/neovim), and to precompute check results for faster commits/pushes.
Some native linters are more compute/memory intensive and `check` allows you to disable background linting for those tools. By default, linters run whenever a file is modified in the background. You can override this behavior by editing the [`run_when`](./getting-started/configuration/lint/commands#run_when) configuration for a tool.
### Hermetic tools and runtime management
Trunk hermetically installs the static analysis tools you run and their required runtimes. This means these tools are installed and managed by the Trunk CLI, and are unaffected by your systems environment.
If a tool requires `python 3.10` but the projects you're working on require `python 3.7`, Trunk will manage that tool and its `python 3.10` runtime automatically and not affect the `python 3.7` environment. This means Trunk will not modify or pollute your machine.
Trunk manages the hermetic installation of all required runtimes. You can also specifically pin a version of a runtime you'd like Trunk to use, or tell Trunk to reuse an already-installed runtime on the system.
### Plugin system
Trunk is fully extensible and configurable through the [Trunk Plugins Repo](https://github.com/trunk-io/plugins/). When installing a plugin through Trunk, the definition of a plugin's behavior, including install, run, and report instructions, is defined in the Plugins Repo.
This can be overridden by defining your own plugin repo to import, overriding individual linter definitions locally, and even writing your own custom linters.
[Learn more about the plugin system.](./getting-started/configuration/plugins/)
### Run on every pull request
Trunk works in CI. Trunk Code Quality provides [GitHub integration](./setup-and-installation/github-integration) and can run in any other CI environment. This lets you check Code Quality in every PR with consistent config and consistent results.
[Learn more about Code Quality in CI.](./prevent-new-issues/)
### Setup and installation
Trunk Code Quality is easy to adopt for new and legacy projects alike. You can run Trunk Code Quality using your existing linter configurations, incrementally address existing problems, and prevent new issues from being committed to your repo.
Initialize Trunk in your repo to generate Trunk config files and get linter recommendations based on your project's files.
Check for existing issues in your project. You can address problems up front, use hold-the-line to fix them incrementally, and configure ignores for irrelevant issues.
Set up automated runs on commits, before pushes, and on PRs to prevent new issues from appearing in your repo.
# Initialize Trunk
Source: https://docs.trunk.io/code-quality/overview/initialize-trunk
Before you can start using Trunk Code Quality, you need to install and initialize Trunk in your repo. This page covers the initialization process.
### Install the CLI
The Trunk CLI can be installed in many different ways depending on your use case.
We recommend installing the CLI via **NPM** if you’re already using NPM, or using **cURL** and **committing the launcher to Git** for all other projects. Both methods allow your teammates to use Trunk without needing an additional install step.
#### The Trunk Launcher
The easiest way to give everyone access to Trunk is to use the Trunk launcher. The Trunk launcher is a small script that will automatically install and run Trunk when invoked for the first time, similar to other command line tools like the [Gradle Wrapper](https://docs.gradle.org/current/userguide/gradle_wrapper.html).
You can install the [Trunk Launcher](./getting-started/install#the-trunk-launcher) script directly by downloading it through cURL. The launcher script supports both macOS and Linux environments.
```bash bash theme={null}
curl https://get.trunk.io -fsSL | bash
```
```bash bash (no prompts) theme={null}
curl https://get.trunk.io -fsSL | bash -s -- -y
```
To allow your teammates to use `trunk` without installing anything, the launcher can be committed directly into your repo:
```
curl -fsSLO --retry 3 https://trunk.io/releases/trunk
chmod +x ./trunk
git commit ./trunk -m "Commit Trunk to our repo"
```
#### Other ways to install
If your project uses a `package.json`, you can specify the Trunk Launcher as a dependency so your developers can start using Trunk after installing Node dependencies.
```sh theme={null}
# npm
npm install -D @trunkio/launcher
# pnpm
pnpm add -D @trunkio/launcher
# yarn
yarn add -D @trunkio/launcher
# bun
bun install -D @trunkio/launcher
```
Then add Trunk Launcher in your `package.json` as a script:
```json theme={null}
{
"scripts": {
"trunk": "trunk",
"lint": "trunk check",
"fmt": "trunk fmt"
}
}
```
You can run the following command if you prefer to install this tool via [homebrew](https://brew.sh/). Keep in mind that other developers on your team will also have to install manually.
```bash theme={null}
brew install trunk-io
```
From **`git-bash` or `msys2`**, download the Bash launcher and add it to your `PATH`:
```bash theme={null}
curl https://get.trunk.io -fsSL | bash
```
From **`powershell`**, download the powershell launcher:
```
Invoke-RestMethod -Uri https://trunk.io/releases/trunk.ps1 -OutFile trunk.ps1
```
Ensure you can execute powershell scripts:
```
Set-ExecutionPolicy Bypass -Scope CurrentUser
```
You can then execute trunk as `.\trunk.ps1`.
**Compatibility**
Only some versions of Trunk are compatible with Windows. See the compatibility page for [Windows](./getting-started/compatibility) to learn more.
You will also need to install [C and C++ runtime libraries](https://aka.ms/vs/17/release/vc_redist.x64.exe) in order to run some linters.
### Initializing Trunk
Before you can use Trunk, you need to initialize Trunk in your repo. Initializing Trunk will generate the necessary config files, recommend linters based on your project files, and configure githooks.
Initialize Trunk by running the `init` command.
```bash theme={null}
./trunk init
```
Follow the wizard. You'll be prompted with the following options:
1. `Sign up or log in`: Connect the CLI with your Trunk account to enable all of Trunk's features.
2. Trunk will automatically [enable the most useful linters](#recommended-linters) based on the files in your repo.
3. `Trunk will manage your git hooks and enable some built-in hooks.`: This sets up Trunk to run automatically on commit and before you push, saving you time waiting for CI only to have it fail.
4. `Trunk will now run a local, one-time scan of your code and report any issues it finds`: This initial scan will give you a good overview of the problem areas in your code. Subsequent scans will only run on changed lines using hold-the-line.
**Trunk is Git aware**
Trunk speeds up your linting process by running on only the files that have changed in your branch compared to upstream. This means if you're using a base/trunk branch that's not `master` or `main`, you will need to specify it in your `.trunk/trunk.yaml`
```yaml theme={null}
version: 0.1
cli:
version: 1.22.2
repo:
# develop is the branch that everyone's work is merged into
trunk_branch: develop
... rest of configs
```
### Run Linters
After initialization, you can run the [recommended set of linters](./initialize-trunk#recommended-linters) by running:
```
./trunk check
```
:tada: And just like that, you're ready to start using Trunk Code Quality.
### The .trunk Directory
After initialization, a new folder `.trunk` will be generated with the following content.
```
.trunk
├── actions/
├── configs/ # This is where linter configs live
├── logs/ # Logs for debugging
├── notifications/
├── out/
├── plugins/
├── tools/
└── trunk.yaml # Top-level Trunk config
```
You will spend most of your time configuring Trunk Code Quality's linter definitions `trunk.yaml` and individual linter configurations in `configs`.
### Recommended Linters
During initialization, Trunk Code Quality will recommend some linters based on files found in your project. Trunk Code Quality will recommend common linters for your language, but the [full list of supported linters can be found here](./linters/supported/).
You can enable and disable individual linters by running:
```bash theme={null}
trunk check enable
trunk check disable
```
You can also see all linters and whether they're enabled by running:
```bash theme={null}
trunk check list
```
### IDE Integration
Trunk Code Quality supports [VSCode](./ide-integration/vscode) and [Neovim](./ide-integration/neovim) through extensions. Using VSCode and Neovim will provide inline linter annotations as you code.
### Move Existing Configs
If you have existing linter configs in your repo, you can move them into the `.trunk/configs` folder. These config files will be symlinked in during any `trunk check` run.
If you're using an IDE Extension like `clangd` with an LSP that relies on those configs being in the root, you must create an additional symlink from the hidden config to the workspace root.
### Next Steps
After initializing Trunk Code Quality, you can check for issues and configure Code Quality. The [next steps](./deal-with-existing-issues) in Setup & Installation will walk you through this process.
# Licensing
Source: https://docs.trunk.io/code-quality/overview/licensing
### Introduction
Trunk Code Quality is a powerful metalinter that simplifies linting, formatting, and static analysis across your entire codebase. By integrating over 100 supported tools like ESLint, Prettier, Ruff, and more, it enables you to manage code quality with unified configuration and consistent reporting. Trunk Code Quality helps you install tools hermetically, run them efficiently, and integrate seamlessly with pull requests and CI pipelines.
### Licensing overview
Trunk Code Quality is composed of a closed-source core complemented by open-source components that enhance extensibility and integration. Understanding the licensing terms for each part ensures compliance and optimal use.
#### Closed-Source components
* Trunk CLI: The core command-line tool is closed-source but free to use under specific conditions.
* VS Code Extension: Integrates Trunk Code Quality directly into your development environment. Under the hood, all code-checking by the VS Code extension is completed via the Trunk CLI, which drives the VS Code extension.
#### Open-Source components
* Plugin System and Configurations: An extensible plugin system that allows you to define, extend, and share linter configurations. These plugins are open-source under the MIT License, enabling you to modify them or create new ones to integrate additional tools or customize behavior.
* GitHub Action: Scripts that automate Trunk Code Quality checks in your GitHub workflows. GitHub Actions require the source code to be visible for transparency and security. Our GitHub Action is open-source under the MIT License, allowing you to review, modify, and ensure it meets your needs.
By open-sourcing these components, we promote transparency, extensibility, and community collaboration. This approach encourages our community and customers to contribute to the ecosystem, enhancing Trunk Code Quality for everyone.
#### Free usage
You can use the Trunk CLI and access core functionalities for free under the following conditions:
* Open-Source and Public Projects: Unlimited use in public repositories.
* Private Repositories
* Free for teams with up to 5 active non-bot committers.
* An active committer is a non-bot user who has committed in the last 30 days.
#### Paid licensing
For private repositories with over 5 active committers, a paid license is required to comply with Trunk Code Quality’s licensing agreement. While all features remain accessible, payment is necessary to meet licensing obligations and support the continued development of the product.
Compliance and Support
* Licensing Compliance: Payment ensures your use of Trunk Code Quality aligns with the licensing terms for larger teams.
* Dedicated Support: Paid customers receive prioritized support to help with integration, troubleshooting, and maximizing the benefits of Trunk Code Quality.
#### How billing works
Trunk Code Quality offers two billing options for paid licenses:
**1. Team Plan - Monthly Self-Serve Billing**
* Per-Seat Model: Billing is based on the monthly active committers in your private repositories.
* User Count Calculation:
* Counts non-bot users who have made commits in the last 30 days.
* Calculated at the end of each billing period to adjust the next invoice.
* Integration with GitHub App: Install the Trunk GitHub App to allow us to measure active monthly users.
* Billing Cycle: Month-to-month billing with invoices reflecting the latest user count.
**2. Enterprise Plan - Annual Site License**
* Fixed User Count: Based on the number of active committers at the beginning of the licensing term.
* Organization-Wide License: Provides a license for all users in the organization during the entire term without the need to purchase additional licenses for new employees.
* Simplified Billing: One annual payment covers all users for the year.
* Discount: Incentives available with annual plans for logo usage, case study, and/or scale.
**Choosing the Right Option**
* Team Plan: Appropriate for small teams that prefer flexibility and want to pay monthly with a credit card.
* Enterprise Plan: Best for organizations that prefer predictable costs, to avoid the administrative overhead of tracking monthly user counts, and wish to benefit from the discounted rate.
### FAQs
**What are the benefits of paying for Trunk Code Quality?**
Paying for Trunk Code Quality offers several important benefits:
* Licensing Compliance: For private repositories with 5 or more active committers, purchasing a license is required to comply with Trunk Code Quality’s licensing terms and continue using the product legally and effectively.
* Dedicated Support: Receive prioritized assistance to help integrate, troubleshoot, and maximize the product’s benefits in your production environment.
* Priority Feature Requests: Your requests for new features and plugin integrations receive high priority, allowing you to influence the product’s development to suit your needs better.
* Expert Consultation: Access advisory services from our team to optimize your code quality setup and linting processes.
* Onboarding Assistance: Receive support and best practices guidance during the integration of Trunk Code Quality into your workflows.
Importantly, all features are available regardless of licensing status; you do not unlock additional features by purchasing a license. However, buying a license ensures compliance with the licensing terms, supports the continued development of Trunk Code Quality, and provides access to the dedicated support and benefits listed above.
**Do you provide free Proofs of Concept (POCs)?**
Yes, we are happy to provide 2–4 week free POCs for teams that want to evaluate our product's capabilities with their team and as part of their CI. We also provide dedicated support and guidance throughout the POC period. Email us to get started at: [sales@trunk.io](mailto:sales@trunk.io).
**What happens if I exceed the free usage limits?**
If you exceed the free tier limits (e.g., more than 5 active committers in a private repository), you must obtain a paid license to continue using Trunk Code Quality in compliance with the licensing agreement.
**Is the Trunk CLI free to use?**
The Trunk CLI is free for public repositories and private repositories with fewer than 5 active committers. For private repositories with 5 or more active committers, a paid license is required to comply with the licensing agreement.
**Can I use Trunk Code Quality in CI/CD pipelines for free?**
Yes, you can integrate the Trunk CLI into your CI/CD pipelines for free if you’re within the free usage limits (public repositories or private repositories with fewer than 5 active committers). Exceeding these limits requires a paid license.
**Is support provided for free users?**
Yes, free users can reach us at [support@trunk.io](mailto:support@trunk.io). See the [Support page](/setup-and-administration/support) for response-time details.
**Why are some components open-source while the core is closed-source?**
* Core Functionality: The Trunk CLI provides the core functionality and is closed-source to protect proprietary technology and ensure a consistent, reliable experience.
* Open-Source Components: The plugin system and GitHub Action are open-source to promote transparency, security, and community-driven extensibility. This allows you to customize integrations and contribute to the development of plugins and workflows.
**Do I need the Trunk CLI to use the open-source components?**
Yes, the open-source components are designed to work with the Trunk CLI. They enhance and extend the functionality provided by the core tool but are not standalone applications.
**How to Contribute to the Open-Source Components?**
* Plugin Development: You can develop new plugins or improve existing ones by visiting our public GitHub repository at [github.com/trunk-io/plugins](https://github.com/trunk-io/plugins).
* GitHub Action: Modify or fork our GitHub Action to better suit your CI workflows. The source code is available at [github.com/trunk-io/trunk-action](https://github.com/trunk-io/trunk-action).
#### Contact us
For licensing inquiries, to obtain a paid license, or to discuss which billing option is best for your organization, please contact [sales@trunk.io](mailto:sales@trunk.io). We’re here to help you ensure compliance and get the most out of Trunk Code Quality.
# Configure linters
Source: https://docs.trunk.io/code-quality/overview/linters/configure-linters
Trunk Code Quality's linter integrations are fully configurable. This means that you can easily tune existing linters or leverage our caching and [hold-the-line](/code-quality/overview#hold-the-line) solution with your own custom linters.
Here's an overview of the ways you can configure linters.
### Config hierarchy
Linters can be configured at different places:
1. The source plugin repo usually `https://github.com/trunk-io/plugins`.
2. The repo-wide Trunk config file overrides the definitions in the plugin repos, `.trunk/trunk.yaml`
3. Local, per-user configuration in `.trunk/user.yaml` which is used for local overrides of `.trunk/trunk.yaml` and doesn't
4. Per linter configuration in linter config files such as `eslint.config.js` or `.prettierrc`.
### Plugin system
Trunk defines linter configuration in a plugin system. By default, it'll point to the [Trunk plugin repo on GitHub](https://github.com/trunk-io/plugins). You can check if other custom plugin sources are specified in your `trunk.yaml` file for [shared-configs.md](./shared-configs.md).
```yaml theme={null}
version: 0.1
cli:
version: 1.22.2
# Trunk provides extensibility via plugins. (https://docs.trunk.io/cli/configuration/plugins)
plugins:
sources:
- id: trunk
ref: v1.6.1
uri: https://github.com/trunk-io/plugins
```
### Linter definitions
Each linter implemented in the Plugin Repo has its own linter definition. Let's take clang-tidy as an example, which ships with the following default configuration:
```yaml theme={null}
definitions:
...
- name: clang-tidy
files: [c/c++-source]
type: llvm
commands:
- output: llvm
run: clang-tidy --export-fixes=- ${target}
success_codes: [0]
download: clang-tidy
direct_configs: [.clang-tidy]
disable_upstream: true
include_scanner_type: compile_command
environment:
- name: PATH
list: ["${linter}/bin"]
...
```
#### Linter definition reference
You can find the default definitions for linters in the [Plugin Repo](https://github.com/trunk-io/plugins/tree/main/linters) and find references for these fields on the [Linter Definitions](../getting-started/configuration/lint/definitions) page.
### Overriding default linter definitions
You may find while using Trunk that you want to modify one of these defaults: perhaps you want `clang-tidy` to not run on the upstream, or maybe you want the `node` runtime to include another environment variable. In these cases, you can specify the field in your `trunk.yaml` to override the default value.
If you wanted to flip the value of `disable_upstream` to `false`, you could, in your own `trunk.yaml`, specify:
```yaml theme={null}
definitions:
...
- name: clang-tidy
disable_upstream: false
...
```
Overriding definitions in your `trunk.yaml` file doesn't require you to specify the entire definition again. You only need to specify what's being overridden.
#### Configure linter commands
Some linters have multiple commands, such as [Ruff](./supported/ruff), which can run in different ways. By default, Ruff is configured to only run as a linter:
```yaml theme={null}
lint:
enabled:
- ruff@:
commands: [lint]
```
You can configure ruff to also run the format command by adding it to the commands tuple:
```yaml theme={null}
lint:
enabled:
- ruff@:
commands: [lint, format]
```
#### Configure linter platforms
Similarly, some linters are configured to run differently on different platforms or at different versions. When overriding a command definition, overrides are applied on the tuple `[name, version, platforms]`.
For example, if you wanted to disable batching when running [ktlint](https://github.com/trunk-io/plugins/blob/main/linters/ktlint/plugin.yaml) on Windows, you could consider its default configuration:
```yaml theme={null}
definitions:
...
- name: ktlint
...
commands:
- name: format
platforms: [windows]
run: java -jar ${linter}/ktlint.exe -F "${target}"
output: rewrite
cache_results: true
formatter: true
in_place: true
batch: true
success_codes: [0, 1]
- name: format
run: ktlint -F "${target}"
output: rewrite
cache_results: true
formatter: true
in_place: true
batch: true
success_codes: [0, 1]
...
```
And override it as such:
```yaml theme={null}
definitions:
...
- name: ktlint
...
commands:
- name: format
platforms: [windows]
batch: false
...
```
When executing linters, Trunk will execute the first matching command based on its compatible platforms and linter version. Note when overriding that new commands that don't match an existing tuple are prepended to the resulting commands list.
Alternatively, consider the default `node` runtime:
```yaml theme={null}
runtimes:
definitions:
- type: node
download: node
runtime_environment:
- name: HOME
value: ${home}
- name: PATH
list: ["${runtime}/bin"]
linter_environment:
- name: PATH
list: ["${linter}/node_modules/.bin"]
version: 16.14.2
version_commands:
- run: "node --version"
parse_regex: ${semver}
```
If you want to add `${home}/my/special/node/path` to `PATH`, you could specify the following:
```yaml theme={null}
runtimes:
- type: node
runtime_environment:
- name: HOME
value: ${home}
- name: PATH
list: ["${home}/my/special/node/path", "${runtime}/bin"]
```
### Blocking thresholds
All issue severities low-high are considered blocking by default. In cases where you might want to slowly try out a new linter, we provide a mechanism to set specific thresholds for each linter.
```yaml theme={null}
lint:
threshold:
- linters: [clang-tidy]
level: high
```
Every entry in `threshold` defines a set of linters and the severity threshold that is considered blocking. In this example, we're saying that only `high` lint issues should be considered blocking for `clang-tidy`.
| Key | Value |
| ------- | ---------------------------------------------------------------------------------------------------------------------------------------------------------------------------- |
| linters | List of linters (e.g. `[black, eslint]`) or the special `[ALL]` tag |
| level | Default `low`. Threshold at which issues are considered blocking. One of: `note`, `low`, `medium`, `high`, or `none` (this last option will result in issues never blocking) |
### Trigger rules
Some linters do not operate on individual files. Instead, you must lint your entire repo at once. The way this is handled in Trunk is to set up a trigger rule. Most linters will not require the use of a trigger rule.
Trigger rules work on 3 principles:
1. Input(s) that trigger the linters. These can be files, directories, or extended globs.
2. Linter(s) to run when a triggered file is modified.
3. Targets(s) to pass to the linters (can be files or directories).
An example for ansible-lint:
```yaml theme={null}
lint:
enabled:
- ansible-lint@5.3.2
triggers:
- linters:
- ansible-lint
paths:
- ansible # A directory
targets:
- ansible # A directory
```
Triggered linters will also be run when executing trunk check with `--all` so long as a file exists that matches one of the listed paths.
You may use `.` as a target to run on the entire repo instead of an isolated directory.
### File size
By default, Trunk only lints files up to 4 MiB in size. To override this globally, specify a `default_max_file_size` in `lint`:
```yaml theme={null}
lint:
default_max_file_size: 1048576 # Bytes
```
To override this for a specific linter, specify a `max_file_size` in its definition:
```yaml theme={null}
lint:
definitions:
- name: prettier
max_file_size: 2097152 # Bytes
```
### Timeout
Each linter has a default timeout of 10 minutes. If its execution takes longer than this amount of time, Trunk Code Quality will terminate the process and return an error to the user.
To override the timeout for a specific linter, specify a `run_timeout` in its definition:
```
lint:
definitions:
- name: clang-tidy
run_timeout: 5m
```
The `run_timeout` value can be specified in seconds (`s`), minutes (`m`), or hours (`h`).
### Local linter overrides
Trunk can also be managed by the `.trunk/user.yaml` file in your repository. This file is optional, but it allows individual developers to customize how they want `trunk` to run on their machines.
Simply configure `.trunk/user.yaml` as you would for `.trunk/trunk.yaml`. Be mindful that `.trunk/user.yaml` takes precedence over `.trunk/trunk.yaml`, so substantial modifications could violate hermeticity.
### Per linter definitions
Trunk allows you to keep using your existing linter configs, and new linters recommended by Trunk will have their configs added in the `.trunk/configs` folder. These config files will be symlinked in during any `trunk check` run.
If you're using an IDE Extension like clangd with an LSP that relies on those configs being in the root, you will need to create an additional symlink from the hidden config to the workspace root.
#### Moving linters
You can move existing linter config files into the `.trunk/config` folder. You can check which files are automatically symlinked by looking for the `direct_configs` of [each plugin's definition](https://github.com/trunk-io/plugins/). If there are config files not listed, you can add them by overriding the definition like this:
```yaml theme={null}
lint:
definitions:
- name: some_linter_name
direct_configs:
- .custom_config.file
```
# Custom linters
Source: https://docs.trunk.io/code-quality/overview/linters/custom-linters
Trunk Code Quality allows you to define custom linters. If a linter is not within the [list of supported linters](./supported/) or you have a bespoke solution, you can define a custom linter.
### Defining a custom linter
You can define linters right in your `.trunk/trunk.yaml` file in your repo. These definitions have the same configurable parameters as in our [public plugins repo](https://github.com/trunk-io/plugins/blob/main/CONTRIBUTING.md) or [your own plugins repo](../getting-started/configuration/plugins/external-repositories).
#### Pass-Fail linter script example
For example, you can define a simple [pass-fail linter](./custom-linters#pass-fail-linter-script-example) that runs a custom script file. The linter passes or fails based on the status code returned.
```yaml theme={null}
version: 0.1
cli:
version: 1.22.1
lint:
enabled:
- SampleLinter
definitions:
- name: SampleLinter
files: [javascript, typescript]
commands:
- name: lint
run: sh ${workspace}/.trunk/myscript.sh ${target}
output: pass_fail
success_codes: [0, 1]
```
#### Inline grep command example
You can also define simple linters inline using tools like `grep`. This linter will grep against your custom regex pattern, format the output using sed, and then parse the output into pattern groups using a [regex output](../getting-started/configuration/lint/output#regex) for Trunk Code Quality to report.
```yaml theme={null}
# This file controls the behavior of Trunk: https://docs.trunk.io/cli
# To learn more about the format of this file, see https://docs.trunk.io/cli/configuration
version: 0.1
cli:
version: 1.22.1
lint:
enabled:
- SampleGrepLinter
definitions:
- name: SampleGrepLinter
files: [ALL]
commands:
- name: lint
run: bash -c "grep -o -E '' --line-number --with-filename ${target}"
success_codes: [0, 1]
read_output_from: stdout
parser:
run: 'sed -E "s/([^:]*):([0-9]+):(.*)/\1:\2:0: [error] Found \3 in line (numeric-\3)/"'
output: regex
parse_regex: "(?P.*):(?P-?\\d+):(?P[^\\]]*)\\] (?P[^\\(]*) \\((?P[^\\)]*)\\)"
```
To see the configurable fields available [Linter Definition Reference](../getting-started/configuration/lint/definitions).
### Contributing a new linter
The [Trunk Code Quality plugins repo](https://github.com/trunk-io/plugins/blob/main/CONTRIBUTING.md) is public and welcomes contributions. Feel free to open a PR if the new custom linter you defined could be useful to others. You can reach out to us at [support@trunk.io](mailto:support@trunk.io) if you need a hand.
# Ignoring issues and files
Source: https://docs.trunk.io/code-quality/overview/linters/ignoring-issues-and-files
## Ignoring parts of a file
Sometimes we want to deliberately tell a linter that, yes, I know what I'm doing, and yes, in any other situation I should *not* do this, but in this specific case it's fine. Maybe there's a dummy private key you're using for a test stack, or fixing the lint issue will actually make your code less readable: whatever it is, you now need to figure out how to suppress a given lint issue.
Trunk provides a simple, standardized mechanism to do this, saving you from having to look up the linter-specific syntax for doing so:
```cpp theme={null}
struct FooBar {
// trunk-ignore(clang-tidy/modernize-use-nullptr): load-bearing NULL, see ISSUE-832
void *ptr = NULL;
};
```
This tells Trunk that the `clang-tidy` linter found a `modernize-use-nullptr` issue on the highlighted line and that Trunk should suppress this linter issue.
Comments may be omitted:
```cpp theme={null}
struct FooBar {
// trunk-ignore(clang-tidy/modernize-use-nullptr)
void *ptr = NULL;
};
```
You can also omit the name of the check to simply tell Trunk that all issues from a given linter on a specific line should be suppressed:
```cpp theme={null}
struct FooBar {
// trunk-ignore(clang-tidy)
void *ptr = NULL;
};
```
`trunk-ignore` directives can also be placed at the end of the line on which they're suppressing lint issues:
```cpp theme={null}
struct FooBar {
void *ptr1 = NULL; // trunk-ignore(clang-tidy/modernize-use-nullptr)
void *ptr2 = NULL; // trunk-ignore(clang-tidy)
};
```
If you need to suppress issues from multiple linters, `trunk-ignore` supports that too:
```cpp theme={null}
struct FooBar {
// trunk-ignore(clang-tidy): ISSUE-914 explains why the `void *` type is needed
// trunk-ignore(gitleaks,my-custom-linter/do-not-hardcode-passwords): see ISSUE-915
void *super_secret_password = (void *)("915dr~S$Pzqod~oR*CrQ$/SQ@hbtQBked:CL@z!y]");
};
```
`trunk-ignore` directives can also apply to other `trunk-ignore`s if need be:
```ts theme={null}
// trunk-ignore(eslint/max-line-length)
// trunk-ignore(eslint/@typescript-eslint/no-unsafe-member-access,eslint/@typescript-eslint/no-unsafe-assignment)
const version = parsedConfig.version;
```
### Ignoring all issues/formatting in a file
You can also ignore all issues or formatting in a file:
```cpp theme={null}
// trunk-ignore-all(clang-tidy)
struct FooBar {
void *ptr1 = NULL;
void *ptr2 = NULL;
};
```
`trunk-ignore-all` is not required to be the first line of a file, because we recognize that other constructs (shebangs, front matter, docstrings) may need to take precedence.
### Ignoring all issues in a code block
Alternatively, you can ignore all matching issues in a code block:
```cpp theme={null}
struct FooBar {
// trunk-ignore-begin(clang-tidy)
void *ptr1 = NULL;
void *ptr2 = NULL;
// trunk-ignore-end(clang-tidy)
};
```
### Tracking unused ignores
Trunk will alert you if your `trunk-ignore` directives are unused. This can happen due to user error or even innocuously over time, for example, if your internal APIs change or if a linter's output changes.
```
app/parse.ts:18:3
18:3 note trunk-ignore(eslint/@typescript-eslint/no-unsafe-member-access) trunk/ignore-does-nothing
is not suppressing a lint issue
```
Hold the Line will continue to only surface ignore issues that you have introduced, and these issues will have a `note` [severity](./configure-linters#blocking-thresholds), indicating they are non-blocking by default.
If you need to, you can ignore issues from unused `trunk-ignore` directives, using `trunk-ignore(trunk)`:
```
// trunk-ignore(trunk): This error will resurface after our API migration.
// trunk-ignore(eslint/@typescript-eslint/no-unsafe-member-access)
```
### Specification
The syntax of a trunk-ignore directive is as follows:
```
::= "(" ")"
::= "trunk-ignore" | "trunk-ignore-begin" | "trunk-ignore-end" | "trunk-ignore-all"
::=
::= ","
::=
::= "/"
::= ": "
```
## Ignoring multiple files
Some files are never meant to be checked, such as generated code. To ignore them, use the `ignore` key to your `.trunk/trunk.yaml` file:
```yaml theme={null}
lint:
ignore:
- linters: [ALL]
paths:
# Ignore generated files
- src/generated/**
# Except for files ending in .foo
- !src/generated/**/*.foo # Test data
- test/test_data
```
Every entry in `ignore` defines both a set of linters and a set of paths to ignore.
| Key | Value |
| ------- | ----------------------------------------------------------------------------------------------------------------------------------------------------------------------------------------------------------------------------------------------------------------------------------------- |
| linters | List of linters (i.e. `[black, eslint]`) or the special `[ALL]` tag |
| paths | List of [glob paths](https://en.wikipedia.org/wiki/Glob_\(programming\)), relative to the root of the repo, to ignore. If a path begins with a `!` then it represents an inverse ignore. This means that any file matching that glob will not be ignored, even if matched by other globs. |
Trunk is `git`-aware, which means it ignores `gitignore'd` files by default.
### Known issues
`trunk-ignore` does not currently support:
* suppressing findings on lines 0 or 1 using inline/block directives
If you need any of these to be supported, or you have another edge case, please contact us at [support@trunk.io](mailto:support@trunk.io).
# Linters
Source: https://docs.trunk.io/code-quality/overview/linters/index
Trunk Code Quality supports over [100 different linters](./supported/) and formatters out of the box. This section covers how to run, manage, and configure these linters.
### Supported Linters
Trunk supports 100+ different linters and formatters. See the [Supported Linters](./supported/) page to find the linters you need to maintain code quality in your repos.
### Run Linters
Trunk Code Quality supports many flexible ways to run your installed linters, for every project and every occasion.
[Learn the commands available ](./run-linters)for the Trunk CLI.
### Manage Linters
Find and enable the linters you need to keep your code base healthy. Trunk helps you manage your long list of static analysis tools and runtimes through hermetic installs.
[Learn how to discover, install, and upgrade linters](./#manage-linters) in your projects.
### Configure Linters
Trunk Code Quality's linter integrations are fully configurable. This means that you can easily tune existing linters or leverage our caching and [hold-the-line](/code-quality/overview#hold-the-line) solution with your custom linters.
[Learn to configure your linters](./configure-linters) to get the most out of Trunk Code Quality.
### Ignoring Issues and Files
Trunk Code Quality lets you configure flexible ignore for your linters. You can ignore issues by line, by files, by path, by issue type, by severity level, by file extension, and more.
[Learn to ignore irrelevant issues.](./ignoring-issues-and-files)
### Custom Linters
Trunk lets you turn simple scripts into fully-powered linters by running these linters and giving them support for features like ignores, [hold-the-line,](/code-quality/overview#hold-the-line) and other powerful configurable features,
[Learn to create your own Custom Linters.](./custom-linters)
### Shared Configs
If your team has many repositories, many teams, and many languages, you would want to share a common set of config files to keep your **entire organization consistent**.
[Learn to share configurations](./shared-configs) across your org.
# Manage linters
Source: https://docs.trunk.io/code-quality/overview/linters/manage-linters
### Using the CLI
List all of the available linters
```sh theme={null}
trunk check list
```
Enable a single linter
```sh theme={null}
trunk check enable
```
Disable a single linter
```sh theme={null}
trunk check disable
```
### Using Trunk config files
Trunk only runs linters listed in the `enabled` section; linters which are defined in `lint.definitions` but are not listed in `enabled` are not run.
When enabling a linter, you must specify a version for the linter:
```yaml theme={null}
lint:
enabled:
# enabling a version with a linter
- gitleaks@7.6.1
- gofmt@1.16.7
- golangci-lint@1.41.1
- hadolint@2.6.0
```
Custom linters are slightly different; see [those docs](./custom-linters) to learn more.
### Disable linters
Trunk will continuously monitor your repository and make recommendations of additional new tools to run on your codebase. You can tell Trunk not to recommend a specific linter by adding it to the disabled list.
```yaml theme={null}
lint:
disabled:
# disabled a linter tells trunk not to recommend it during upgrade scans
- rufo
- tflint
```
### Upgrading linters
Run `trunk upgrade` to update the Trunk CLI and all your plugins, linters, tools, and runtimes.
# Run Linters
Source: https://docs.trunk.io/code-quality/overview/linters/run-linters
The main commands when running `trunk` from the command line are:
```bash theme={null}
trunk check # runs the universal linter on all applicable files
trunk fmt # runs all the enabled formatters and auto-applies changes
```
You can always find this list using `trunk check --help`.
Trunk is git-aware. When you run `trunk check` it will **only run on files you've modified according to git**. To run on a sampling in your repo, run: `trunk check --sample 5`
### check
`trunk check` runs linters & formatters on your changed files, prompting you to apply fixes. Without additional args, `trunk check` will run all applicable linters on all files changed in the current branch.
### fmt
Run all applicable formatters as configured in `trunk.yaml`. `trunk fmt` is short-hand for running\
`trunk check` with a `--fix --filter` set to all formatters enabled in your repository.
## Options
| options | |
| ------------ | ------------------------------------------------------------------------------------------------------------------------------------- |
| `--all` | Run on all the files in the repository. Useful if trying to assess a new linter in the system, or to find and fix pre-existing issues |
| `--fix` | Auto-apply all suggested fixes |
| `--no-fix` | Surface, but do not prompt for autofixes |
| `--filter` | List of comma-separated linters to run. Specify `--filter=-linter` to disable a linter. |
| `--sample=N` | Run check on a [sampling](#sample) of all files in the repo |
| `--help` | Output help information |
### Recipes
| Check | Command |
| ------------------------------------------------------------ | -------------------------------------------- |
| all files | `trunk check --all --no-fix` |
| a specific file | `trunk check some/file.py` |
| all applicable files with flake8 | `trunk check --all --no-fix --filter=flake8` |
| a selection of five files in the repo | `trunk check --sample 5` |
| a selection of five files in the repo with a specific linter | `trunk check --sample 5 --filter=flake8` |
| format the whole repo | `trunk fmt --all` |
| format a specific file | `trunk fmt some/file.py` |
| format all python code with `black` | `trunk fmt --all --filter=black` |
# Shared configs
Source: https://docs.trunk.io/code-quality/overview/linters/shared-configs
## Single repo
Linters are automatically shared with all developers for a repository using the [`.trunk/trunk.yaml` file](../getting-started/configuration/). This file is committed to the repo, so whenever anyone checks out the code, they will get the same configuration and linters. See the [Trunk YAML guide](../getting-started/configuration/) for more details.
## Per user config
If you wish to customize a linter for just one developer (say, disable a slow linter on a slow machine), you can create a per-user config in the `.trunk/user.yaml` file, which should **not** be committed to the repo.
## Multiple repos
If you wish to share linters between different repos, copy the config manually or create a shared Plugin repo. This is a set of configuration and code that is imported into the `plugins` section of a project's `./trunk/trunk.yaml` .
# Actionlint
Source: https://docs.trunk.io/code-quality/overview/linters/supported/actionlint
Explore our guide on Actionlint, the linter for GitHub Actions. Learn about its features, installation, and configuration.
[**Actionlint**](https://github.com/rhysd/actionlint) is a linter for GitHub.
You can enable the Actionlint linter with:
```shell theme={null}
trunk check enable actionlint
```
## Auto Enabling
Actionlint will be auto-enabled if any *GitHub-workflow* files are present.
## Settings
Actionlint supports the following config files:
* `.github/actionlint.yaml`
* `.github/actionlint.yml`
Unlike with most tools under `trunk check`, these files cannot be moved.
## Links
* [Actionlint site](https://github.com/rhysd/actionlint)
* Actionlint Trunk Code Quality [integration source](https://github.com/trunk-io/plugins/tree/main/linters/actionlint)
* Trunk Code Quality's [open source plugins repo](https://github.com/trunk-io/plugins/tree/main)
# Ansible-lint
Source: https://docs.trunk.io/code-quality/overview/linters/supported/ansible-lint
Checks playbooks for practices and behavior that could potentially be improved and can fix some of the most common ones for you
[**Ansible-lint**](https://github.com/ansible/ansible-lint) is a linter for Ansible.
You can enable the Ansible-lint linter with:
```shell theme={null}
trunk check enable ansible-lint
```
## Auto Enabling
Ansible-lint will never be auto-enabled. It must be enabled manually.
## Settings
Ansible-lint supports the following config files:
* `.ansible-lint`
You can move these files to `.trunk/configs` and `trunk check` will still find them. See [Moving Linters](../configure-linters#moving-linters) for more info.
## Usage Notes
**Ansible-lint** must be configured with a trigger. See the [trigger rules](../#trigger-rules) documentation for more information.
If your ansible setup is not contained within a single folder you would list all files and directories belonging to your ansible setup.
## Links
* [Ansible-lint site](https://github.com/ansible/ansible-lint)
* Ansible-lint Trunk Code Quality [integration source](https://github.com/trunk-io/plugins/tree/main/linters/ansible-lint)
* Trunk Code Quality's [open source plugins repo](https://github.com/trunk-io/plugins/tree/main)
# Autopep8
Source: https://docs.trunk.io/code-quality/overview/linters/supported/autopep8
Autopep8 automatically formats Python code to meet PEP 8 standards, using pycodestyle to identify and correct formatting issues for cleaner code.
[**Autopep8**](https://github.com/hhatto/autopep8#readme) is a formatter for Python.
You can enable the Autopep8 formatter with:
```shell theme={null}
trunk check enable autopep8
```
![autopep8 example output]() ## Auto Enabling
Autopep8 will be auto-enabled if a `.pep8` config file is present.
## Settings
Autopep8 supports the following config files:
* `.pep8`
You can move these files to `.trunk/configs` and `trunk check` will still find them. See [Moving Linters](../configure-linters#moving-linters) for more info.
## Links
* [Autopep8 site](https://github.com/hhatto/autopep8#readme)
* Autopep8 Trunk Code Quality [integration source](https://github.com/trunk-io/plugins/tree/main/linters/autopep8)
* Trunk Code Quality's [open source plugins repo](https://github.com/trunk-io/plugins/tree/main)
# Bandit
Source: https://docs.trunk.io/code-quality/overview/linters/supported/bandit
Bandit is a security linter for Python codebases. Bandit flags problems like hard-coded passwords, injection vulnerabilities, and the use of insecure libraries.
[**Bandit**](https://github.com/PyCQA/bandit) is a linter for Python.
You can enable the Bandit linter with:
```shell theme={null}
trunk check enable bandit
```
## Auto Enabling
Autopep8 will be auto-enabled if a `.pep8` config file is present.
## Settings
Autopep8 supports the following config files:
* `.pep8`
You can move these files to `.trunk/configs` and `trunk check` will still find them. See [Moving Linters](../configure-linters#moving-linters) for more info.
## Links
* [Autopep8 site](https://github.com/hhatto/autopep8#readme)
* Autopep8 Trunk Code Quality [integration source](https://github.com/trunk-io/plugins/tree/main/linters/autopep8)
* Trunk Code Quality's [open source plugins repo](https://github.com/trunk-io/plugins/tree/main)
# Bandit
Source: https://docs.trunk.io/code-quality/overview/linters/supported/bandit
Bandit is a security linter for Python codebases. Bandit flags problems like hard-coded passwords, injection vulnerabilities, and the use of insecure libraries.
[**Bandit**](https://github.com/PyCQA/bandit) is a linter for Python.
You can enable the Bandit linter with:
```shell theme={null}
trunk check enable bandit
```
![bandit example output]() ## Auto Enabling
Bandit will be auto-enabled if any *Python* files are present.
## Settings
Bandit supports the following config files:
* `.bandit`
You can move these files to `.trunk/configs` and `trunk check` will still find them. See [Moving Linters](../configure-linters#moving-linters) for more info.
## Links
* [Bandit site](https://github.com/PyCQA/bandit)
* Bandit Trunk Code Quality [integration source](https://github.com/trunk-io/plugins/tree/main/linters/bandit)
* Trunk Code Quality's [open source plugins repo](https://github.com/trunk-io/plugins/tree/main)
# Biome
Source: https://docs.trunk.io/code-quality/overview/linters/supported/biome
Biome is a linter for JavaScript and TypeScript, improving code quality by automatically fixing issues, enforcing standards, and ensuring consistency.
[**Biome**](https://biomejs.dev/) is a linter for JavaScript, TypeScript, jsx and json.
You can enable the Biome linter with:
```shell theme={null}
trunk check enable biome
```
## Auto Enabling
Biome will be auto-enabled if any of its config files are present: *`biome.json`, `rome.json`*.
## Settings
Biome supports the following config files:
* `biome.json`
* `rome.json`
You can move these files to `.trunk/configs` and `trunk check` will still find them. See [Moving Linters](../configure-linters#moving-linters) for more info.
## Links
* [Biome site](https://biomejs.dev/)
* Biome Trunk Code Quality [integration source](https://github.com/trunk-io/plugins/tree/main/linters/biome)
* Trunk Code Quality's [open source plugins repo](https://github.com/trunk-io/plugins/tree/main)
# Black
Source: https://docs.trunk.io/code-quality/overview/linters/supported/black
Discover Black, the Python code formatter. Learn how to integrate it with Trunk Check for seamless coding style enforcement.
[**Black**](https://pypi.org/project/black/) is a formatter for Python.
You can enable the Black formatter with:
```shell theme={null}
trunk check enable black
```
## Auto Enabling
Bandit will be auto-enabled if any *Python* files are present.
## Settings
Bandit supports the following config files:
* `.bandit`
You can move these files to `.trunk/configs` and `trunk check` will still find them. See [Moving Linters](../configure-linters#moving-linters) for more info.
## Links
* [Bandit site](https://github.com/PyCQA/bandit)
* Bandit Trunk Code Quality [integration source](https://github.com/trunk-io/plugins/tree/main/linters/bandit)
* Trunk Code Quality's [open source plugins repo](https://github.com/trunk-io/plugins/tree/main)
# Biome
Source: https://docs.trunk.io/code-quality/overview/linters/supported/biome
Biome is a linter for JavaScript and TypeScript, improving code quality by automatically fixing issues, enforcing standards, and ensuring consistency.
[**Biome**](https://biomejs.dev/) is a linter for JavaScript, TypeScript, jsx and json.
You can enable the Biome linter with:
```shell theme={null}
trunk check enable biome
```
## Auto Enabling
Biome will be auto-enabled if any of its config files are present: *`biome.json`, `rome.json`*.
## Settings
Biome supports the following config files:
* `biome.json`
* `rome.json`
You can move these files to `.trunk/configs` and `trunk check` will still find them. See [Moving Linters](../configure-linters#moving-linters) for more info.
## Links
* [Biome site](https://biomejs.dev/)
* Biome Trunk Code Quality [integration source](https://github.com/trunk-io/plugins/tree/main/linters/biome)
* Trunk Code Quality's [open source plugins repo](https://github.com/trunk-io/plugins/tree/main)
# Black
Source: https://docs.trunk.io/code-quality/overview/linters/supported/black
Discover Black, the Python code formatter. Learn how to integrate it with Trunk Check for seamless coding style enforcement.
[**Black**](https://pypi.org/project/black/) is a formatter for Python.
You can enable the Black formatter with:
```shell theme={null}
trunk check enable black
```
![black example output]() ## Auto Enabling
Black will be auto-enabled if any *Python, Jupyter or Python-interface* files are present.
## Links
* [Black site](https://pypi.org/project/black/)
* Black Trunk Code Quality [integration source](https://github.com/trunk-io/plugins/tree/main/linters/black)
* Trunk Code Quality's [open source plugins repo](https://github.com/trunk-io/plugins/tree/main)
# Brakeman
Source: https://docs.trunk.io/code-quality/overview/linters/supported/brakeman
Brakeman is a static analysis tool designed for Ruby on Rails applications. It statically analyzes Rails application code to find security issues.
[**Brakeman**](https://github.com/presidentbeef/brakeman) is a linter for Ruby.
You can enable the Brakeman linter with:
```shell theme={null}
trunk check enable brakeman
```
## Auto Enabling
Brakeman will be auto-enabled if any *Ruby* files are present.
## Settings
Brakeman supports the following config files:
* `brakeman.ignore`
You can move these files to `.trunk/configs` and `trunk check` will still find them. See [Moving Linters](../configure-linters#moving-linters) for more info.
## Links
* [Brakeman site](https://github.com/presidentbeef/brakeman)
* Brakeman Trunk Code Quality [integration source](https://github.com/trunk-io/plugins/tree/main/linters/brakeman)
* Trunk Code Quality's [open source plugins repo](https://github.com/trunk-io/plugins/tree/main)
# buf
Source: https://docs.trunk.io/code-quality/overview/linters/supported/buf
buf is a linter for Protobuf
[**buf**](https://github.com/bufbuild/buf#readme) is a linter for Protobuf.
buf is composed of several linter commands.
`buf-format` only runs the reformatting, not lint checking.
You can enable the `buf-format` linter with:
```shell theme={null}
trunk check enable buf-format
```
`buf-lint` only runs the lint checking, not reformatting.
You can enable the `buf-lint` linter with:
```shell theme={null}
trunk check enable buf-lint
```
`buf-breaking` only checks for breaking proto changes.
You can enable the `buf-breaking` linter with:
```shell theme={null}
trunk check enable buf-breaking
```
## Auto Enabling
buf will never be auto-enabled. It must be enabled manually.
## Settings
buf supports the following config files:
* `buf.yaml`
You can move these files to `.trunk/configs` and `trunk check` will still find them. See [Moving Linters](../configure-linters#moving-linters) for more info.
## Links
* [buf site](https://github.com/bufbuild/buf#readme)
* buf Trunk Code Quality [integration source](https://github.com/trunk-io/plugins/tree/main/linters/buf)
* Trunk Code Quality's [open source plugins repo](https://github.com/trunk-io/plugins/tree/main)
# Buildifier
Source: https://docs.trunk.io/code-quality/overview/linters/supported/buildifier
Learn how to install, configure, and use buildifier effectively for Bazel build scripts.
[**Buildifier**](https://github.com/rhysd/actionlint) is a linter for Bazel, Starlark.
You can enable the Buildifier linter with:
```shell theme={null}
trunk check enable buildifier
```
## Auto Enabling
Black will be auto-enabled if any *Python, Jupyter or Python-interface* files are present.
## Links
* [Black site](https://pypi.org/project/black/)
* Black Trunk Code Quality [integration source](https://github.com/trunk-io/plugins/tree/main/linters/black)
* Trunk Code Quality's [open source plugins repo](https://github.com/trunk-io/plugins/tree/main)
# Brakeman
Source: https://docs.trunk.io/code-quality/overview/linters/supported/brakeman
Brakeman is a static analysis tool designed for Ruby on Rails applications. It statically analyzes Rails application code to find security issues.
[**Brakeman**](https://github.com/presidentbeef/brakeman) is a linter for Ruby.
You can enable the Brakeman linter with:
```shell theme={null}
trunk check enable brakeman
```
## Auto Enabling
Brakeman will be auto-enabled if any *Ruby* files are present.
## Settings
Brakeman supports the following config files:
* `brakeman.ignore`
You can move these files to `.trunk/configs` and `trunk check` will still find them. See [Moving Linters](../configure-linters#moving-linters) for more info.
## Links
* [Brakeman site](https://github.com/presidentbeef/brakeman)
* Brakeman Trunk Code Quality [integration source](https://github.com/trunk-io/plugins/tree/main/linters/brakeman)
* Trunk Code Quality's [open source plugins repo](https://github.com/trunk-io/plugins/tree/main)
# buf
Source: https://docs.trunk.io/code-quality/overview/linters/supported/buf
buf is a linter for Protobuf
[**buf**](https://github.com/bufbuild/buf#readme) is a linter for Protobuf.
buf is composed of several linter commands.
`buf-format` only runs the reformatting, not lint checking.
You can enable the `buf-format` linter with:
```shell theme={null}
trunk check enable buf-format
```
`buf-lint` only runs the lint checking, not reformatting.
You can enable the `buf-lint` linter with:
```shell theme={null}
trunk check enable buf-lint
```
`buf-breaking` only checks for breaking proto changes.
You can enable the `buf-breaking` linter with:
```shell theme={null}
trunk check enable buf-breaking
```
## Auto Enabling
buf will never be auto-enabled. It must be enabled manually.
## Settings
buf supports the following config files:
* `buf.yaml`
You can move these files to `.trunk/configs` and `trunk check` will still find them. See [Moving Linters](../configure-linters#moving-linters) for more info.
## Links
* [buf site](https://github.com/bufbuild/buf#readme)
* buf Trunk Code Quality [integration source](https://github.com/trunk-io/plugins/tree/main/linters/buf)
* Trunk Code Quality's [open source plugins repo](https://github.com/trunk-io/plugins/tree/main)
# Buildifier
Source: https://docs.trunk.io/code-quality/overview/linters/supported/buildifier
Learn how to install, configure, and use buildifier effectively for Bazel build scripts.
[**Buildifier**](https://github.com/rhysd/actionlint) is a linter for Bazel, Starlark.
You can enable the Buildifier linter with:
```shell theme={null}
trunk check enable buildifier
```
![buildifier example output]() ## Auto Enabling
Buildifier will be auto-enabled if any *Bazel or Starlark* files are present.
## Settings
Buildifier supports the following config files:
* `.buildifier.json`
* `.buildifier-tables.json`
You can move these files to `.trunk/configs` and `trunk check` will still find them. See [Moving Linters](../configure-linters#moving-linters) for more info.
## Links
* [Buildifier site](https://github.com/rhysd/actionlint)
* Buildifier Trunk Code Quality [integration source](https://github.com/trunk-io/plugins/tree/main/linters/buildifier)
* Trunk Code Quality's [open source plugins repo](https://github.com/trunk-io/plugins/tree/main)
# cfnlint
Source: https://docs.trunk.io/code-quality/overview/linters/supported/cfnlint
cfnlint is a linter for CloudFormation
[**cfnlint**](https://github.com/aws-cloudformation/cfn-lint#readme) is a linter for CloudFormation.
You can enable the cfnlint linter with:
```shell theme={null}
trunk check enable cfnlint
```
## Auto Enabling
cfnlint will be auto-enabled if any *CloudFormation* files are present.
## Links
* [cfnlint site](https://github.com/aws-cloudformation/cfn-lint#readme)
* cfnlint Trunk Code Quality [integration source](https://github.com/trunk-io/plugins/tree/main/linters/cfnlint)
* Trunk Code Quality's [open source plugins repo](https://github.com/trunk-io/plugins/tree/main)
# Checkov
Source: https://docs.trunk.io/code-quality/overview/linters/supported/checkov
Checkov is a static code analysis tool for scanning infrastructure as code. It identifies misconfigurations in IaC files that could lead to security breaches.
[**Checkov**](https://github.com/bridgecrewio/checkov) is a linter for CloudFormation, Security, Terraform and Docker.
You can enable the Checkov linter with:
```shell theme={null}
trunk check enable checkov
```
## Auto Enabling
Buildifier will be auto-enabled if any *Bazel or Starlark* files are present.
## Settings
Buildifier supports the following config files:
* `.buildifier.json`
* `.buildifier-tables.json`
You can move these files to `.trunk/configs` and `trunk check` will still find them. See [Moving Linters](../configure-linters#moving-linters) for more info.
## Links
* [Buildifier site](https://github.com/rhysd/actionlint)
* Buildifier Trunk Code Quality [integration source](https://github.com/trunk-io/plugins/tree/main/linters/buildifier)
* Trunk Code Quality's [open source plugins repo](https://github.com/trunk-io/plugins/tree/main)
# cfnlint
Source: https://docs.trunk.io/code-quality/overview/linters/supported/cfnlint
cfnlint is a linter for CloudFormation
[**cfnlint**](https://github.com/aws-cloudformation/cfn-lint#readme) is a linter for CloudFormation.
You can enable the cfnlint linter with:
```shell theme={null}
trunk check enable cfnlint
```
## Auto Enabling
cfnlint will be auto-enabled if any *CloudFormation* files are present.
## Links
* [cfnlint site](https://github.com/aws-cloudformation/cfn-lint#readme)
* cfnlint Trunk Code Quality [integration source](https://github.com/trunk-io/plugins/tree/main/linters/cfnlint)
* Trunk Code Quality's [open source plugins repo](https://github.com/trunk-io/plugins/tree/main)
# Checkov
Source: https://docs.trunk.io/code-quality/overview/linters/supported/checkov
Checkov is a static code analysis tool for scanning infrastructure as code. It identifies misconfigurations in IaC files that could lead to security breaches.
[**Checkov**](https://github.com/bridgecrewio/checkov) is a linter for CloudFormation, Security, Terraform and Docker.
You can enable the Checkov linter with:
```shell theme={null}
trunk check enable checkov
```
![checkov example output]() ## Auto Enabling
Checkov will be auto-enabled if any *Terraform, CloudFormation, Docker, Yaml or Json* files are present.
## Settings
Checkov supports the following config files:
* `.checkov.yml`
* `.checkov.yaml`
You can move these files to `.trunk/configs` and `trunk check` will still find them. See [Moving Linters](../configure-linters#moving-linters) for more info.
## Links
* [Checkov site](https://github.com/bridgecrewio/checkov)
* Checkov Trunk Code Quality [integration source](https://github.com/trunk-io/plugins/tree/main/linters/checkov)
* Trunk Code Quality's [open source plugins repo](https://github.com/trunk-io/plugins/tree/main)
# circleci
Source: https://docs.trunk.io/code-quality/overview/linters/supported/circleci
circleci is a linter for CircleCI Config
[**circleci**](https://github.com/CircleCI-Public/circleci-cli#readme) is a linter for CircleCI Config.
You can enable the circleci linter with:
```shell theme={null}
trunk check enable circleci
```
## Auto Enabling
circleci will never be auto-enabled. It must be enabled manually.
## Links
* [circleci site](https://github.com/CircleCI-Public/circleci-cli#readme)
* circleci Trunk Code Quality [integration source](https://github.com/trunk-io/plugins/tree/main/linters/circleci)
* Trunk Code Quality's [open source plugins repo](https://github.com/trunk-io/plugins/tree/main)
# ClangFormat
Source: https://docs.trunk.io/code-quality/overview/linters/supported/clang-format
Clang Format is a set of tools to format code that is processed by the Clang compiler suite.
[**ClangFormat**](https://clang.llvm.org/docs/ClangFormat.html) is a formatter for Protobuf and C, C++.
You can enable the ClangFormat formatter with:
```shell theme={null}
trunk check enable clang-format
```
## Auto Enabling
ClangFormat will be auto-enabled if a `.clang-format` config file is present.
## Settings
ClangFormat supports the following config files:
* `.clang-format`
You can move these files to `.trunk/configs` and `trunk check` will still find them. See [Moving Linters](../configure-linters#moving-linters) for more info.
## Usage Notes
By default, Trunk uses ClangFormat to additionally format `.proto` files. However, for this to work, you need to have told `clang-format` to do so in your `.clang-format` config file. You can do that by adding the following to the end of your `.clang-format file`:
```yaml theme={null}
---
Language: Proto
```
For example, you might have this for your entire `.clang-format` file:
```yaml theme={null}
BasedOnStyle: Google
ColumnLimit: 100
---
Language: Cpp
DerivePointerAlignment: false
---
Language: Proto
```
## Links
* [ClangFormat site](https://clang.llvm.org/docs/ClangFormat.html)
* ClangFormat Trunk Code Quality [integration source](https://github.com/trunk-io/plugins/tree/main/linters/clang-format)
* Trunk Code Quality's [open source plugins repo](https://github.com/trunk-io/plugins/tree/main)
# clang-tidy
Source: https://docs.trunk.io/code-quality/overview/linters/supported/clang-tidy
A clang-based C++ linter tool to provide an extensible framework for diagnosing and fixing programming errors that can be deduced via static analysis.
## clang-tidy
[**clang-tidy**](https://clang.llvm.org/extra/clang-tidy/) is a linter for Protobuf and C, C++.
You can enable the clang-tidy linter with:
```shell theme={null}
trunk check enable clang-tidy
```
### Auto Enabling
clang-tidy will be auto-enabled if a `.clang-tidy` config file is present.
### Settings
clang-tidy supports the following config files:
* `.clang-tidy`
You can move these files to `.trunk/configs` and `trunk check` will still find them. See [Moving Linters](../configure-linters#moving-linters) for more info. Trunk Code Quality provides a default `.clang-tidy` if your project does not already have one.
### Usage Notes
We only support using clang-tidy from Bazel and CMake projects.
In order to only see issues in your own code, not from library header files your code includes, add this to your `.clang-tidy` file:
```yaml theme={null}
HeaderFilterRegex: \./.+
```
You may have to build your project first if you depend on any generated header files.
## Linter Failures
If a file you're linting does not compile, clang-tidy may fail to process it. In `trunk`, this will show up as a *Linter Failure*. The output you'll see will look like a compilation error. This can also happen if the pre-reqs to running clang-tidy haven't been met (see below).
## Using Bazel
By default Trunk will query `bazel` for compile commands used to run `clang-tidy`. This requires no configuration.
Trunk will build needed compilation pre-requisites before invoking `clang-tidy` on each file (e.g. generated protobuf headers).
You can generate a local compilation database by running `trunk generate-compile-commands`.
**Finding the bazel binary**
Trunk will search for the `bazel` binary in two ways.
* Paths relative to the workspace root.
* Binaries in any of the directories in the PATH environment variable.
First trunk will search all workspace root relative paths and then all system directories. If you override anything in `lint.bazel.paths` then we only search the paths you specify. By default the configuration is as follows.
```yaml theme={null}
lint:
bazel:
paths:
workspace:
- tools/bazel
- bazelisk
system:
- bazel
- bazelisk
```
## Using `compile_commands.json` generated by CMake
Trunk supports using the `compile_commands.json` file generated by CMake. If you run `cmake` from a directory called `build` in the root of your project then Trunk will find the compile commands automatically. If you run it in some other directory then you will have to symlink the `compile_commands.json` in that directory to the root of your repo for trunk to find them. Note that Trunk does not currently support CMake out of tree builds.
## Another tool claims I have clang-tidy issues, but not Trunk. What gives?
Trunk runs `clang-tidy` with a compile commands database so that we can guarantee clang-tidy produces the correct diagnostics about your code. Other tools, such as `clangd`, may use best-effort heuristics to guess a compile command for a given clang-tidy input file (for example, see [this discussion)](https://github.com/clangd/clangd/issues/519) and consequently produce incorrect clang-tidy findings because they guessed the compile command wrong.
### Links
* [clang-tidy site](https://clang.llvm.org/extra/clang-tidy/)
* clang-tidy Trunk Code Quality [integration source](https://github.com/trunk-io/plugins/tree/main/linters/clang-tidy)
* Trunk Code Quality's [open source plugins repo](https://github.com/trunk-io/plugins/tree/main)
# Clippy
Source: https://docs.trunk.io/code-quality/overview/linters/supported/clippy
A collection of lints to catch common mistakes and improve your Rust code.
[**Clippy**](https://doc.rust-lang.org/clippy/) is a linter for Rust.
You can enable the Clippy linter with:
```shell theme={null}
trunk check enable clippy
```
## Auto Enabling
Clippy will be auto-enabled if any *Rust* files are present.
## Settings
Clippy supports the following config files:
* `clippy.toml`
* `.clippy.toml`
You can move these files to `.trunk/configs` and `trunk check` will still find them. See [Moving Linters](../configure-linters#moving-linters) for more info.
## Usage Notes
Clippy is distributed with rust itself, so specify your rust version for your clippy version (for example `clippy@1.61.0`).
## Links
* [Clippy site](https://doc.rust-lang.org/clippy/)
* Clippy Trunk Code Quality [integration source](https://github.com/trunk-io/plugins/tree/main/linters/clippy)
* Trunk Code Quality's [open source plugins repo](https://github.com/trunk-io/plugins/tree/main)
# cmake-format
Source: https://docs.trunk.io/code-quality/overview/linters/supported/cmake-format
Learn how to install, configure, and run CMake-Format with Trunk Check to ensure consistent formatting and best practices for your CMake scripts.
[**cmake-format**](https://github.com/cheshirekow/cmake_format) is a formatter for C, C++.
You can enable the cmake-format formatter with:
```shell theme={null}
trunk check enable cmake-format
```
## Auto Enabling
cmake-format will be auto-enabled if any of its config files are present: *`.cmake-format.json`, `.cmake-format.py`, `.cmake-format.yaml`*.
## Settings
cmake-format supports the following config files:
* `.cmake-format.json`
* `.cmake-format.py`
* `.cmake-format.yaml`
* `cmake-format.json`
* `cmake-format.py`
* `cmake-format.yaml`
You can move these files to `.trunk/configs` and `trunk check` will still find them. See [Moving Linters](../configure-linters#moving-linters) for more info.
## Links
* [cmake-format site](https://github.com/cheshirekow/cmake_format)
* cmake-format Trunk Code Quality [integration source](https://github.com/trunk-io/plugins/tree/main/linters/cmake-format)
* Trunk Code Quality's [open source plugins repo](https://github.com/trunk-io/plugins/tree/main)
# codespell
Source: https://docs.trunk.io/code-quality/overview/linters/supported/codespell
Codespell fixes common misspellings in text files. It's designed primarily to check misspelled words in source code.
[**codespell**](https://github.com/codespell-project/codespell#readme) is a linter for All.
You can enable the codespell linter with:
```shell theme={null}
trunk check enable codespell
```
## Auto Enabling
Checkov will be auto-enabled if any *Terraform, CloudFormation, Docker, Yaml or Json* files are present.
## Settings
Checkov supports the following config files:
* `.checkov.yml`
* `.checkov.yaml`
You can move these files to `.trunk/configs` and `trunk check` will still find them. See [Moving Linters](../configure-linters#moving-linters) for more info.
## Links
* [Checkov site](https://github.com/bridgecrewio/checkov)
* Checkov Trunk Code Quality [integration source](https://github.com/trunk-io/plugins/tree/main/linters/checkov)
* Trunk Code Quality's [open source plugins repo](https://github.com/trunk-io/plugins/tree/main)
# circleci
Source: https://docs.trunk.io/code-quality/overview/linters/supported/circleci
circleci is a linter for CircleCI Config
[**circleci**](https://github.com/CircleCI-Public/circleci-cli#readme) is a linter for CircleCI Config.
You can enable the circleci linter with:
```shell theme={null}
trunk check enable circleci
```
## Auto Enabling
circleci will never be auto-enabled. It must be enabled manually.
## Links
* [circleci site](https://github.com/CircleCI-Public/circleci-cli#readme)
* circleci Trunk Code Quality [integration source](https://github.com/trunk-io/plugins/tree/main/linters/circleci)
* Trunk Code Quality's [open source plugins repo](https://github.com/trunk-io/plugins/tree/main)
# ClangFormat
Source: https://docs.trunk.io/code-quality/overview/linters/supported/clang-format
Clang Format is a set of tools to format code that is processed by the Clang compiler suite.
[**ClangFormat**](https://clang.llvm.org/docs/ClangFormat.html) is a formatter for Protobuf and C, C++.
You can enable the ClangFormat formatter with:
```shell theme={null}
trunk check enable clang-format
```
## Auto Enabling
ClangFormat will be auto-enabled if a `.clang-format` config file is present.
## Settings
ClangFormat supports the following config files:
* `.clang-format`
You can move these files to `.trunk/configs` and `trunk check` will still find them. See [Moving Linters](../configure-linters#moving-linters) for more info.
## Usage Notes
By default, Trunk uses ClangFormat to additionally format `.proto` files. However, for this to work, you need to have told `clang-format` to do so in your `.clang-format` config file. You can do that by adding the following to the end of your `.clang-format file`:
```yaml theme={null}
---
Language: Proto
```
For example, you might have this for your entire `.clang-format` file:
```yaml theme={null}
BasedOnStyle: Google
ColumnLimit: 100
---
Language: Cpp
DerivePointerAlignment: false
---
Language: Proto
```
## Links
* [ClangFormat site](https://clang.llvm.org/docs/ClangFormat.html)
* ClangFormat Trunk Code Quality [integration source](https://github.com/trunk-io/plugins/tree/main/linters/clang-format)
* Trunk Code Quality's [open source plugins repo](https://github.com/trunk-io/plugins/tree/main)
# clang-tidy
Source: https://docs.trunk.io/code-quality/overview/linters/supported/clang-tidy
A clang-based C++ linter tool to provide an extensible framework for diagnosing and fixing programming errors that can be deduced via static analysis.
## clang-tidy
[**clang-tidy**](https://clang.llvm.org/extra/clang-tidy/) is a linter for Protobuf and C, C++.
You can enable the clang-tidy linter with:
```shell theme={null}
trunk check enable clang-tidy
```
### Auto Enabling
clang-tidy will be auto-enabled if a `.clang-tidy` config file is present.
### Settings
clang-tidy supports the following config files:
* `.clang-tidy`
You can move these files to `.trunk/configs` and `trunk check` will still find them. See [Moving Linters](../configure-linters#moving-linters) for more info. Trunk Code Quality provides a default `.clang-tidy` if your project does not already have one.
### Usage Notes
We only support using clang-tidy from Bazel and CMake projects.
In order to only see issues in your own code, not from library header files your code includes, add this to your `.clang-tidy` file:
```yaml theme={null}
HeaderFilterRegex: \./.+
```
You may have to build your project first if you depend on any generated header files.
## Linter Failures
If a file you're linting does not compile, clang-tidy may fail to process it. In `trunk`, this will show up as a *Linter Failure*. The output you'll see will look like a compilation error. This can also happen if the pre-reqs to running clang-tidy haven't been met (see below).
## Using Bazel
By default Trunk will query `bazel` for compile commands used to run `clang-tidy`. This requires no configuration.
Trunk will build needed compilation pre-requisites before invoking `clang-tidy` on each file (e.g. generated protobuf headers).
You can generate a local compilation database by running `trunk generate-compile-commands`.
**Finding the bazel binary**
Trunk will search for the `bazel` binary in two ways.
* Paths relative to the workspace root.
* Binaries in any of the directories in the PATH environment variable.
First trunk will search all workspace root relative paths and then all system directories. If you override anything in `lint.bazel.paths` then we only search the paths you specify. By default the configuration is as follows.
```yaml theme={null}
lint:
bazel:
paths:
workspace:
- tools/bazel
- bazelisk
system:
- bazel
- bazelisk
```
## Using `compile_commands.json` generated by CMake
Trunk supports using the `compile_commands.json` file generated by CMake. If you run `cmake` from a directory called `build` in the root of your project then Trunk will find the compile commands automatically. If you run it in some other directory then you will have to symlink the `compile_commands.json` in that directory to the root of your repo for trunk to find them. Note that Trunk does not currently support CMake out of tree builds.
## Another tool claims I have clang-tidy issues, but not Trunk. What gives?
Trunk runs `clang-tidy` with a compile commands database so that we can guarantee clang-tidy produces the correct diagnostics about your code. Other tools, such as `clangd`, may use best-effort heuristics to guess a compile command for a given clang-tidy input file (for example, see [this discussion)](https://github.com/clangd/clangd/issues/519) and consequently produce incorrect clang-tidy findings because they guessed the compile command wrong.
### Links
* [clang-tidy site](https://clang.llvm.org/extra/clang-tidy/)
* clang-tidy Trunk Code Quality [integration source](https://github.com/trunk-io/plugins/tree/main/linters/clang-tidy)
* Trunk Code Quality's [open source plugins repo](https://github.com/trunk-io/plugins/tree/main)
# Clippy
Source: https://docs.trunk.io/code-quality/overview/linters/supported/clippy
A collection of lints to catch common mistakes and improve your Rust code.
[**Clippy**](https://doc.rust-lang.org/clippy/) is a linter for Rust.
You can enable the Clippy linter with:
```shell theme={null}
trunk check enable clippy
```
## Auto Enabling
Clippy will be auto-enabled if any *Rust* files are present.
## Settings
Clippy supports the following config files:
* `clippy.toml`
* `.clippy.toml`
You can move these files to `.trunk/configs` and `trunk check` will still find them. See [Moving Linters](../configure-linters#moving-linters) for more info.
## Usage Notes
Clippy is distributed with rust itself, so specify your rust version for your clippy version (for example `clippy@1.61.0`).
## Links
* [Clippy site](https://doc.rust-lang.org/clippy/)
* Clippy Trunk Code Quality [integration source](https://github.com/trunk-io/plugins/tree/main/linters/clippy)
* Trunk Code Quality's [open source plugins repo](https://github.com/trunk-io/plugins/tree/main)
# cmake-format
Source: https://docs.trunk.io/code-quality/overview/linters/supported/cmake-format
Learn how to install, configure, and run CMake-Format with Trunk Check to ensure consistent formatting and best practices for your CMake scripts.
[**cmake-format**](https://github.com/cheshirekow/cmake_format) is a formatter for C, C++.
You can enable the cmake-format formatter with:
```shell theme={null}
trunk check enable cmake-format
```
## Auto Enabling
cmake-format will be auto-enabled if any of its config files are present: *`.cmake-format.json`, `.cmake-format.py`, `.cmake-format.yaml`*.
## Settings
cmake-format supports the following config files:
* `.cmake-format.json`
* `.cmake-format.py`
* `.cmake-format.yaml`
* `cmake-format.json`
* `cmake-format.py`
* `cmake-format.yaml`
You can move these files to `.trunk/configs` and `trunk check` will still find them. See [Moving Linters](../configure-linters#moving-linters) for more info.
## Links
* [cmake-format site](https://github.com/cheshirekow/cmake_format)
* cmake-format Trunk Code Quality [integration source](https://github.com/trunk-io/plugins/tree/main/linters/cmake-format)
* Trunk Code Quality's [open source plugins repo](https://github.com/trunk-io/plugins/tree/main)
# codespell
Source: https://docs.trunk.io/code-quality/overview/linters/supported/codespell
Codespell fixes common misspellings in text files. It's designed primarily to check misspelled words in source code.
[**codespell**](https://github.com/codespell-project/codespell#readme) is a linter for All.
You can enable the codespell linter with:
```shell theme={null}
trunk check enable codespell
```
![codespell example output]() ## Auto Enabling
codespell will be auto-enabled if a `.codespellrc` config file is present.
## Settings
codespell supports the following config files:
* `.codespellrc`
You can move these files to `.trunk/configs` and `trunk check` will still find them. See [Moving Linters](../configure-linters#moving-linters) for more info.
## Links
* [codespell site](https://github.com/codespell-project/codespell#readme)
* codespell Trunk Code Quality [integration source](https://github.com/trunk-io/plugins/tree/main/linters/codespell)
* Trunk Code Quality's [open source plugins repo](https://github.com/trunk-io/plugins/tree/main)
# cspell
Source: https://docs.trunk.io/code-quality/overview/linters/supported/cspell
CSpell is a linter for identifying and fixing spelling errors in source code, documentation, and configuration files, enhancing overall project quality.
[**cspell**](https://github.com/streetsidesoftware/cspell#readme) is a linter for All.
You can enable the cspell linter with:
```shell theme={null}
trunk check enable cspell
```
## Auto Enabling
codespell will be auto-enabled if a `.codespellrc` config file is present.
## Settings
codespell supports the following config files:
* `.codespellrc`
You can move these files to `.trunk/configs` and `trunk check` will still find them. See [Moving Linters](../configure-linters#moving-linters) for more info.
## Links
* [codespell site](https://github.com/codespell-project/codespell#readme)
* codespell Trunk Code Quality [integration source](https://github.com/trunk-io/plugins/tree/main/linters/codespell)
* Trunk Code Quality's [open source plugins repo](https://github.com/trunk-io/plugins/tree/main)
# cspell
Source: https://docs.trunk.io/code-quality/overview/linters/supported/cspell
CSpell is a linter for identifying and fixing spelling errors in source code, documentation, and configuration files, enhancing overall project quality.
[**cspell**](https://github.com/streetsidesoftware/cspell#readme) is a linter for All.
You can enable the cspell linter with:
```shell theme={null}
trunk check enable cspell
```
![cspell example output]() ## Auto Enabling
cspell will never be auto-enabled. It must be enabled manually.
## Settings
cspell supports the following config files:
* `.cspell.json`
* `cspell.json`
* `.cSpell.json`
* `cSpell.json`
* `cspell.config.js`
* `cspell.config.cjs`
* `cspell.config.json`
* `cspell.config.yaml`
* `cspell.config.yml`
* `cspell.yaml`
* `cspell.yml`
You can move these files to `.trunk/configs` and `trunk check` will still find them. See [Moving Linters](../configure-linters#moving-linters) for more info. Trunk Code Quality provides a default `cspell.yaml` if your project does not already have one.
## Links
* [cspell site](https://github.com/streetsidesoftware/cspell#readme)
* cspell Trunk Code Quality [integration source](https://github.com/trunk-io/plugins/tree/main/linters/cspell)
* Trunk Code Quality's [open source plugins repo](https://github.com/trunk-io/plugins/tree/main)
# cue-fmt
Source: https://docs.trunk.io/code-quality/overview/linters/supported/cue-fmt
cue-fmt is a formatter for CUE files that improves consistency and readability. Learn how to install, configure, and run cue-fmt.
[**cue-fmt**](https://cuelang.org) is a formatter for Cue.
You can enable the cue-fmt formatter with:
```shell theme={null}
trunk check enable cue-fmt
```
## Auto Enabling
cue-fmt will be auto-enabled if any *Cue* files are present.
## Links
* [cue-fmt site](https://cuelang.org)
* cue-fmt Trunk Code Quality [integration source](https://github.com/trunk-io/plugins/tree/main/linters/cue-fmt)
* Trunk Code Quality's [open source plugins repo](https://github.com/trunk-io/plugins/tree/main)
# dart
Source: https://docs.trunk.io/code-quality/overview/linters/supported/dart
dart is a linter for Dart
[**dart**](https://dart.dev/tools/dart-format) is a linter for Dart.
You can enable the dart linter with:
```shell theme={null}
trunk check enable dart
```
## Auto Enabling
dart will never be auto-enabled. It must be enabled manually.
## Links
* [dart site](https://dart.dev/tools/dart-format)
* dart Trunk Code Quality [integration source](https://github.com/trunk-io/plugins/tree/main/linters/dart)
* Trunk Code Quality's [open source plugins repo](https://github.com/trunk-io/plugins/tree/main)
# deno
Source: https://docs.trunk.io/code-quality/overview/linters/supported/deno
deno is a linter for JavaScript, JSON, TypeScript and Markdown
[**deno**](https://deno.land/manual) is a linter for JavaScript, JSON, TypeScript and Markdown.
You can enable the deno linter with:
```shell theme={null}
trunk check enable deno
```
## Auto Enabling
deno will be auto-enabled if any of its config files are present: *`deno.json`, `deno.jsonc`*.
## Settings
deno supports the following config files:
* `deno.json`
* `deno.jsonc`
You can move these files to `.trunk/configs` and `trunk check` will still find them. See [Moving Linters](../configure-linters#moving-linters) for more info.
## Links
* [deno site](https://deno.land/manual)
* deno Trunk Code Quality [integration source](https://github.com/trunk-io/plugins/tree/main/linters/deno)
* Trunk Code Quality's [open source plugins repo](https://github.com/trunk-io/plugins/tree/main)
# Detekt
Source: https://docs.trunk.io/code-quality/overview/linters/supported/detekt
Static code analysis for Kotlin
[**Detekt**](https://github.com/detekt/detekt) is a linter for Kotlin.
detekt is composed of several linter commands.
`detekt` runs detekt with the built-in default config and any overrides in `.detekt.yaml`.
You can enable the `detekt` linter with:
```shell theme={null}
trunk check enable detekt
```
`detekt-explicit` disables the default config and uses `.detekt.yaml` as the source of truth.
You can enable the `detekt-explicit` linter with:
```shell theme={null}
trunk check enable detekt-explicit
```
`detekt-gradle` runs detekt using Gradle. Only use if you already are using Gradle for the rest of your build setup.
You can enable the `detekt-gradle` linter with:
```shell theme={null}
trunk check enable detekt-gradle
```
## Auto Enabling
Detekt will never be auto-enabled. It must be enabled manually.
## Settings
Detekt supports the following config files:
* `.detekt.yaml`
You can move these files to `.trunk/configs` and `trunk check` will still find them. See [Moving Linters](../configure-linters#moving-linters) for more info.
## Usage Notes
Detekt is usually invoked through gradle, which allows specifying additional configuration in `build.gradle`. We do not yet automatically parse your Gradle scripts to infer your `detekt` configuration; instead, what we do is this:
* `detekt` invokes [`detekt-cli`](https://detekt.github.io/detekt/cli.html) with the `--build-upon-default-config` flag (this appears to be [more common](https://cs.github.com/?q=%2FbuildUponDefaultConfig.*%28true%29%2F+detekt) than the alternative).
* `detekt-explicit` invokes [`detekt-cli`](https://detekt.github.io/detekt/cli.html) without the `--build-upon-default-config` flag.
You will also need to provide a valid detekt config as `.detekt.yaml` (an empty `.detekt.yaml` is valid, if you don't want to configure `detekt`). If you already have a detekt config, then you can symlink it like so:
```bash theme={null}
ln -s path/to/existing/detekt-config.yml .detekt-config.yaml
```
To use `./gradlew detekt` to invoke Detekt, you can add `detekt-gradle@SYSTEM` to your `enabled` list. Note that since you're running Detekt via Gradle, you should also add the paths to your Detekt configurations to `direct_configs`, e.g.
```undefined theme={null}
direct_configs: ["lib/detekt.yaml"]
```
## Links
* [Detekt site](https://github.com/detekt/detekt)
* Detekt Trunk Code Quality [integration source](https://github.com/trunk-io/plugins/tree/main/linters/detekt)
* Trunk Code Quality's [open source plugins repo](https://github.com/trunk-io/plugins/tree/main)
# djlint
Source: https://docs.trunk.io/code-quality/overview/linters/supported/djlint
djlint is a linter for HTML Templates
[**djlint**](https://github.com/Riverside-Healthcare/djlint#readme) is a linter for HTML Templates.
You can enable the djlint linter with:
```shell theme={null}
trunk check enable djlint
```
## Auto Enabling
djlint will be auto-enabled if a `.djlintrc` config file is present.
## Settings
djlint supports the following config files:
* `.djlintrc`
You can move these files to `.trunk/configs` and `trunk check` will still find them. See [Moving Linters](../configure-linters#moving-linters) for more info. Trunk Code Quality provides a default `.djlintrc` if your project does not already have one.
## Links
* [djlint site](https://github.com/Riverside-Healthcare/djlint#readme)
* djlint Trunk Code Quality [integration source](https://github.com/trunk-io/plugins/tree/main/linters/djlint)
* Trunk Code Quality's [open source plugins repo](https://github.com/trunk-io/plugins/tree/main)
# dotenv-linter
Source: https://docs.trunk.io/code-quality/overview/linters/supported/dotenv-linter
dotenv-linter is a linter for Dotenv
[**dotenv-linter**](https://github.com/dotenv-linter/dotenv-linter#readme) is a linter for Dotenv.
You can enable the dotenv-linter linter with:
```shell theme={null}
trunk check enable dotenv-linter
```
## Auto Enabling
dotenv-linter will be auto-enabled if any *Dotenv* files are present.
## Links
* [dotenv-linter site](https://github.com/dotenv-linter/dotenv-linter#readme)
* dotenv-linter Trunk Code Quality [integration source](https://github.com/trunk-io/plugins/tree/main/linters/dotenv-linter)
* Trunk Code Quality's [open source plugins repo](https://github.com/trunk-io/plugins/tree/main)
# dotnet-format
Source: https://docs.trunk.io/code-quality/overview/linters/supported/dotnet-format
dotnet-format is a linter for C#
[**dotnet-format**](https://github.com/dotnet/format#readme) is a linter for C#.
You can enable the dotnet-format linter with:
```shell theme={null}
trunk check enable dotnet-format
```
## Auto Enabling
dotnet-format will never be auto-enabled. It must be enabled manually.
## Links
* [dotnet-format site](https://github.com/dotnet/format#readme)
* dotnet-format Trunk Code Quality [integration source](https://github.com/trunk-io/plugins/tree/main/linters/dotnet-format)
* Trunk Code Quality's [open source plugins repo](https://github.com/trunk-io/plugins/tree/main)
# dustilock
Source: https://docs.trunk.io/code-quality/overview/linters/supported/dustilock
dustilock is a linter for Security
[**dustilock**](https://github.com/Checkmarx/dustilock) is a linter for Security.
You can enable the dustilock linter with:
```shell theme={null}
trunk check enable dustilock
```
## Auto Enabling
dustilock will never be auto-enabled. It must be enabled manually.
## Links
* [dustilock site](https://github.com/Checkmarx/dustilock)
* dustilock Trunk Code Quality [integration source](https://github.com/trunk-io/plugins/tree/main/linters/dustilock)
* Trunk Code Quality's [open source plugins repo](https://github.com/trunk-io/plugins/tree/main)
# ESLint
Source: https://docs.trunk.io/code-quality/overview/linters/supported/eslint
ESLint statically analyzes your code to quickly find problems.
## ESLint
[**ESLint**](https://eslint.org/) is a linter for JavaScript, JSON and TypeScript.
You can enable the ESLint linter with:
```shell theme={null}
trunk check enable eslint
```
### Auto Enabling
ESLint will be auto-enabled if any of its config files are present: *`eslint.config.js`, `eslint.config.mjs`, `eslint.config.cjs`*.
### Settings
ESLint supports the following config files:
* `eslint.config.js`
* `eslint.config.mjs`
* `eslint.config.cjs`
* `.eslintrc`
* `.eslintrc.cjs`
* `.eslintrc.js`
* `.eslintrc.json`
* `.eslintrc.mjs`
* `.eslintrc.yaml`
* `.eslintrc.yml`
Unlike with most tools under `trunk check`, these files cannot be moved.
### Usage Notes
## ESLint >= 9.x
As of ESLint v9, all of the formatters have been removed. We suggest using [prettier](/code-quality/overview/linters/supported/prettier) to format Javascript and Typescript code. The extra package mentioned below is no longer needed for ESLint v9 and higher.
## ESlint \< 8.x
Most ESLint users use several plugins, custom parsers, etc. Trunk has turned off sandboxing and caching for ESLint so it can use your repo's installed packages for ESLint plugins, and other required ESLint packages. Trunk controls the ESLint version, but otherwise, ESLint looks for all plugins, configs, etc. based on the path of the source file it is linting. **This all means you do need to have npm/yarn installed in your repo as a prerequisite before running ESLint via trunk**.
We recommend you disable all Prettier rules in your ESLint config and let Trunk run Prettier automatically on your files. It's much nicer to just autoformat a file than to see a lint error for every missing space.
You can easily do this by:
* adding the `eslint-config-prettier` package
* adding `prettier` as the last element to the `extends` property in your ESLint config
For example, your `extends` list might look like:
```yaml theme={null}
extends:
# Order matters, later configs purposefully override settings from earlier configs
- eslint:recommended
- airbnb
- plugin:@typescript-eslint/recommended
- plugin:import/recommended
- plugin:import/typescript
- plugin:node/recommended
- plugin:mocha/recommended
- plugin:react/recommended
- prettier # this actually turns OFF all Prettier rules running via ESLint
```
### Links
* [ESLint site](https://eslint.org/)
* ESLint Trunk Code Quality [integration source](https://github.com/trunk-io/plugins/tree/main/linters/eslint)
* Trunk Code Quality's [open source plugins repo](https://github.com/trunk-io/plugins/tree/main)
# Flake8
Source: https://docs.trunk.io/code-quality/overview/linters/supported/flake8
Uncover Flake8, a versatile Python linter for code style and error checking. Flake 8 checks against PEP 8 and more, with plugin support for broader analysis.
[**Flake8**](https://flake8.pycqa.org/en/latest/) is a linter for Python.
You can enable the Flake8 linter with:
```shell theme={null}
trunk check enable flake8
```
## Auto Enabling
cspell will never be auto-enabled. It must be enabled manually.
## Settings
cspell supports the following config files:
* `.cspell.json`
* `cspell.json`
* `.cSpell.json`
* `cSpell.json`
* `cspell.config.js`
* `cspell.config.cjs`
* `cspell.config.json`
* `cspell.config.yaml`
* `cspell.config.yml`
* `cspell.yaml`
* `cspell.yml`
You can move these files to `.trunk/configs` and `trunk check` will still find them. See [Moving Linters](../configure-linters#moving-linters) for more info. Trunk Code Quality provides a default `cspell.yaml` if your project does not already have one.
## Links
* [cspell site](https://github.com/streetsidesoftware/cspell#readme)
* cspell Trunk Code Quality [integration source](https://github.com/trunk-io/plugins/tree/main/linters/cspell)
* Trunk Code Quality's [open source plugins repo](https://github.com/trunk-io/plugins/tree/main)
# cue-fmt
Source: https://docs.trunk.io/code-quality/overview/linters/supported/cue-fmt
cue-fmt is a formatter for CUE files that improves consistency and readability. Learn how to install, configure, and run cue-fmt.
[**cue-fmt**](https://cuelang.org) is a formatter for Cue.
You can enable the cue-fmt formatter with:
```shell theme={null}
trunk check enable cue-fmt
```
## Auto Enabling
cue-fmt will be auto-enabled if any *Cue* files are present.
## Links
* [cue-fmt site](https://cuelang.org)
* cue-fmt Trunk Code Quality [integration source](https://github.com/trunk-io/plugins/tree/main/linters/cue-fmt)
* Trunk Code Quality's [open source plugins repo](https://github.com/trunk-io/plugins/tree/main)
# dart
Source: https://docs.trunk.io/code-quality/overview/linters/supported/dart
dart is a linter for Dart
[**dart**](https://dart.dev/tools/dart-format) is a linter for Dart.
You can enable the dart linter with:
```shell theme={null}
trunk check enable dart
```
## Auto Enabling
dart will never be auto-enabled. It must be enabled manually.
## Links
* [dart site](https://dart.dev/tools/dart-format)
* dart Trunk Code Quality [integration source](https://github.com/trunk-io/plugins/tree/main/linters/dart)
* Trunk Code Quality's [open source plugins repo](https://github.com/trunk-io/plugins/tree/main)
# deno
Source: https://docs.trunk.io/code-quality/overview/linters/supported/deno
deno is a linter for JavaScript, JSON, TypeScript and Markdown
[**deno**](https://deno.land/manual) is a linter for JavaScript, JSON, TypeScript and Markdown.
You can enable the deno linter with:
```shell theme={null}
trunk check enable deno
```
## Auto Enabling
deno will be auto-enabled if any of its config files are present: *`deno.json`, `deno.jsonc`*.
## Settings
deno supports the following config files:
* `deno.json`
* `deno.jsonc`
You can move these files to `.trunk/configs` and `trunk check` will still find them. See [Moving Linters](../configure-linters#moving-linters) for more info.
## Links
* [deno site](https://deno.land/manual)
* deno Trunk Code Quality [integration source](https://github.com/trunk-io/plugins/tree/main/linters/deno)
* Trunk Code Quality's [open source plugins repo](https://github.com/trunk-io/plugins/tree/main)
# Detekt
Source: https://docs.trunk.io/code-quality/overview/linters/supported/detekt
Static code analysis for Kotlin
[**Detekt**](https://github.com/detekt/detekt) is a linter for Kotlin.
detekt is composed of several linter commands.
`detekt` runs detekt with the built-in default config and any overrides in `.detekt.yaml`.
You can enable the `detekt` linter with:
```shell theme={null}
trunk check enable detekt
```
`detekt-explicit` disables the default config and uses `.detekt.yaml` as the source of truth.
You can enable the `detekt-explicit` linter with:
```shell theme={null}
trunk check enable detekt-explicit
```
`detekt-gradle` runs detekt using Gradle. Only use if you already are using Gradle for the rest of your build setup.
You can enable the `detekt-gradle` linter with:
```shell theme={null}
trunk check enable detekt-gradle
```
## Auto Enabling
Detekt will never be auto-enabled. It must be enabled manually.
## Settings
Detekt supports the following config files:
* `.detekt.yaml`
You can move these files to `.trunk/configs` and `trunk check` will still find them. See [Moving Linters](../configure-linters#moving-linters) for more info.
## Usage Notes
Detekt is usually invoked through gradle, which allows specifying additional configuration in `build.gradle`. We do not yet automatically parse your Gradle scripts to infer your `detekt` configuration; instead, what we do is this:
* `detekt` invokes [`detekt-cli`](https://detekt.github.io/detekt/cli.html) with the `--build-upon-default-config` flag (this appears to be [more common](https://cs.github.com/?q=%2FbuildUponDefaultConfig.*%28true%29%2F+detekt) than the alternative).
* `detekt-explicit` invokes [`detekt-cli`](https://detekt.github.io/detekt/cli.html) without the `--build-upon-default-config` flag.
You will also need to provide a valid detekt config as `.detekt.yaml` (an empty `.detekt.yaml` is valid, if you don't want to configure `detekt`). If you already have a detekt config, then you can symlink it like so:
```bash theme={null}
ln -s path/to/existing/detekt-config.yml .detekt-config.yaml
```
To use `./gradlew detekt` to invoke Detekt, you can add `detekt-gradle@SYSTEM` to your `enabled` list. Note that since you're running Detekt via Gradle, you should also add the paths to your Detekt configurations to `direct_configs`, e.g.
```undefined theme={null}
direct_configs: ["lib/detekt.yaml"]
```
## Links
* [Detekt site](https://github.com/detekt/detekt)
* Detekt Trunk Code Quality [integration source](https://github.com/trunk-io/plugins/tree/main/linters/detekt)
* Trunk Code Quality's [open source plugins repo](https://github.com/trunk-io/plugins/tree/main)
# djlint
Source: https://docs.trunk.io/code-quality/overview/linters/supported/djlint
djlint is a linter for HTML Templates
[**djlint**](https://github.com/Riverside-Healthcare/djlint#readme) is a linter for HTML Templates.
You can enable the djlint linter with:
```shell theme={null}
trunk check enable djlint
```
## Auto Enabling
djlint will be auto-enabled if a `.djlintrc` config file is present.
## Settings
djlint supports the following config files:
* `.djlintrc`
You can move these files to `.trunk/configs` and `trunk check` will still find them. See [Moving Linters](../configure-linters#moving-linters) for more info. Trunk Code Quality provides a default `.djlintrc` if your project does not already have one.
## Links
* [djlint site](https://github.com/Riverside-Healthcare/djlint#readme)
* djlint Trunk Code Quality [integration source](https://github.com/trunk-io/plugins/tree/main/linters/djlint)
* Trunk Code Quality's [open source plugins repo](https://github.com/trunk-io/plugins/tree/main)
# dotenv-linter
Source: https://docs.trunk.io/code-quality/overview/linters/supported/dotenv-linter
dotenv-linter is a linter for Dotenv
[**dotenv-linter**](https://github.com/dotenv-linter/dotenv-linter#readme) is a linter for Dotenv.
You can enable the dotenv-linter linter with:
```shell theme={null}
trunk check enable dotenv-linter
```
## Auto Enabling
dotenv-linter will be auto-enabled if any *Dotenv* files are present.
## Links
* [dotenv-linter site](https://github.com/dotenv-linter/dotenv-linter#readme)
* dotenv-linter Trunk Code Quality [integration source](https://github.com/trunk-io/plugins/tree/main/linters/dotenv-linter)
* Trunk Code Quality's [open source plugins repo](https://github.com/trunk-io/plugins/tree/main)
# dotnet-format
Source: https://docs.trunk.io/code-quality/overview/linters/supported/dotnet-format
dotnet-format is a linter for C#
[**dotnet-format**](https://github.com/dotnet/format#readme) is a linter for C#.
You can enable the dotnet-format linter with:
```shell theme={null}
trunk check enable dotnet-format
```
## Auto Enabling
dotnet-format will never be auto-enabled. It must be enabled manually.
## Links
* [dotnet-format site](https://github.com/dotnet/format#readme)
* dotnet-format Trunk Code Quality [integration source](https://github.com/trunk-io/plugins/tree/main/linters/dotnet-format)
* Trunk Code Quality's [open source plugins repo](https://github.com/trunk-io/plugins/tree/main)
# dustilock
Source: https://docs.trunk.io/code-quality/overview/linters/supported/dustilock
dustilock is a linter for Security
[**dustilock**](https://github.com/Checkmarx/dustilock) is a linter for Security.
You can enable the dustilock linter with:
```shell theme={null}
trunk check enable dustilock
```
## Auto Enabling
dustilock will never be auto-enabled. It must be enabled manually.
## Links
* [dustilock site](https://github.com/Checkmarx/dustilock)
* dustilock Trunk Code Quality [integration source](https://github.com/trunk-io/plugins/tree/main/linters/dustilock)
* Trunk Code Quality's [open source plugins repo](https://github.com/trunk-io/plugins/tree/main)
# ESLint
Source: https://docs.trunk.io/code-quality/overview/linters/supported/eslint
ESLint statically analyzes your code to quickly find problems.
## ESLint
[**ESLint**](https://eslint.org/) is a linter for JavaScript, JSON and TypeScript.
You can enable the ESLint linter with:
```shell theme={null}
trunk check enable eslint
```
### Auto Enabling
ESLint will be auto-enabled if any of its config files are present: *`eslint.config.js`, `eslint.config.mjs`, `eslint.config.cjs`*.
### Settings
ESLint supports the following config files:
* `eslint.config.js`
* `eslint.config.mjs`
* `eslint.config.cjs`
* `.eslintrc`
* `.eslintrc.cjs`
* `.eslintrc.js`
* `.eslintrc.json`
* `.eslintrc.mjs`
* `.eslintrc.yaml`
* `.eslintrc.yml`
Unlike with most tools under `trunk check`, these files cannot be moved.
### Usage Notes
## ESLint >= 9.x
As of ESLint v9, all of the formatters have been removed. We suggest using [prettier](/code-quality/overview/linters/supported/prettier) to format Javascript and Typescript code. The extra package mentioned below is no longer needed for ESLint v9 and higher.
## ESlint \< 8.x
Most ESLint users use several plugins, custom parsers, etc. Trunk has turned off sandboxing and caching for ESLint so it can use your repo's installed packages for ESLint plugins, and other required ESLint packages. Trunk controls the ESLint version, but otherwise, ESLint looks for all plugins, configs, etc. based on the path of the source file it is linting. **This all means you do need to have npm/yarn installed in your repo as a prerequisite before running ESLint via trunk**.
We recommend you disable all Prettier rules in your ESLint config and let Trunk run Prettier automatically on your files. It's much nicer to just autoformat a file than to see a lint error for every missing space.
You can easily do this by:
* adding the `eslint-config-prettier` package
* adding `prettier` as the last element to the `extends` property in your ESLint config
For example, your `extends` list might look like:
```yaml theme={null}
extends:
# Order matters, later configs purposefully override settings from earlier configs
- eslint:recommended
- airbnb
- plugin:@typescript-eslint/recommended
- plugin:import/recommended
- plugin:import/typescript
- plugin:node/recommended
- plugin:mocha/recommended
- plugin:react/recommended
- prettier # this actually turns OFF all Prettier rules running via ESLint
```
### Links
* [ESLint site](https://eslint.org/)
* ESLint Trunk Code Quality [integration source](https://github.com/trunk-io/plugins/tree/main/linters/eslint)
* Trunk Code Quality's [open source plugins repo](https://github.com/trunk-io/plugins/tree/main)
# Flake8
Source: https://docs.trunk.io/code-quality/overview/linters/supported/flake8
Uncover Flake8, a versatile Python linter for code style and error checking. Flake 8 checks against PEP 8 and more, with plugin support for broader analysis.
[**Flake8**](https://flake8.pycqa.org/en/latest/) is a linter for Python.
You can enable the Flake8 linter with:
```shell theme={null}
trunk check enable flake8
```
![flake8 example output]() ## Auto Enabling
Flake8 will be auto-enabled if a `.flake8` config file is present.
## Settings
Flake8 supports the following config files:
* `.flake8`
You can move these files to `.trunk/configs` and `trunk check` will still find them. See [Moving Linters](../configure-linters#moving-linters) for more info. Trunk Code Quality provides a default `.flake8` if your project does not already have one.
## Usage Notes
Flake8 has a plugin architecture where if you install a plugin, it gets used. You can enable Flake8 plugins via:
```yaml theme={null}
enabled:
- flake8@3.9.2:
packages:
- flake8-bugbear@21.4.3
```
`flake8-bugbear` is probably the most popular **flake8** plugin, we recommend it!. Here are a few other popular flake8 plugins you should consider.
* **flake8-comprehensions**: Helps in identifying unnecessary comprehensions in your code.
* **flake8-docstrings**: Checks for compliance with Python docstring conventions.
* **flake8-import-order**: Checks the order of your imports according to various configurable ordering styles.
Here's an updated code snippet with the above Plugins enabled:
```undefined theme={null}
enabled:
- flake8@3.9.2:
packages:
- flake8-bugbear@21.4.3
- flake8-docstrings@1.7.0
- flake8-import-order@0.18.2
- flake8-comprehensions@3.14.0
```
## Links
* [Flake8 site](https://flake8.pycqa.org/en/latest/)
* Flake8 Trunk Code Quality [integration source](https://github.com/trunk-io/plugins/tree/main/linters/flake8)
* Trunk Code Quality's [open source plugins repo](https://github.com/trunk-io/plugins/tree/main)
# git-diff-check
Source: https://docs.trunk.io/code-quality/overview/linters/supported/git-diff-check
git-diff-check is a linter for All
[**git-diff-check**](https://git-scm.com/docs/git-diff) is a linter for All.
You can enable the git-diff-check linter with:
```shell theme={null}
trunk check enable git-diff-check
```
## Auto Enabling
git-diff-check will be auto-enabled if any *all* files are present.
## Links
* [git-diff-check site](https://git-scm.com/docs/git-diff)
* git-diff-check Trunk Code Quality [integration source](https://github.com/trunk-io/plugins/tree/main/linters/git-diff-check)
* Trunk Code Quality's [open source plugins repo](https://github.com/trunk-io/plugins/tree/main)
# Gitleaks
Source: https://docs.trunk.io/code-quality/overview/linters/supported/gitleaks
Explore Gitleaks, an open-source tool for identifying secrets in codebases. Learn about its file type support and integration with Trunk.
[**Gitleaks**](https://gitleaks.io/) is a linter for All.
You can enable the Gitleaks linter with:
```shell theme={null}
trunk check enable gitleaks
```
## Auto Enabling
Flake8 will be auto-enabled if a `.flake8` config file is present.
## Settings
Flake8 supports the following config files:
* `.flake8`
You can move these files to `.trunk/configs` and `trunk check` will still find them. See [Moving Linters](../configure-linters#moving-linters) for more info. Trunk Code Quality provides a default `.flake8` if your project does not already have one.
## Usage Notes
Flake8 has a plugin architecture where if you install a plugin, it gets used. You can enable Flake8 plugins via:
```yaml theme={null}
enabled:
- flake8@3.9.2:
packages:
- flake8-bugbear@21.4.3
```
`flake8-bugbear` is probably the most popular **flake8** plugin, we recommend it!. Here are a few other popular flake8 plugins you should consider.
* **flake8-comprehensions**: Helps in identifying unnecessary comprehensions in your code.
* **flake8-docstrings**: Checks for compliance with Python docstring conventions.
* **flake8-import-order**: Checks the order of your imports according to various configurable ordering styles.
Here's an updated code snippet with the above Plugins enabled:
```undefined theme={null}
enabled:
- flake8@3.9.2:
packages:
- flake8-bugbear@21.4.3
- flake8-docstrings@1.7.0
- flake8-import-order@0.18.2
- flake8-comprehensions@3.14.0
```
## Links
* [Flake8 site](https://flake8.pycqa.org/en/latest/)
* Flake8 Trunk Code Quality [integration source](https://github.com/trunk-io/plugins/tree/main/linters/flake8)
* Trunk Code Quality's [open source plugins repo](https://github.com/trunk-io/plugins/tree/main)
# git-diff-check
Source: https://docs.trunk.io/code-quality/overview/linters/supported/git-diff-check
git-diff-check is a linter for All
[**git-diff-check**](https://git-scm.com/docs/git-diff) is a linter for All.
You can enable the git-diff-check linter with:
```shell theme={null}
trunk check enable git-diff-check
```
## Auto Enabling
git-diff-check will be auto-enabled if any *all* files are present.
## Links
* [git-diff-check site](https://git-scm.com/docs/git-diff)
* git-diff-check Trunk Code Quality [integration source](https://github.com/trunk-io/plugins/tree/main/linters/git-diff-check)
* Trunk Code Quality's [open source plugins repo](https://github.com/trunk-io/plugins/tree/main)
# Gitleaks
Source: https://docs.trunk.io/code-quality/overview/linters/supported/gitleaks
Explore Gitleaks, an open-source tool for identifying secrets in codebases. Learn about its file type support and integration with Trunk.
[**Gitleaks**](https://gitleaks.io/) is a linter for All.
You can enable the Gitleaks linter with:
```shell theme={null}
trunk check enable gitleaks
```
![gitleaks example output]() ## Auto Enabling
Gitleaks will be auto-enabled if any of its config files are present: *`.gitleaks.config`, `.gitleaks.toml`, `.gitleaksignore`*.
## Settings
Gitleaks supports the following config files:
* `.gitleaks.config`
* `.gitleaks.toml`
* `.gitleaksignore`
You can move these files to `.trunk/configs` and `trunk check` will still find them. See [Moving Linters](../configure-linters#moving-linters) for more info.
## Usage Notes
Gitleaks v7 only works with Go 1.16, not Go 1.18 while Gitleaks v8 works with 1.18. We recommend using v8, but if you specifically need to use v7 you can override the go runtime version like so:
```yaml theme={null}
runtimes:
enabled:
- go@1.16.7
```
Again, this is not recommended. Just use Gitleaks v8 or later with go 1.18 or later.
## Links
* [Gitleaks site](https://gitleaks.io/)
* Gitleaks Trunk Code Quality [integration source](https://github.com/trunk-io/plugins/tree/main/linters/gitleaks)
* Trunk Code Quality's [open source plugins repo](https://github.com/trunk-io/plugins/tree/main)
# Gofmt
Source: https://docs.trunk.io/code-quality/overview/linters/supported/gofmt
Gofmt simplifies Go coding by automatically formatting code to match Go's style guidelines, enhancing readability and teamwork without the manual hassle.
[**Gofmt**](https://github.com/rhysd/actionlint) is a formatter for Go.
You can enable the Gofmt formatter with:
```shell theme={null}
trunk check enable gofmt
```
## Auto Enabling
Gofmt will be auto-enabled if any *Go* files are present.
## Links
* [Gofmt site](https://github.com/rhysd/actionlint)
* Gofmt Trunk Code Quality [integration source](https://github.com/trunk-io/plugins/tree/main/linters/gofmt)
* Trunk Code Quality's [open source plugins repo](https://github.com/trunk-io/plugins/tree/main)
# gofumpt
Source: https://docs.trunk.io/code-quality/overview/linters/supported/gofumpt
gofumpt is a linter for Go
[**gofumpt**](https://pkg.go.dev/mvdan.cc/gofumpt) is a linter for Go.
You can enable the gofumpt linter with:
```shell theme={null}
trunk check enable gofumpt
```
## Auto Enabling
gofumpt will never be auto-enabled. It must be enabled manually.
## Links
* [gofumpt site](https://pkg.go.dev/mvdan.cc/gofumpt)
* gofumpt Trunk Code Quality [integration source](https://github.com/trunk-io/plugins/tree/main/linters/gofumpt)
* Trunk Code Quality's [open source plugins repo](https://github.com/trunk-io/plugins/tree/main)
# goimports
Source: https://docs.trunk.io/code-quality/overview/linters/supported/goimports
goimports is a linter for Go
[**goimports**](https://pkg.go.dev/golang.org/x/tools/cmd/goimports) is a linter for Go.
You can enable the goimports linter with:
```shell theme={null}
trunk check enable goimports
```
## Auto Enabling
goimports will never be auto-enabled. It must be enabled manually.
## Links
* [goimports site](https://pkg.go.dev/golang.org/x/tools/cmd/goimports)
* goimports Trunk Code Quality [integration source](https://github.com/trunk-io/plugins/tree/main/linters/goimports)
* Trunk Code Quality's [open source plugins repo](https://github.com/trunk-io/plugins/tree/main)
# gokart
Source: https://docs.trunk.io/code-quality/overview/linters/supported/gokart
gokart is a linter for Go
[**gokart**](https://github.com/praetorian-inc/gokart) is a linter for Go.
You can enable the gokart linter with:
```shell theme={null}
trunk check enable gokart
```
## Auto Enabling
gokart will be auto-enabled if a `analyzers.yml` config file is present.
## Settings
gokart supports the following config files:
* `analyzers.yml`
You can move these files to `.trunk/configs` and `trunk check` will still find them. See [Moving Linters](../configure-linters#moving-linters) for more info. Trunk Code Quality provides a default `analyzers.yml` if your project does not already have one.
## Links
* [gokart site](https://github.com/praetorian-inc/gokart)
* gokart Trunk Code Quality [integration source](https://github.com/trunk-io/plugins/tree/main/linters/gokart)
* Trunk Code Quality's [open source plugins repo](https://github.com/trunk-io/plugins/tree/main)
# golangci-lint
Source: https://docs.trunk.io/code-quality/overview/linters/supported/golangci-lint
Golangci-lint is a fast Go linters runner. Learn how to install, configure, and use golangci-lint effectively for Go projects.
[**golangci-lint**](https://github.com/golangci/golangci-lint) is a linter for Go.
You can enable the golangci-lint linter with:
```shell theme={null}
trunk check enable golangci-lint
```
## Auto Enabling
golangci-lint will be auto-enabled if any *Go* files are present.
## Settings
golangci-lint supports the following config files:
* `.golangci.json`
* `.golangci.toml`
* `.golangci.yaml`
* `.golangci.yml`
You can move these files to `.trunk/configs` and `trunk check` will still find them. See [Moving Linters](../configure-linters#moving-linters) for more info.
## Usage Notes
Make sure your go version in `go.mod` matches Trunk's go runtime version. At the time of this writing, Trunk's default go runtime version is `1.21.0`. You can find out what it is via `trunk print-config`, and look for the `runtime` section, and you can override the default version in your `trunk.yaml` via:
```yaml theme={null}
runtimes:
enabled:
- go@1.21.0
```
## Links
* [golangci-lint site](https://github.com/golangci/golangci-lint)
* golangci-lint Trunk Code Quality [integration source](https://github.com/trunk-io/plugins/tree/main/linters/golangci-lint)
* Trunk Code Quality's [open source plugins repo](https://github.com/trunk-io/plugins/tree/main)
# golines
Source: https://docs.trunk.io/code-quality/overview/linters/supported/golines
golines is a linter for Go
[**golines**](https://pkg.go.dev/github.com/segmentio/golines) is a linter for Go.
You can enable the golines linter with:
```shell theme={null}
trunk check enable golines
```
## Auto Enabling
golines will never be auto-enabled. It must be enabled manually.
## Links
* [golines site](https://pkg.go.dev/github.com/segmentio/golines)
* golines Trunk Code Quality [integration source](https://github.com/trunk-io/plugins/tree/main/linters/golines)
* Trunk Code Quality's [open source plugins repo](https://github.com/trunk-io/plugins/tree/main)
# google-java-format
Source: https://docs.trunk.io/code-quality/overview/linters/supported/google-java-format
google-java-format is a linter for Java
[**google-java-format**](https://github.com/google/google-java-format#readme) is a linter for Java.
You can enable the google-java-format linter with:
```shell theme={null}
trunk check enable google-java-format
```
## Auto Enabling
google-java-format will never be auto-enabled. It must be enabled manually.
## Links
* [google-java-format site](https://github.com/google/google-java-format#readme)
* google-java-format Trunk Code Quality [integration source](https://github.com/trunk-io/plugins/tree/main/linters/google-java-format)
* Trunk Code Quality's [open source plugins repo](https://github.com/trunk-io/plugins/tree/main)
# graphql-schema-linter
Source: https://docs.trunk.io/code-quality/overview/linters/supported/graphql-schema-linter
graphql-schema-linter is a linter for GraphQL
[**graphql-schema-linter**](https://github.com/cjoudrey/graphql-schema-linter#readme) is a linter for GraphQL.
You can enable the graphql-schema-linter linter with:
```shell theme={null}
trunk check enable graphql-schema-linter
```
## Auto Enabling
graphql-schema-linter will be auto-enabled if any of its config files are present: *`.graphql-schema-linter.config.js`, `.graphql-schema-linterrc`*.
## Settings
graphql-schema-linter supports the following config files:
* `.graphql-schema-linter.config.js`
* `.graphql-schema-linterrc`
You can move these files to `.trunk/configs` and `trunk check` will still find them. See [Moving Linters](../configure-linters#moving-linters) for more info.
## Links
* [graphql-schema-linter site](https://github.com/cjoudrey/graphql-schema-linter#readme)
* graphql-schema-linter Trunk Code Quality [integration source](https://github.com/trunk-io/plugins/tree/main/linters/graphql-schema-linter)
* Trunk Code Quality's [open source plugins repo](https://github.com/trunk-io/plugins/tree/main)
# hadolint
Source: https://docs.trunk.io/code-quality/overview/linters/supported/hadolint
hadolint is a linter for Docker
[**hadolint**](https://github.com/hadolint/hadolint#readme) is a linter for Docker.
You can enable the hadolint linter with:
```shell theme={null}
trunk check enable hadolint
```
## Auto Enabling
hadolint will be auto-enabled if any *Docker* files are present.
## Settings
hadolint supports the following config files:
* `.hadolint.yaml`
* `.hadolint.yml`
You can move these files to `.trunk/configs` and `trunk check` will still find them. See [Moving Linters](../configure-linters#moving-linters) for more info. Trunk Code Quality provides a default `.hadolint.yaml` if your project does not already have one.
## Links
* [hadolint site](https://github.com/hadolint/hadolint#readme)
* hadolint Trunk Code Quality [integration source](https://github.com/trunk-io/plugins/tree/main/linters/hadolint)
* Trunk Code Quality's [open source plugins repo](https://github.com/trunk-io/plugins/tree/main)
# haml-lint
Source: https://docs.trunk.io/code-quality/overview/linters/supported/haml-lint
haml-lint is a linter for HAML
[**haml-lint**](https://github.com/sds/haml-lint#readme) is a linter for HAML.
You can enable the haml-lint linter with:
```shell theme={null}
trunk check enable haml-lint
```
## Auto Enabling
haml-lint will be auto-enabled if any *Haml* files are present.
## Settings
haml-lint supports the following config files:
* `.haml-lint.yml`
You can move these files to `.trunk/configs` and `trunk check` will still find them. See [Moving Linters](../configure-linters#moving-linters) for more info.
## Links
* [haml-lint site](https://github.com/sds/haml-lint#readme)
* haml-lint Trunk Code Quality [integration source](https://github.com/trunk-io/plugins/tree/main/linters/haml-lint)
* Trunk Code Quality's [open source plugins repo](https://github.com/trunk-io/plugins/tree/main)
# Supported Linters
Source: https://docs.trunk.io/code-quality/overview/linters/supported/index
Trunk Code Quality supports over 100 linters and formatters
## Auto Enabling
Gitleaks will be auto-enabled if any of its config files are present: *`.gitleaks.config`, `.gitleaks.toml`, `.gitleaksignore`*.
## Settings
Gitleaks supports the following config files:
* `.gitleaks.config`
* `.gitleaks.toml`
* `.gitleaksignore`
You can move these files to `.trunk/configs` and `trunk check` will still find them. See [Moving Linters](../configure-linters#moving-linters) for more info.
## Usage Notes
Gitleaks v7 only works with Go 1.16, not Go 1.18 while Gitleaks v8 works with 1.18. We recommend using v8, but if you specifically need to use v7 you can override the go runtime version like so:
```yaml theme={null}
runtimes:
enabled:
- go@1.16.7
```
Again, this is not recommended. Just use Gitleaks v8 or later with go 1.18 or later.
## Links
* [Gitleaks site](https://gitleaks.io/)
* Gitleaks Trunk Code Quality [integration source](https://github.com/trunk-io/plugins/tree/main/linters/gitleaks)
* Trunk Code Quality's [open source plugins repo](https://github.com/trunk-io/plugins/tree/main)
# Gofmt
Source: https://docs.trunk.io/code-quality/overview/linters/supported/gofmt
Gofmt simplifies Go coding by automatically formatting code to match Go's style guidelines, enhancing readability and teamwork without the manual hassle.
[**Gofmt**](https://github.com/rhysd/actionlint) is a formatter for Go.
You can enable the Gofmt formatter with:
```shell theme={null}
trunk check enable gofmt
```
## Auto Enabling
Gofmt will be auto-enabled if any *Go* files are present.
## Links
* [Gofmt site](https://github.com/rhysd/actionlint)
* Gofmt Trunk Code Quality [integration source](https://github.com/trunk-io/plugins/tree/main/linters/gofmt)
* Trunk Code Quality's [open source plugins repo](https://github.com/trunk-io/plugins/tree/main)
# gofumpt
Source: https://docs.trunk.io/code-quality/overview/linters/supported/gofumpt
gofumpt is a linter for Go
[**gofumpt**](https://pkg.go.dev/mvdan.cc/gofumpt) is a linter for Go.
You can enable the gofumpt linter with:
```shell theme={null}
trunk check enable gofumpt
```
## Auto Enabling
gofumpt will never be auto-enabled. It must be enabled manually.
## Links
* [gofumpt site](https://pkg.go.dev/mvdan.cc/gofumpt)
* gofumpt Trunk Code Quality [integration source](https://github.com/trunk-io/plugins/tree/main/linters/gofumpt)
* Trunk Code Quality's [open source plugins repo](https://github.com/trunk-io/plugins/tree/main)
# goimports
Source: https://docs.trunk.io/code-quality/overview/linters/supported/goimports
goimports is a linter for Go
[**goimports**](https://pkg.go.dev/golang.org/x/tools/cmd/goimports) is a linter for Go.
You can enable the goimports linter with:
```shell theme={null}
trunk check enable goimports
```
## Auto Enabling
goimports will never be auto-enabled. It must be enabled manually.
## Links
* [goimports site](https://pkg.go.dev/golang.org/x/tools/cmd/goimports)
* goimports Trunk Code Quality [integration source](https://github.com/trunk-io/plugins/tree/main/linters/goimports)
* Trunk Code Quality's [open source plugins repo](https://github.com/trunk-io/plugins/tree/main)
# gokart
Source: https://docs.trunk.io/code-quality/overview/linters/supported/gokart
gokart is a linter for Go
[**gokart**](https://github.com/praetorian-inc/gokart) is a linter for Go.
You can enable the gokart linter with:
```shell theme={null}
trunk check enable gokart
```
## Auto Enabling
gokart will be auto-enabled if a `analyzers.yml` config file is present.
## Settings
gokart supports the following config files:
* `analyzers.yml`
You can move these files to `.trunk/configs` and `trunk check` will still find them. See [Moving Linters](../configure-linters#moving-linters) for more info. Trunk Code Quality provides a default `analyzers.yml` if your project does not already have one.
## Links
* [gokart site](https://github.com/praetorian-inc/gokart)
* gokart Trunk Code Quality [integration source](https://github.com/trunk-io/plugins/tree/main/linters/gokart)
* Trunk Code Quality's [open source plugins repo](https://github.com/trunk-io/plugins/tree/main)
# golangci-lint
Source: https://docs.trunk.io/code-quality/overview/linters/supported/golangci-lint
Golangci-lint is a fast Go linters runner. Learn how to install, configure, and use golangci-lint effectively for Go projects.
[**golangci-lint**](https://github.com/golangci/golangci-lint) is a linter for Go.
You can enable the golangci-lint linter with:
```shell theme={null}
trunk check enable golangci-lint
```
## Auto Enabling
golangci-lint will be auto-enabled if any *Go* files are present.
## Settings
golangci-lint supports the following config files:
* `.golangci.json`
* `.golangci.toml`
* `.golangci.yaml`
* `.golangci.yml`
You can move these files to `.trunk/configs` and `trunk check` will still find them. See [Moving Linters](../configure-linters#moving-linters) for more info.
## Usage Notes
Make sure your go version in `go.mod` matches Trunk's go runtime version. At the time of this writing, Trunk's default go runtime version is `1.21.0`. You can find out what it is via `trunk print-config`, and look for the `runtime` section, and you can override the default version in your `trunk.yaml` via:
```yaml theme={null}
runtimes:
enabled:
- go@1.21.0
```
## Links
* [golangci-lint site](https://github.com/golangci/golangci-lint)
* golangci-lint Trunk Code Quality [integration source](https://github.com/trunk-io/plugins/tree/main/linters/golangci-lint)
* Trunk Code Quality's [open source plugins repo](https://github.com/trunk-io/plugins/tree/main)
# golines
Source: https://docs.trunk.io/code-quality/overview/linters/supported/golines
golines is a linter for Go
[**golines**](https://pkg.go.dev/github.com/segmentio/golines) is a linter for Go.
You can enable the golines linter with:
```shell theme={null}
trunk check enable golines
```
## Auto Enabling
golines will never be auto-enabled. It must be enabled manually.
## Links
* [golines site](https://pkg.go.dev/github.com/segmentio/golines)
* golines Trunk Code Quality [integration source](https://github.com/trunk-io/plugins/tree/main/linters/golines)
* Trunk Code Quality's [open source plugins repo](https://github.com/trunk-io/plugins/tree/main)
# google-java-format
Source: https://docs.trunk.io/code-quality/overview/linters/supported/google-java-format
google-java-format is a linter for Java
[**google-java-format**](https://github.com/google/google-java-format#readme) is a linter for Java.
You can enable the google-java-format linter with:
```shell theme={null}
trunk check enable google-java-format
```
## Auto Enabling
google-java-format will never be auto-enabled. It must be enabled manually.
## Links
* [google-java-format site](https://github.com/google/google-java-format#readme)
* google-java-format Trunk Code Quality [integration source](https://github.com/trunk-io/plugins/tree/main/linters/google-java-format)
* Trunk Code Quality's [open source plugins repo](https://github.com/trunk-io/plugins/tree/main)
# graphql-schema-linter
Source: https://docs.trunk.io/code-quality/overview/linters/supported/graphql-schema-linter
graphql-schema-linter is a linter for GraphQL
[**graphql-schema-linter**](https://github.com/cjoudrey/graphql-schema-linter#readme) is a linter for GraphQL.
You can enable the graphql-schema-linter linter with:
```shell theme={null}
trunk check enable graphql-schema-linter
```
## Auto Enabling
graphql-schema-linter will be auto-enabled if any of its config files are present: *`.graphql-schema-linter.config.js`, `.graphql-schema-linterrc`*.
## Settings
graphql-schema-linter supports the following config files:
* `.graphql-schema-linter.config.js`
* `.graphql-schema-linterrc`
You can move these files to `.trunk/configs` and `trunk check` will still find them. See [Moving Linters](../configure-linters#moving-linters) for more info.
## Links
* [graphql-schema-linter site](https://github.com/cjoudrey/graphql-schema-linter#readme)
* graphql-schema-linter Trunk Code Quality [integration source](https://github.com/trunk-io/plugins/tree/main/linters/graphql-schema-linter)
* Trunk Code Quality's [open source plugins repo](https://github.com/trunk-io/plugins/tree/main)
# hadolint
Source: https://docs.trunk.io/code-quality/overview/linters/supported/hadolint
hadolint is a linter for Docker
[**hadolint**](https://github.com/hadolint/hadolint#readme) is a linter for Docker.
You can enable the hadolint linter with:
```shell theme={null}
trunk check enable hadolint
```
## Auto Enabling
hadolint will be auto-enabled if any *Docker* files are present.
## Settings
hadolint supports the following config files:
* `.hadolint.yaml`
* `.hadolint.yml`
You can move these files to `.trunk/configs` and `trunk check` will still find them. See [Moving Linters](../configure-linters#moving-linters) for more info. Trunk Code Quality provides a default `.hadolint.yaml` if your project does not already have one.
## Links
* [hadolint site](https://github.com/hadolint/hadolint#readme)
* hadolint Trunk Code Quality [integration source](https://github.com/trunk-io/plugins/tree/main/linters/hadolint)
* Trunk Code Quality's [open source plugins repo](https://github.com/trunk-io/plugins/tree/main)
# haml-lint
Source: https://docs.trunk.io/code-quality/overview/linters/supported/haml-lint
haml-lint is a linter for HAML
[**haml-lint**](https://github.com/sds/haml-lint#readme) is a linter for HAML.
You can enable the haml-lint linter with:
```shell theme={null}
trunk check enable haml-lint
```
## Auto Enabling
haml-lint will be auto-enabled if any *Haml* files are present.
## Settings
haml-lint supports the following config files:
* `.haml-lint.yml`
You can move these files to `.trunk/configs` and `trunk check` will still find them. See [Moving Linters](../configure-linters#moving-linters) for more info.
## Links
* [haml-lint site](https://github.com/sds/haml-lint#readme)
* haml-lint Trunk Code Quality [integration source](https://github.com/trunk-io/plugins/tree/main/linters/haml-lint)
* Trunk Code Quality's [open source plugins repo](https://github.com/trunk-io/plugins/tree/main)
# Supported Linters
Source: https://docs.trunk.io/code-quality/overview/linters/supported/index
Trunk Code Quality supports over 100 linters and formatters
#### Our linter integrations are open-source!
You can find them at [`trunk-io/plugins`](https://github.com/trunk-io/plugins), contributions are welcome!
Enable any of the following tools with:
```
trunk check enable
```
| Technology | Linters |
| --------------- | -------------------------------------------------------------------------------------------------------------------------------------------------------------------------------------------------------------------------------------------------- |
| All | [codespell](./codespell), [cspell](./cspell), [git-diff-check](./git-diff-check), [gitleaks](./gitleaks), [pre-commit-hooks](./pre-commit-hooks) |
| Ansible | [ansible-lint](./ansible-lint) |
| Apex | [pmd](./pmd) |
| Bash | [shellcheck](./shellcheck), [shfmt](./shfmt) |
| Bazel, Starlark | [buildifier](./buildifier) |
| C# | [dotnet-format](./dotnet-format) |
| C, C++ | [clang-format](./clang-format), [clang-tidy](./clang-tidy), [cmake-format](./cmake-format), [iwyu](./iwyu), [pragma-once](./pragma-once) |
| CircleCI Config | [circleci](./circleci) |
| CloudFormation | [cfnlint](./cfnlint), [checkov](./checkov) |
| CSS, SCSS | [prettier](./prettier), [stylelint](./stylelint) |
| Cue | [cue-fmt](./cue-fmt) |
| Dart | [dart](./dart) |
| Docker | [checkov](./checkov), [hadolint](./hadolint) |
| Dotenv | [dotenv-linter](./dotenv-linter) |
| GitHub | [actionlint](./actionlint) |
| Go | [gofmt](./gofmt), [gofumpt](./gofumpt), [goimports](./goimports), [gokart](./gokart), [golangci-lint](./golangci-lint), [golines](./golines), [semgrep](./semgrep) |
| GraphQL | [graphql-schema-linter](./graphql-schema-linter), [prettier](./prettier) |
| HAML | [haml-lint](./haml-lint) |
| HTML Templates | [djlint](./djlint) |
| Java | [google-java-format](./google-java-format), [pmd](./pmd), [semgrep](./semgrep) |
| JavaScript | [biome](./biome), [deno](./deno), [eslint](./eslint), [prettier](./prettier), [rome](./rome), [semgrep](./semgrep) |
| JSON | [deno](./deno), [eslint](./eslint), [prettier](./prettier), [semgrep](./semgrep) |
| json | [biome](./biome) |
| jsx | [biome](./biome) |
| Kotlin | [detekt](./detekt), [ktlint](./ktlint) |
| Kubernetes | [kube-linter](./kube-linter) |
| Lua | [stylua](./stylua) |
| Markdown | [deno](./deno), [markdown-link-check](./markdown-link-check), [markdown-table-prettify](./markdown-table-prettify), [markdownlint](./markdownlint), [markdownlint-cli2](./markdownlint-cli2), [prettier](./prettier), [remark-lint](./remark-lint) |
| Nix | [nixpkgs-fmt](./nixpkgs-fmt) |
| package.json | [sort-package-json](./sort-package-json) |
| Perl | [perlcritic](./perlcritic), [perltidy](./perltidy) |
| PHP | [php-cs-fixer](./php-cs-fixer), [phpstan](./phpstan) |
| PNG | [oxipng](./oxipng) |
| PowerShell | [psscriptanalyzer](./psscriptanalyzer) |
| Prisma | [prisma](./prisma) |
| prose | [vale](./vale) |
| Protobuf | [buf](./buf), [clang-format](./clang-format), [clang-tidy](./clang-tidy) |
| Python | [autopep8](./autopep8), [bandit](./bandit), [black](./black), [flake8](./flake8), [isort](./isort), [mypy](./mypy), [pylint](./pylint), [pyright](./pyright), [ruff](./ruff), [semgrep](./semgrep), [sourcery](./sourcery), [yapf](./yapf) |
| Rego | [opa](./opa), [regal](./regal) |
| Renovate | [renovate](./renovate) |
| Ruby | [brakeman](./brakeman), [rubocop](./rubocop), [rufo](./rufo), [semgrep](./semgrep), [standardrb](./standardrb) |
| Rust | [clippy](./clippy), [rustfmt](./rustfmt) |
| Scala | [scalafmt](./scalafmt) |
| Security | [checkov](./checkov), [dustilock](./dustilock), [nancy](./nancy), [osv-scanner](./osv-scanner), [terrascan](./terrascan), [tfsec](./tfsec), [trivy](./trivy), [trufflehog](./trufflehog) |
| SQL | [sql-formatter](./sql-formatter), [sqlfluff](./sqlfluff), [sqlfmt](./sqlfmt), [squawk](./squawk) |
| SVG | [svgo](./svgo) |
| Swift | [stringslint](./stringslint), [swiftformat](./swiftformat), [swiftlint](./swiftlint) |
| Terraform | [checkov](./checkov), [terraform](./terraform), [terrascan](./terrascan), [tflint](./tflint), [tfsec](./tfsec), [tofu](./tofu) |
| Terragrunt | [terragrunt](./terragrunt) |
| Terrascan | [terrascan](./terrascan) |
| Textproto | [txtpbfmt](./txtpbfmt) |
| TOML | [taplo](./taplo) |
| TypeScript | [biome](./biome), [deno](./deno), [eslint](./eslint), [prettier](./prettier), [rome](./rome), [semgrep](./semgrep) |
| YAML | [prettier](./prettier), [semgrep](./semgrep), [yamllint](./yamllint) |
#### Can't find a linter you need?
Suggest ideas and contribute by opening an issue at [github.com/trunk-io](https://github.com/trunk-io).
# isort
Source: https://docs.trunk.io/code-quality/overview/linters/supported/isort
isort is a Python utility for sorting imports alphabetically and automatically separating them into sections and by type.
[**isort**](https://pycqa.github.io/isort/) is a formatter for Python.
You can enable the isort formatter with:
```shell theme={null}
trunk check enable isort
```
![isort example output]() ## Auto Enabling
isort will be auto-enabled if any *Python* files are present.
## Settings
isort supports the following config files:
* `.isort.cfg`
You can move these files to `.trunk/configs` and `trunk check` will still find them. See [Moving Linters](../configure-linters#moving-linters) for more info. Trunk Code Quality provides a default `.isort.cfg` if your project does not already have one.
## Links
* [isort site](https://pycqa.github.io/isort/)
* isort Trunk Code Quality [integration source](https://github.com/trunk-io/plugins/tree/main/linters/isort)
* Trunk Code Quality's [open source plugins repo](https://github.com/trunk-io/plugins/tree/main)
# iwyu
Source: https://docs.trunk.io/code-quality/overview/linters/supported/iwyu
iwyu is a linter for C, C++
[**iwyu**](https://github.com/include-what-you-use/include-what-you-use#readme) is a linter for C, C++.
You can enable the iwyu linter with:
```shell theme={null}
trunk check enable iwyu
```
## Auto Enabling
iwyu will never be auto-enabled. It must be enabled manually.
## Links
* [iwyu site](https://github.com/include-what-you-use/include-what-you-use#readme)
* iwyu Trunk Code Quality [integration source](https://github.com/trunk-io/plugins/tree/main/linters/iwyu)
* Trunk Code Quality's [open source plugins repo](https://github.com/trunk-io/plugins/tree/main)
# ktlint
Source: https://docs.trunk.io/code-quality/overview/linters/supported/ktlint
ktlint is a linter for Kotlin
[**ktlint**](https://github.com/pinterest/ktlint#readme) is a linter for Kotlin.
You can enable the ktlint linter with:
```shell theme={null}
trunk check enable ktlint
```
## Auto Enabling
ktlint will be auto-enabled if any *Kotlin* files are present.
## Links
* [ktlint site](https://github.com/pinterest/ktlint#readme)
* ktlint Trunk Code Quality [integration source](https://github.com/trunk-io/plugins/tree/main/linters/ktlint)
* Trunk Code Quality's [open source plugins repo](https://github.com/trunk-io/plugins/tree/main)
# kube-linter
Source: https://docs.trunk.io/code-quality/overview/linters/supported/kube-linter
kube-linter is a linter for Kubernetes
[**kube-linter**](https://github.com/stackrox/kube-linter#readme) is a linter for Kubernetes.
You can enable the kube-linter linter with:
```shell theme={null}
trunk check enable kube-linter
```
## Auto Enabling
kube-linter will never be auto-enabled. It must be enabled manually.
## Links
* [kube-linter site](https://github.com/stackrox/kube-linter#readme)
* kube-linter Trunk Code Quality [integration source](https://github.com/trunk-io/plugins/tree/main/linters/kube-linter)
* Trunk Code Quality's [open source plugins repo](https://github.com/trunk-io/plugins/tree/main)
# markdown-link-check
Source: https://docs.trunk.io/code-quality/overview/linters/supported/markdown-link-check
markdown-link-check is a linter for Markdown
[**markdown-link-check**](https://github.com/tcort/markdown-link-check#readme) is a linter for Markdown.
You can enable the markdown-link-check linter with:
```shell theme={null}
trunk check enable markdown-link-check
```
## Auto Enabling
markdown-link-check will never be auto-enabled. It must be enabled manually.
## Links
* [markdown-link-check site](https://github.com/tcort/markdown-link-check#readme)
* markdown-link-check Trunk Code Quality [integration source](https://github.com/trunk-io/plugins/tree/main/linters/markdown-link-check)
* Trunk Code Quality's [open source plugins repo](https://github.com/trunk-io/plugins/tree/main)
# markdown-table-prettify
Source: https://docs.trunk.io/code-quality/overview/linters/supported/markdown-table-prettify
markdown-table-prettify is a linter for Markdown
[**markdown-table-prettify**](https://github.com/darkriszty/MarkdownTablePrettify-VSCodeExt#readme) is a linter for Markdown.
You can enable the markdown-table-prettify linter with:
```shell theme={null}
trunk check enable markdown-table-prettify
```
## Auto Enabling
markdown-table-prettify will never be auto-enabled. It must be enabled manually.
## Links
* [markdown-table-prettify site](https://github.com/darkriszty/MarkdownTablePrettify-VSCodeExt#readme)
* markdown-table-prettify Trunk Code Quality [integration source](https://github.com/trunk-io/plugins/tree/main/linters/markdown-table-prettify)
* Trunk Code Quality's [open source plugins repo](https://github.com/trunk-io/plugins/tree/main)
# Markdownlint
Source: https://docs.trunk.io/code-quality/overview/linters/supported/markdownlint
Markdownlint is a tool designed to enforce consistency for Markdown files. It can include checks for headings, lists, line length, and syntax preferences.
[**Markdownlint**](https://github.com/DavidAnson/markdownlint) is a linter for Markdown.
You can enable the Markdownlint linter with:
```shell theme={null}
trunk check enable markdownlint
```
## Auto Enabling
Markdownlint will be auto-enabled if any *Markdown* files are present.
## Settings
Markdownlint supports the following config files:
* `.markdownlint.json`
* `.markdownlint.yaml`
* `.markdownlint.yml`
* `.markdownlintrc`
You can move these files to `.trunk/configs` and `trunk check` will still find them. See [Moving Linters](../configure-linters#moving-linters) for more info. Trunk Code Quality provides a default `.markdownlint.yaml` if your project does not already have one.
## Usage Notes
Older versions of `markdownlint` had a bug where it printed plaintext output even when run with `--json`. We rely on JSON output so we can parse and ingest the results from markdownlint. The package we use for markdownlint is actually [markdownlint-cli ](https://www.npmjs.com/package/markdownlint-cli)`>= 0.29.0` is verified to work.
## Links
* [Markdownlint site](https://github.com/DavidAnson/markdownlint)
* Markdownlint Trunk Code Quality [integration source](https://github.com/trunk-io/plugins/tree/main/linters/markdownlint)
* Trunk Code Quality's [open source plugins repo](https://github.com/trunk-io/plugins/tree/main)
# markdownlint-cli2
Source: https://docs.trunk.io/code-quality/overview/linters/supported/markdownlint-cli2
markdownlint-cli2 is a linter for Markdown
[**markdownlint-cli2**](https://github.com/DavidAnson/markdownlint-cli2) is a linter for Markdown.
You can enable the markdownlint-cli2 linter with:
```shell theme={null}
trunk check enable markdownlint-cli2
```
## Auto Enabling
markdownlint-cli2 will be auto-enabled if any of its config files are present: *`.markdownlint-cli2.jsonc`, `.markdownlint-cli2.yaml`, `.markdownlint-cli2.cjs`*.
## Settings
markdownlint-cli2 supports the following config files:
* `.markdownlint-cli2.jsonc`
* `.markdownlint-cli2.yaml`
* `.markdownlint-cli2.cjs`
* `.markdownlint-cli2.mjs`
You can move these files to `.trunk/configs` and `trunk check` will still find them. See [Moving Linters](../configure-linters#moving-linters) for more info.
## Links
* [markdownlint-cli2 site](https://github.com/DavidAnson/markdownlint-cli2)
* markdownlint-cli2 Trunk Code Quality [integration source](https://github.com/trunk-io/plugins/tree/main/linters/markdownlint-cli2)
* Trunk Code Quality's [open source plugins repo](https://github.com/trunk-io/plugins/tree/main)
# mypy
Source: https://docs.trunk.io/code-quality/overview/linters/supported/mypy
mypy is a linter for Python
[**mypy**](https://github.com/python/mypy#readme) is a linter for Python.
You can enable the mypy linter with:
```shell theme={null}
trunk check enable mypy
```
## Auto Enabling
isort will be auto-enabled if any *Python* files are present.
## Settings
isort supports the following config files:
* `.isort.cfg`
You can move these files to `.trunk/configs` and `trunk check` will still find them. See [Moving Linters](../configure-linters#moving-linters) for more info. Trunk Code Quality provides a default `.isort.cfg` if your project does not already have one.
## Links
* [isort site](https://pycqa.github.io/isort/)
* isort Trunk Code Quality [integration source](https://github.com/trunk-io/plugins/tree/main/linters/isort)
* Trunk Code Quality's [open source plugins repo](https://github.com/trunk-io/plugins/tree/main)
# iwyu
Source: https://docs.trunk.io/code-quality/overview/linters/supported/iwyu
iwyu is a linter for C, C++
[**iwyu**](https://github.com/include-what-you-use/include-what-you-use#readme) is a linter for C, C++.
You can enable the iwyu linter with:
```shell theme={null}
trunk check enable iwyu
```
## Auto Enabling
iwyu will never be auto-enabled. It must be enabled manually.
## Links
* [iwyu site](https://github.com/include-what-you-use/include-what-you-use#readme)
* iwyu Trunk Code Quality [integration source](https://github.com/trunk-io/plugins/tree/main/linters/iwyu)
* Trunk Code Quality's [open source plugins repo](https://github.com/trunk-io/plugins/tree/main)
# ktlint
Source: https://docs.trunk.io/code-quality/overview/linters/supported/ktlint
ktlint is a linter for Kotlin
[**ktlint**](https://github.com/pinterest/ktlint#readme) is a linter for Kotlin.
You can enable the ktlint linter with:
```shell theme={null}
trunk check enable ktlint
```
## Auto Enabling
ktlint will be auto-enabled if any *Kotlin* files are present.
## Links
* [ktlint site](https://github.com/pinterest/ktlint#readme)
* ktlint Trunk Code Quality [integration source](https://github.com/trunk-io/plugins/tree/main/linters/ktlint)
* Trunk Code Quality's [open source plugins repo](https://github.com/trunk-io/plugins/tree/main)
# kube-linter
Source: https://docs.trunk.io/code-quality/overview/linters/supported/kube-linter
kube-linter is a linter for Kubernetes
[**kube-linter**](https://github.com/stackrox/kube-linter#readme) is a linter for Kubernetes.
You can enable the kube-linter linter with:
```shell theme={null}
trunk check enable kube-linter
```
## Auto Enabling
kube-linter will never be auto-enabled. It must be enabled manually.
## Links
* [kube-linter site](https://github.com/stackrox/kube-linter#readme)
* kube-linter Trunk Code Quality [integration source](https://github.com/trunk-io/plugins/tree/main/linters/kube-linter)
* Trunk Code Quality's [open source plugins repo](https://github.com/trunk-io/plugins/tree/main)
# markdown-link-check
Source: https://docs.trunk.io/code-quality/overview/linters/supported/markdown-link-check
markdown-link-check is a linter for Markdown
[**markdown-link-check**](https://github.com/tcort/markdown-link-check#readme) is a linter for Markdown.
You can enable the markdown-link-check linter with:
```shell theme={null}
trunk check enable markdown-link-check
```
## Auto Enabling
markdown-link-check will never be auto-enabled. It must be enabled manually.
## Links
* [markdown-link-check site](https://github.com/tcort/markdown-link-check#readme)
* markdown-link-check Trunk Code Quality [integration source](https://github.com/trunk-io/plugins/tree/main/linters/markdown-link-check)
* Trunk Code Quality's [open source plugins repo](https://github.com/trunk-io/plugins/tree/main)
# markdown-table-prettify
Source: https://docs.trunk.io/code-quality/overview/linters/supported/markdown-table-prettify
markdown-table-prettify is a linter for Markdown
[**markdown-table-prettify**](https://github.com/darkriszty/MarkdownTablePrettify-VSCodeExt#readme) is a linter for Markdown.
You can enable the markdown-table-prettify linter with:
```shell theme={null}
trunk check enable markdown-table-prettify
```
## Auto Enabling
markdown-table-prettify will never be auto-enabled. It must be enabled manually.
## Links
* [markdown-table-prettify site](https://github.com/darkriszty/MarkdownTablePrettify-VSCodeExt#readme)
* markdown-table-prettify Trunk Code Quality [integration source](https://github.com/trunk-io/plugins/tree/main/linters/markdown-table-prettify)
* Trunk Code Quality's [open source plugins repo](https://github.com/trunk-io/plugins/tree/main)
# Markdownlint
Source: https://docs.trunk.io/code-quality/overview/linters/supported/markdownlint
Markdownlint is a tool designed to enforce consistency for Markdown files. It can include checks for headings, lists, line length, and syntax preferences.
[**Markdownlint**](https://github.com/DavidAnson/markdownlint) is a linter for Markdown.
You can enable the Markdownlint linter with:
```shell theme={null}
trunk check enable markdownlint
```
## Auto Enabling
Markdownlint will be auto-enabled if any *Markdown* files are present.
## Settings
Markdownlint supports the following config files:
* `.markdownlint.json`
* `.markdownlint.yaml`
* `.markdownlint.yml`
* `.markdownlintrc`
You can move these files to `.trunk/configs` and `trunk check` will still find them. See [Moving Linters](../configure-linters#moving-linters) for more info. Trunk Code Quality provides a default `.markdownlint.yaml` if your project does not already have one.
## Usage Notes
Older versions of `markdownlint` had a bug where it printed plaintext output even when run with `--json`. We rely on JSON output so we can parse and ingest the results from markdownlint. The package we use for markdownlint is actually [markdownlint-cli ](https://www.npmjs.com/package/markdownlint-cli)`>= 0.29.0` is verified to work.
## Links
* [Markdownlint site](https://github.com/DavidAnson/markdownlint)
* Markdownlint Trunk Code Quality [integration source](https://github.com/trunk-io/plugins/tree/main/linters/markdownlint)
* Trunk Code Quality's [open source plugins repo](https://github.com/trunk-io/plugins/tree/main)
# markdownlint-cli2
Source: https://docs.trunk.io/code-quality/overview/linters/supported/markdownlint-cli2
markdownlint-cli2 is a linter for Markdown
[**markdownlint-cli2**](https://github.com/DavidAnson/markdownlint-cli2) is a linter for Markdown.
You can enable the markdownlint-cli2 linter with:
```shell theme={null}
trunk check enable markdownlint-cli2
```
## Auto Enabling
markdownlint-cli2 will be auto-enabled if any of its config files are present: *`.markdownlint-cli2.jsonc`, `.markdownlint-cli2.yaml`, `.markdownlint-cli2.cjs`*.
## Settings
markdownlint-cli2 supports the following config files:
* `.markdownlint-cli2.jsonc`
* `.markdownlint-cli2.yaml`
* `.markdownlint-cli2.cjs`
* `.markdownlint-cli2.mjs`
You can move these files to `.trunk/configs` and `trunk check` will still find them. See [Moving Linters](../configure-linters#moving-linters) for more info.
## Links
* [markdownlint-cli2 site](https://github.com/DavidAnson/markdownlint-cli2)
* markdownlint-cli2 Trunk Code Quality [integration source](https://github.com/trunk-io/plugins/tree/main/linters/markdownlint-cli2)
* Trunk Code Quality's [open source plugins repo](https://github.com/trunk-io/plugins/tree/main)
# mypy
Source: https://docs.trunk.io/code-quality/overview/linters/supported/mypy
mypy is a linter for Python
[**mypy**](https://github.com/python/mypy#readme) is a linter for Python.
You can enable the mypy linter with:
```shell theme={null}
trunk check enable mypy
```
![mypy example output]() ## Auto Enabling
mypy will be auto-enabled if any of its config files are present: *`mypy.ini`, `.mypy.ini`*.
## Settings
mypy supports the following config files:
* `mypy.ini`
* `.mypy.ini`
You can move these files to `.trunk/configs` and `trunk check` will still find them. See [Moving Linters](../configure-linters#moving-linters) for more info.
## Links
* [mypy site](https://github.com/python/mypy#readme)
* mypy Trunk Code Quality [integration source](https://github.com/trunk-io/plugins/tree/main/linters/mypy)
* Trunk Code Quality's [open source plugins repo](https://github.com/trunk-io/plugins/tree/main)
# nancy
Source: https://docs.trunk.io/code-quality/overview/linters/supported/nancy
nancy is a linter for Security
[**nancy**](https://github.com/sonatype-nexus-community/nancy#readme) is a linter for Security.
You can enable the nancy linter with:
```shell theme={null}
trunk check enable nancy
```
## Auto Enabling
nancy will never be auto-enabled. It must be enabled manually.
## Links
* [nancy site](https://github.com/sonatype-nexus-community/nancy#readme)
* nancy Trunk Code Quality [integration source](https://github.com/trunk-io/plugins/tree/main/linters/nancy)
* Trunk Code Quality's [open source plugins repo](https://github.com/trunk-io/plugins/tree/main)
# nixpkgs-fmt
Source: https://docs.trunk.io/code-quality/overview/linters/supported/nixpkgs-fmt
nixpkgs-fmt is a linter for Nix
[**nixpkgs-fmt**](https://github.com/nix-community/nixpkgs-fmt) is a linter for Nix.
You can enable the nixpkgs-fmt linter with:
```shell theme={null}
trunk check enable nixpkgs-fmt
```
## Auto Enabling
nixpkgs-fmt will be auto-enabled if any *Nix* files are present.
## Links
* [nixpkgs-fmt site](https://github.com/nix-community/nixpkgs-fmt)
* nixpkgs-fmt Trunk Code Quality [integration source](https://github.com/trunk-io/plugins/tree/main/linters/nixpkgs-fmt)
* Trunk Code Quality's [open source plugins repo](https://github.com/trunk-io/plugins/tree/main)
# opa
Source: https://docs.trunk.io/code-quality/overview/linters/supported/opa
opa is a linter for Rego
[**opa**](https://www.openpolicyagent.org/docs/latest/cli/#opa-fmt) is a linter for Rego.
You can enable the opa linter with:
```shell theme={null}
trunk check enable opa
```
## Auto Enabling
opa will never be auto-enabled. It must be enabled manually.
## Links
* [opa site](https://www.openpolicyagent.org/docs/latest/cli/#opa-fmt)
* opa Trunk Code Quality [integration source](https://github.com/trunk-io/plugins/tree/main/linters/opa)
* Trunk Code Quality's [open source plugins repo](https://github.com/trunk-io/plugins/tree/main)
# OSV-Scanner
Source: https://docs.trunk.io/code-quality/overview/linters/supported/osv-scanner
OSV-Scanner is an open-source tool created by Google to detect vulnerabilities in projects by scanning dependencies against the OSV database.
[**OSV-Scanner**](https://github.com/google/osv-scanner) is a linter for Security.
You can enable the OSV-Scanner linter with:
```shell theme={null}
trunk check enable osv-scanner
```
## Auto Enabling
OSV-Scanner will be auto-enabled if any *Lockfile* files are present.
## Settings
OSV-Scanner supports the following config files:
* `osv-scanner.toml`
You can move these files to `.trunk/configs` and `trunk check` will still find them. See [Moving Linters](../configure-linters#moving-linters) for more info.
## Auto Enabling
mypy will be auto-enabled if any of its config files are present: *`mypy.ini`, `.mypy.ini`*.
## Settings
mypy supports the following config files:
* `mypy.ini`
* `.mypy.ini`
You can move these files to `.trunk/configs` and `trunk check` will still find them. See [Moving Linters](../configure-linters#moving-linters) for more info.
## Links
* [mypy site](https://github.com/python/mypy#readme)
* mypy Trunk Code Quality [integration source](https://github.com/trunk-io/plugins/tree/main/linters/mypy)
* Trunk Code Quality's [open source plugins repo](https://github.com/trunk-io/plugins/tree/main)
# nancy
Source: https://docs.trunk.io/code-quality/overview/linters/supported/nancy
nancy is a linter for Security
[**nancy**](https://github.com/sonatype-nexus-community/nancy#readme) is a linter for Security.
You can enable the nancy linter with:
```shell theme={null}
trunk check enable nancy
```
## Auto Enabling
nancy will never be auto-enabled. It must be enabled manually.
## Links
* [nancy site](https://github.com/sonatype-nexus-community/nancy#readme)
* nancy Trunk Code Quality [integration source](https://github.com/trunk-io/plugins/tree/main/linters/nancy)
* Trunk Code Quality's [open source plugins repo](https://github.com/trunk-io/plugins/tree/main)
# nixpkgs-fmt
Source: https://docs.trunk.io/code-quality/overview/linters/supported/nixpkgs-fmt
nixpkgs-fmt is a linter for Nix
[**nixpkgs-fmt**](https://github.com/nix-community/nixpkgs-fmt) is a linter for Nix.
You can enable the nixpkgs-fmt linter with:
```shell theme={null}
trunk check enable nixpkgs-fmt
```
## Auto Enabling
nixpkgs-fmt will be auto-enabled if any *Nix* files are present.
## Links
* [nixpkgs-fmt site](https://github.com/nix-community/nixpkgs-fmt)
* nixpkgs-fmt Trunk Code Quality [integration source](https://github.com/trunk-io/plugins/tree/main/linters/nixpkgs-fmt)
* Trunk Code Quality's [open source plugins repo](https://github.com/trunk-io/plugins/tree/main)
# opa
Source: https://docs.trunk.io/code-quality/overview/linters/supported/opa
opa is a linter for Rego
[**opa**](https://www.openpolicyagent.org/docs/latest/cli/#opa-fmt) is a linter for Rego.
You can enable the opa linter with:
```shell theme={null}
trunk check enable opa
```
## Auto Enabling
opa will never be auto-enabled. It must be enabled manually.
## Links
* [opa site](https://www.openpolicyagent.org/docs/latest/cli/#opa-fmt)
* opa Trunk Code Quality [integration source](https://github.com/trunk-io/plugins/tree/main/linters/opa)
* Trunk Code Quality's [open source plugins repo](https://github.com/trunk-io/plugins/tree/main)
# OSV-Scanner
Source: https://docs.trunk.io/code-quality/overview/linters/supported/osv-scanner
OSV-Scanner is an open-source tool created by Google to detect vulnerabilities in projects by scanning dependencies against the OSV database.
[**OSV-Scanner**](https://github.com/google/osv-scanner) is a linter for Security.
You can enable the OSV-Scanner linter with:
```shell theme={null}
trunk check enable osv-scanner
```
## Auto Enabling
OSV-Scanner will be auto-enabled if any *Lockfile* files are present.
## Settings
OSV-Scanner supports the following config files:
* `osv-scanner.toml`
You can move these files to `.trunk/configs` and `trunk check` will still find them. See [Moving Linters](../configure-linters#moving-linters) for more info.
Moving `osv-scanner.toml` to `.trunk/configs` can cause issues because `osv-scanner.toml` is only applied to projects in the root folder by default. This can cause issues with any projects in subfolders, such as in a multi-module repository.
To properly configure OSV scanner if you decide to move its config file, you can specify the path to `osv-scanner.toml` using the `--config` flag.\
\
Example override to add to `trunk.yaml` :
```yaml theme={null}
commands:
- name: scan
run: |
osv-scanner \
--lockfile=${target} \
--format json \
--config=.trunk/configs/osv-scanner.toml
```
## Links
* [OSV-Scanner site](https://github.com/google/osv-scanner)
* [OSV-Scanner Configuration](https://google.github.io/osv-scanner/configuration/)
* OSV-Scanner Trunk Code Quality [integration source](https://github.com/trunk-io/plugins/tree/main/linters/osv-scanner)
* Trunk Code Quality's [open source plugins repo](https://github.com/trunk-io/plugins/tree/main)
# Oxipng
Source: https://docs.trunk.io/code-quality/overview/linters/supported/oxipng
Oxipng is an open-source, CLI utility designed for optimizing PNG files. It applies lossless compression techniques to reduce file size.
[**Oxipng**](https://github.com/shssoichiro/oxipng) is a formatter for PNG.
You can enable the Oxipng formatter with:
```shell theme={null}
trunk check enable oxipng
```
## Auto Enabling
Oxipng will be auto-enabled if any *PNG* files are present.
## Links
* [Oxipng site](https://github.com/shssoichiro/oxipng)
* Oxipng Trunk Code Quality [integration source](https://github.com/trunk-io/plugins/tree/main/linters/oxipng)
* Trunk Code Quality's [open source plugins repo](https://github.com/trunk-io/plugins/tree/main)
# perlcritic
Source: https://docs.trunk.io/code-quality/overview/linters/supported/perlcritic
perlcritic is a linter for Perl
[**perlcritic**](https://metacpan.org/pod/Perl::Critic) is a linter for Perl.
You can enable the perlcritic linter with:
```shell theme={null}
trunk check enable perlcritic
```
## Auto Enabling
perlcritic will be auto-enabled if a `.perlcriticrc` config file is present.
## Settings
perlcritic supports the following config files:
* `.perlcriticrc`
You can move these files to `.trunk/configs` and `trunk check` will still find them. See [Moving Linters](../configure-linters#moving-linters) for more info. Trunk Code Quality provides a default `.perlcriticrc` if your project does not already have one.
## Links
* [perlcritic site](https://metacpan.org/pod/Perl::Critic)
* perlcritic Trunk Code Quality [integration source](https://github.com/trunk-io/plugins/tree/main/linters/perlcritic)
* Trunk Code Quality's [open source plugins repo](https://github.com/trunk-io/plugins/tree/main)
# perltidy
Source: https://docs.trunk.io/code-quality/overview/linters/supported/perltidy
perltidy is a linter for Perl
[**perltidy**](https://metacpan.org/dist/Perl-Tidy/view/bin/perltidy) is a linter for Perl.
You can enable the perltidy linter with:
```shell theme={null}
trunk check enable perltidy
```
## Auto Enabling
perltidy will be auto-enabled if a `.perltidyrc` config file is present.
## Settings
perltidy supports the following config files:
* `.perltidyrc`
You can move these files to `.trunk/configs` and `trunk check` will still find them. See [Moving Linters](../configure-linters#moving-linters) for more info. Trunk Code Quality provides a default `.perltidyrc` if your project does not already have one.
## Links
* [perltidy site](https://metacpan.org/dist/Perl-Tidy/view/bin/perltidy)
* perltidy Trunk Code Quality [integration source](https://github.com/trunk-io/plugins/tree/main/linters/perltidy)
* Trunk Code Quality's [open source plugins repo](https://github.com/trunk-io/plugins/tree/main)
# php-cs-fixer
Source: https://docs.trunk.io/code-quality/overview/linters/supported/php-cs-fixer
php-cs-fixer is a linter for PHP
[**php-cs-fixer**](https://github.com/PHP-CS-Fixer/PHP-CS-Fixer) is a linter for PHP.
You can enable the php-cs-fixer linter with:
```shell theme={null}
trunk check enable php-cs-fixer
```
## Auto Enabling
php-cs-fixer will be auto-enabled if a `.php-cs-fixer.dist.php` config file is present.
## Settings
php-cs-fixer supports the following config files:
* `.php-cs-fixer.dist.php`
You can move these files to `.trunk/configs` and `trunk check` will still find them. See [Moving Linters](../configure-linters#moving-linters) for more info.
## Links
* [php-cs-fixer site](https://github.com/PHP-CS-Fixer/PHP-CS-Fixer)
* php-cs-fixer Trunk Code Quality [integration source](https://github.com/trunk-io/plugins/tree/main/linters/php-cs-fixer)
* Trunk Code Quality's [open source plugins repo](https://github.com/trunk-io/plugins/tree/main)
# phpstan
Source: https://docs.trunk.io/code-quality/overview/linters/supported/phpstan
phpstan is a linter for PHP
[**phpstan**](https://phpstan.org/) is a linter for PHP.
You can enable the phpstan linter with:
```shell theme={null}
trunk check enable phpstan
```
## Auto Enabling
phpstan will never be auto-enabled. It must be enabled manually.
## Settings
phpstan supports the following config files:
* `phpstan.neon`
* `phpstan.neon.dist`
* `phpstan.dist.neon`
You can move these files to `.trunk/configs` and `trunk check` will still find them. See [Moving Linters](../configure-linters#moving-linters) for more info.
## Links
* [phpstan site](https://phpstan.org/)
* phpstan Trunk Code Quality [integration source](https://github.com/trunk-io/plugins/tree/main/linters/phpstan)
* Trunk Code Quality's [open source plugins repo](https://github.com/trunk-io/plugins/tree/main)
# pmd
Source: https://docs.trunk.io/code-quality/overview/linters/supported/pmd
pmd is a linter for Apex and Java
[**pmd**](https://pmd.github.io/) is a linter for Apex and Java.
You can enable the pmd linter with:
```shell theme={null}
trunk check enable pmd
```
![pmd example output]() ## Auto Enabling
pmd will never be auto-enabled. It must be enabled manually.
## Links
* [pmd site](https://pmd.github.io/)
* pmd Trunk Code Quality [integration source](https://github.com/trunk-io/plugins/tree/main/linters/pmd)
* Trunk Code Quality's [open source plugins repo](https://github.com/trunk-io/plugins/tree/main)
# pragma-once
Source: https://docs.trunk.io/code-quality/overview/linters/supported/pragma-once
pragma-once is a linter for C, C++
[**pragma-once**](https://github.com/trunk-io/plugins/blob/main/linters/pragma-once/README.md) is a linter for C, C++.
You can enable the pragma-once linter with:
```shell theme={null}
trunk check enable pragma-once
```
## Auto Enabling
pmd will never be auto-enabled. It must be enabled manually.
## Links
* [pmd site](https://pmd.github.io/)
* pmd Trunk Code Quality [integration source](https://github.com/trunk-io/plugins/tree/main/linters/pmd)
* Trunk Code Quality's [open source plugins repo](https://github.com/trunk-io/plugins/tree/main)
# pragma-once
Source: https://docs.trunk.io/code-quality/overview/linters/supported/pragma-once
pragma-once is a linter for C, C++
[**pragma-once**](https://github.com/trunk-io/plugins/blob/main/linters/pragma-once/README.md) is a linter for C, C++.
You can enable the pragma-once linter with:
```shell theme={null}
trunk check enable pragma-once
```
![pragma-once example output]() ## Auto Enabling
pragma-once will never be auto-enabled. It must be enabled manually.
## Links
* [pragma-once site](https://github.com/trunk-io/plugins/blob/main/linters/pragma-once/README.md)
* pragma-once Trunk Code Quality [integration source](https://github.com/trunk-io/plugins/tree/main/linters/pragma-once)
* Trunk Code Quality's [open source plugins repo](https://github.com/trunk-io/plugins/tree/main)
# pre-commit-hooks
Source: https://docs.trunk.io/code-quality/overview/linters/supported/pre-commit-hooks
pre-commit-hooks is a linter for All
[**pre-commit-hooks**](https://pre-commit.com/hooks.html) is a linter for All.
You can enable the pre-commit-hooks linter with:
```shell theme={null}
trunk check enable pre-commit-hooks
```
## Auto Enabling
pre-commit-hooks will never be auto-enabled. It must be enabled manually.
## Links
* [pre-commit-hooks site](https://pre-commit.com/hooks.html)
* pre-commit-hooks Trunk Code Quality [integration source](https://github.com/trunk-io/plugins/tree/main/linters/pre-commit-hooks)
* Trunk Code Quality's [open source plugins repo](https://github.com/trunk-io/plugins/tree/main)
# Prettier
Source: https://docs.trunk.io/code-quality/overview/linters/supported/prettier
Explore Prettier, the powerful code formatter. Learn how to install, configure, and effectively use Prettier to enhance your coding workflow.
[**Prettier**](https://prettier.io/) is a formatter for CSS, SCSS, JavaScript, JSON, Markdown, TypeScript, GraphQL and YAML.
You can enable the Prettier formatter with:
```shell theme={null}
trunk check enable prettier
```
## Auto Enabling
pragma-once will never be auto-enabled. It must be enabled manually.
## Links
* [pragma-once site](https://github.com/trunk-io/plugins/blob/main/linters/pragma-once/README.md)
* pragma-once Trunk Code Quality [integration source](https://github.com/trunk-io/plugins/tree/main/linters/pragma-once)
* Trunk Code Quality's [open source plugins repo](https://github.com/trunk-io/plugins/tree/main)
# pre-commit-hooks
Source: https://docs.trunk.io/code-quality/overview/linters/supported/pre-commit-hooks
pre-commit-hooks is a linter for All
[**pre-commit-hooks**](https://pre-commit.com/hooks.html) is a linter for All.
You can enable the pre-commit-hooks linter with:
```shell theme={null}
trunk check enable pre-commit-hooks
```
## Auto Enabling
pre-commit-hooks will never be auto-enabled. It must be enabled manually.
## Links
* [pre-commit-hooks site](https://pre-commit.com/hooks.html)
* pre-commit-hooks Trunk Code Quality [integration source](https://github.com/trunk-io/plugins/tree/main/linters/pre-commit-hooks)
* Trunk Code Quality's [open source plugins repo](https://github.com/trunk-io/plugins/tree/main)
# Prettier
Source: https://docs.trunk.io/code-quality/overview/linters/supported/prettier
Explore Prettier, the powerful code formatter. Learn how to install, configure, and effectively use Prettier to enhance your coding workflow.
[**Prettier**](https://prettier.io/) is a formatter for CSS, SCSS, JavaScript, JSON, Markdown, TypeScript, GraphQL and YAML.
You can enable the Prettier formatter with:
```shell theme={null}
trunk check enable prettier
```
![prettier example output]() ## Auto Enabling
Prettier will be auto-enabled if any *TypeScript, YAML, CSS, PostCSS, Sass, HTML, Markdown, JSON, JavaScript, GraphQL or Prettier\_supported\_configs* files are present.
## Settings
Prettier supports the following config files:
* `.prettierrc`
* `.prettierrc.json`
* `.prettierrc.yml`
* `.prettierrc.yaml`
* `.prettierrc.json5`
* `.prettierrc.js`
* `.prettierrc.cjs`
* `.prettierrc.mjs`
* `prettier.config.js`
* `prettier.config.cjs`
* `prettier.config.mjs`
* `.prettierrc.toml`
* `.prettierignore`
You can move these files to `.trunk/configs` and `trunk check` will still find them. See [Moving Linters](../configure-linters#moving-linters) for more info.
## Usage Notes
By default, Trunk uses Prettier to autoformat many languages/config formats, including markdown. To line wrap within markdown, you need to set the following in your [Prettier config](https://prettier.io/docs/en/configuration.html) `.prettierrc.yaml`, etc.
```yaml theme={null}
proseWrap: always
```
You may also want to configure `printWidth` to your liking.
## Links
* [Prettier site](https://prettier.io/)
* Prettier Trunk Code Quality [integration source](https://github.com/trunk-io/plugins/tree/main/linters/prettier)
* Trunk Code Quality's [open source plugins repo](https://github.com/trunk-io/plugins/tree/main)
# prisma
Source: https://docs.trunk.io/code-quality/overview/linters/supported/prisma
prisma is a linter for Prisma
[**prisma**](https://github.com/prisma/prisma#readme) is a linter for Prisma.
You can enable the prisma linter with:
```shell theme={null}
trunk check enable prisma
```
## Auto Enabling
prisma will never be auto-enabled. It must be enabled manually.
## Links
* [prisma site](https://github.com/prisma/prisma#readme)
* prisma Trunk Code Quality [integration source](https://github.com/trunk-io/plugins/tree/main/linters/prisma)
* Trunk Code Quality's [open source plugins repo](https://github.com/trunk-io/plugins/tree/main)
# psscriptanalyzer
Source: https://docs.trunk.io/code-quality/overview/linters/supported/psscriptanalyzer
psscriptanalyzer is a linter for PowerShell
[**psscriptanalyzer**](https://github.com/PowerShell/PSScriptAnalyzer) is a linter for PowerShell.
You can enable the psscriptanalyzer linter with:
```shell theme={null}
trunk check enable psscriptanalyzer
```
## Auto Enabling
psscriptanalyzer will be auto-enabled if a `PSScriptAnalyzerSettings.psd1` config file is present.
## Settings
psscriptanalyzer supports the following config files:
* `PSScriptAnalyzerSettings.psd1`
You can move these files to `.trunk/configs` and `trunk check` will still find them. See [Moving Linters](../configure-linters#moving-linters) for more info.
## Links
* [psscriptanalyzer site](https://github.com/PowerShell/PSScriptAnalyzer)
* psscriptanalyzer Trunk Code Quality [integration source](https://github.com/trunk-io/plugins/tree/main/linters/psscriptanalyzer)
* Trunk Code Quality's [open source plugins repo](https://github.com/trunk-io/plugins/tree/main)
# Pylint
Source: https://docs.trunk.io/code-quality/overview/linters/supported/pylint
Learn about Pylint, the versatile Python linter for error detection, code smell elimination, and PEP 8 enforcement.
[**Pylint**](https://pypi.org/project/pylint/) is a linter for Python.
You can enable the Pylint linter with:
```shell theme={null}
trunk check enable pylint
```
## Auto Enabling
Prettier will be auto-enabled if any *TypeScript, YAML, CSS, PostCSS, Sass, HTML, Markdown, JSON, JavaScript, GraphQL or Prettier\_supported\_configs* files are present.
## Settings
Prettier supports the following config files:
* `.prettierrc`
* `.prettierrc.json`
* `.prettierrc.yml`
* `.prettierrc.yaml`
* `.prettierrc.json5`
* `.prettierrc.js`
* `.prettierrc.cjs`
* `.prettierrc.mjs`
* `prettier.config.js`
* `prettier.config.cjs`
* `prettier.config.mjs`
* `.prettierrc.toml`
* `.prettierignore`
You can move these files to `.trunk/configs` and `trunk check` will still find them. See [Moving Linters](../configure-linters#moving-linters) for more info.
## Usage Notes
By default, Trunk uses Prettier to autoformat many languages/config formats, including markdown. To line wrap within markdown, you need to set the following in your [Prettier config](https://prettier.io/docs/en/configuration.html) `.prettierrc.yaml`, etc.
```yaml theme={null}
proseWrap: always
```
You may also want to configure `printWidth` to your liking.
## Links
* [Prettier site](https://prettier.io/)
* Prettier Trunk Code Quality [integration source](https://github.com/trunk-io/plugins/tree/main/linters/prettier)
* Trunk Code Quality's [open source plugins repo](https://github.com/trunk-io/plugins/tree/main)
# prisma
Source: https://docs.trunk.io/code-quality/overview/linters/supported/prisma
prisma is a linter for Prisma
[**prisma**](https://github.com/prisma/prisma#readme) is a linter for Prisma.
You can enable the prisma linter with:
```shell theme={null}
trunk check enable prisma
```
## Auto Enabling
prisma will never be auto-enabled. It must be enabled manually.
## Links
* [prisma site](https://github.com/prisma/prisma#readme)
* prisma Trunk Code Quality [integration source](https://github.com/trunk-io/plugins/tree/main/linters/prisma)
* Trunk Code Quality's [open source plugins repo](https://github.com/trunk-io/plugins/tree/main)
# psscriptanalyzer
Source: https://docs.trunk.io/code-quality/overview/linters/supported/psscriptanalyzer
psscriptanalyzer is a linter for PowerShell
[**psscriptanalyzer**](https://github.com/PowerShell/PSScriptAnalyzer) is a linter for PowerShell.
You can enable the psscriptanalyzer linter with:
```shell theme={null}
trunk check enable psscriptanalyzer
```
## Auto Enabling
psscriptanalyzer will be auto-enabled if a `PSScriptAnalyzerSettings.psd1` config file is present.
## Settings
psscriptanalyzer supports the following config files:
* `PSScriptAnalyzerSettings.psd1`
You can move these files to `.trunk/configs` and `trunk check` will still find them. See [Moving Linters](../configure-linters#moving-linters) for more info.
## Links
* [psscriptanalyzer site](https://github.com/PowerShell/PSScriptAnalyzer)
* psscriptanalyzer Trunk Code Quality [integration source](https://github.com/trunk-io/plugins/tree/main/linters/psscriptanalyzer)
* Trunk Code Quality's [open source plugins repo](https://github.com/trunk-io/plugins/tree/main)
# Pylint
Source: https://docs.trunk.io/code-quality/overview/linters/supported/pylint
Learn about Pylint, the versatile Python linter for error detection, code smell elimination, and PEP 8 enforcement.
[**Pylint**](https://pypi.org/project/pylint/) is a linter for Python.
You can enable the Pylint linter with:
```shell theme={null}
trunk check enable pylint
```
![pylint example output]() ## Auto Enabling
Pylint will be auto-enabled if any of its config files are present: *`pylintrc`, `.pylintrc`*.
## Settings
Pylint supports the following config files:
* `pylintrc`
* `.pylintrc`
You can move these files to `.trunk/configs` and `trunk check` will still find them. See [Moving Linters](../configure-linters#moving-linters) for more info.
## Usage Notes
You may specify additional pylint plugins in your `.pylintrc`, using the line `load-plugins=...`
If you want to run the plugin `pylint-django` as part of your setup, you would add the line `load-plugins=pylint_django` to your `.pylintrc`, but you **also** need to tell trunk to install the package:
```yaml theme={null}
- pylint@2.11.0:
packages:
- pylint-django@2.4.4
```
## Links
* [Pylint site](https://pypi.org/project/pylint/)
* Pylint Trunk Code Quality [integration source](https://github.com/trunk-io/plugins/tree/main/linters/pylint)
* Trunk Code Quality's [open source plugins repo](https://github.com/trunk-io/plugins/tree/main)
# pyright
Source: https://docs.trunk.io/code-quality/overview/linters/supported/pyright
pyright is a linter for Python
[**pyright**](https://github.com/microsoft/pyright) is a linter for Python.
You can enable the pyright linter with:
```shell theme={null}
trunk check enable pyright
```
## Auto Enabling
pyright will be auto-enabled if a `pyrightconfig.json` config file is present.
## Settings
pyright supports the following config files:
* `pyrightconfig.json`
You can move these files to `.trunk/configs` and `trunk check` will still find them. See [Moving Linters](../configure-linters#moving-linters) for more info.
## Links
* [pyright site](https://github.com/microsoft/pyright)
* pyright Trunk Code Quality [integration source](https://github.com/trunk-io/plugins/tree/main/linters/pyright)
* Trunk Code Quality's [open source plugins repo](https://github.com/trunk-io/plugins/tree/main)
# regal
Source: https://docs.trunk.io/code-quality/overview/linters/supported/regal
regal is a linter for Rego
[**regal**](https://github.com/StyraInc/regal) is a linter for Rego.
You can enable the regal linter with:
```shell theme={null}
trunk check enable regal
```
## Auto Enabling
regal will be auto-enabled if a `.regal/config.yaml` config file is present.
## Settings
regal supports the following config files:
* `.regal/config.yaml`
Unlike with most tools under `trunk check`, these files cannot be moved.
## Links
* [regal site](https://github.com/StyraInc/regal)
* regal Trunk Code Quality [integration source](https://github.com/trunk-io/plugins/tree/main/linters/regal)
* Trunk Code Quality's [open source plugins repo](https://github.com/trunk-io/plugins/tree/main)
# remark-lint
Source: https://docs.trunk.io/code-quality/overview/linters/supported/remark-lint
remark-lint is a linter for Markdown
[**remark-lint**](https://github.com/remarkjs/remark-lint#readme) is a linter for Markdown.
You can enable the remark-lint linter with:
```shell theme={null}
trunk check enable remark-lint
```
## Auto Enabling
remark-lint will be auto-enabled if any of its config files are present: *`.remarkrc`, `.remarkrc.json`, `.remarkrc.cjs`*.
## Settings
remark-lint supports the following config files:
* `.remarkrc`
* `.remarkrc.json`
* `.remarkrc.cjs`
* `.remarkrc.mjs`
* `.remarkrc.js`
* `.remarkrc.yaml`
* `.remarkrc.yml`
You can move these files to `.trunk/configs` and `trunk check` will still find them. See [Moving Linters](../configure-linters#moving-linters) for more info. Trunk Code Quality provides a default `.remarkrc.yaml` if your project does not already have one.
## Links
* [remark-lint site](https://github.com/remarkjs/remark-lint#readme)
* remark-lint Trunk Code Quality [integration source](https://github.com/trunk-io/plugins/tree/main/linters/remark-lint)
* Trunk Code Quality's [open source plugins repo](https://github.com/trunk-io/plugins/tree/main)
# renovate
Source: https://docs.trunk.io/code-quality/overview/linters/supported/renovate
renovate is a linter for Renovate
[**renovate**](https://github.com/renovatebot/renovate#readme) is a linter for Renovate.
You can enable the renovate linter with:
```shell theme={null}
trunk check enable renovate
```
## Auto Enabling
renovate will be auto-enabled if any of its config files are present: *`renovate.json`, `renovate.json5`, `.github/renovate.json`*.
## Settings
renovate supports the following config files:
* `renovate.json`
* `renovate.json5`
* `.github/renovate.json`
* `.github/renovate.json5`
* `.gitlab/renovate.json`
* `.gitlab/renovate.json5`
* `.renovaterc`
* `.renovaterc.json`
* `.renovaterc.json5`
Unlike with most tools under `trunk check`, these files cannot be moved.
## Links
* [renovate site](https://github.com/renovatebot/renovate#readme)
* renovate Trunk Code Quality [integration source](https://github.com/trunk-io/plugins/tree/main/linters/renovate)
* Trunk Code Quality's [open source plugins repo](https://github.com/trunk-io/plugins/tree/main)
# rome
Source: https://docs.trunk.io/code-quality/overview/linters/supported/rome
rome is a linter for JavaScript and TypeScript
[**rome**](https://github.com/rome/tools#readme) is a linter for JavaScript and TypeScript.
You can enable the rome linter with:
```shell theme={null}
trunk check enable rome
```
## Auto Enabling
rome will never be auto-enabled. It must be enabled manually.
## Settings
rome supports the following config files:
* `rome.json`
You can move these files to `.trunk/configs` and `trunk check` will still find them. See [Moving Linters](../configure-linters#moving-linters) for more info.
## Links
* [rome site](https://github.com/rome/tools#readme)
* rome Trunk Code Quality [integration source](https://github.com/trunk-io/plugins/tree/main/linters/rome)
* Trunk Code Quality's [open source plugins repo](https://github.com/trunk-io/plugins/tree/main)
# rubocop
Source: https://docs.trunk.io/code-quality/overview/linters/supported/rubocop
rubocop is a linter for Ruby
[**rubocop**](https://github.com/rubocop/rubocop#readme) is a linter for Ruby.
You can enable the rubocop linter with:
```shell theme={null}
trunk check enable rubocop
```
## Auto Enabling
rubocop will be auto-enabled if a `.rubocop.yml` config file is present.
## Settings
rubocop supports the following config files:
* `.rubocop.yml`
You can move these files to `.trunk/configs` and `trunk check` will still find them. See [Moving Linters](../configure-linters#moving-linters) for more info.
## Links
* [rubocop site](https://github.com/rubocop/rubocop#readme)
* rubocop Trunk Code Quality [integration source](https://github.com/trunk-io/plugins/tree/main/linters/rubocop)
* Trunk Code Quality's [open source plugins repo](https://github.com/trunk-io/plugins/tree/main)
# Ruff
Source: https://docs.trunk.io/code-quality/overview/linters/supported/ruff
Discover Ruff, a speedy Python linter for large codebases. Integrates with CI/IDEs and supports .py, .pyi, and Jupyter Notebooks.
[**Ruff**](https://github.com/astral-sh/ruff) is a linter for Python.
ruff is composed of several linter commands.
`ruff` is for formatting general python code.
You can enable the `ruff` linter with:
```shell theme={null}
trunk check enable ruff
```
`ruff-nbqa` is for extra support for Jupyter notebooks.
You can enable the `ruff-nbqa` linter with:
```shell theme={null}
trunk check enable ruff-nbqa
```
## Auto Enabling
Ruff will be auto-enabled if any *Python, Python-interface, Jupyter, Python, Python-interface, Python, Python-interface, Python, Python-interface, Python or Python-interface* files are present.
## Settings
Ruff supports the following config files:
* `ruff.toml`
You can move these files to `.trunk/configs` and `trunk check` will still find them. See [Moving Linters](../configure-linters#moving-linters) for more info. Trunk Code Quality provides a default `ruff.toml` if your project does not already have one.
## Links
* [Ruff site](https://github.com/astral-sh/ruff)
* Ruff Trunk Code Quality [integration source](https://github.com/trunk-io/plugins/tree/main/linters/ruff)
* Trunk Code Quality's [open source plugins repo](https://github.com/trunk-io/plugins/tree/main)
# rufo
Source: https://docs.trunk.io/code-quality/overview/linters/supported/rufo
rufo is a linter for Ruby
[**rufo**](https://github.com/ruby-formatter/rufo#readme) is a linter for Ruby.
You can enable the rufo linter with:
```shell theme={null}
trunk check enable rufo
```
## Auto Enabling
rufo will be auto-enabled if a `.rufo` config file is present.
## Settings
rufo supports the following config files:
* `.rufo`
You can move these files to `.trunk/configs` and `trunk check` will still find them. See [Moving Linters](../configure-linters#moving-linters) for more info.
## Links
* [rufo site](https://github.com/ruby-formatter/rufo#readme)
* rufo Trunk Code Quality [integration source](https://github.com/trunk-io/plugins/tree/main/linters/rufo)
* Trunk Code Quality's [open source plugins repo](https://github.com/trunk-io/plugins/tree/main)
# rustfmt
Source: https://docs.trunk.io/code-quality/overview/linters/supported/rustfmt
Rustfmt is a code formatting tool for Rust that helps ensure your code adheres to the community-driven coding standards and style guidelines.
[**rustfmt**](https://github.com/rust-lang/rustfmt) is a formatter for Rust.
You can enable the rustfmt formatter with:
```shell theme={null}
trunk check enable rustfmt
```
## Auto Enabling
rustfmt will be auto-enabled if any *Rust* files are present.
## Settings
rustfmt supports the following config files:
* `rustfmt.toml`
* `.rustfmt.toml`
You can move these files to `.trunk/configs` and `trunk check` will still find them. See [Moving Linters](../configure-linters#moving-linters) for more info. Trunk Code Quality provides a default `.rustfmt.toml` if your project does not already have one.
## Usage Notes
We currently use the version of `rustfmt` packaged with rust, so for `rustfmt` version, specify your Rust version (for example `rustfmt@1.61.0`).
If you have `edition` in your `cargo.toml`, `rustfmt` also needs the same information in `.rustfmt.toml` in your repo root. For example, your `.rustfmt.toml` might contain:
```toml theme={null}
edition = "2021"
```
## Links
* [rustfmt site](https://github.com/rust-lang/rustfmt)
* rustfmt Trunk Code Quality [integration source](https://github.com/trunk-io/plugins/tree/main/linters/rustfmt)
* Trunk Code Quality's [open source plugins repo](https://github.com/trunk-io/plugins/tree/main)
# scalafmt
Source: https://docs.trunk.io/code-quality/overview/linters/supported/scalafmt
scalafmt is a linter for Scala
[**scalafmt**](https://github.com/scalameta/scalafmt#readme) is a linter for Scala.
You can enable the scalafmt linter with:
```shell theme={null}
trunk check enable scalafmt
```
## Auto Enabling
scalafmt will be auto-enabled if a `.scalafmt.conf` config file is present.
## Settings
scalafmt supports the following config files:
* `.scalafmt.conf`
You can move these files to `.trunk/configs` and `trunk check` will still find them. See [Moving Linters](../configure-linters#moving-linters) for more info.
## Links
* [scalafmt site](https://github.com/scalameta/scalafmt#readme)
* scalafmt Trunk Code Quality [integration source](https://github.com/trunk-io/plugins/tree/main/linters/scalafmt)
* Trunk Code Quality's [open source plugins repo](https://github.com/trunk-io/plugins/tree/main)
# semgrep
Source: https://docs.trunk.io/code-quality/overview/linters/supported/semgrep
semgrep is a linter for Go, Java, JavaScript, JSON, Python, Ruby, TypeScript and YAML
[**semgrep**](https://github.com/returntocorp/semgrep#readme) is a linter for Go, Java, JavaScript, JSON, Python, Ruby, TypeScript and YAML.
You can enable the semgrep linter with:
```shell theme={null}
trunk check enable semgrep
```
## Auto Enabling
semgrep will be auto-enabled if any of its config files are present: *`.semgrep.yaml`, `.semgrep.yml`*.
## Settings
semgrep supports the following config files:
* `.semgrep.yaml`
* `.semgrep.yml`
You can move these files to `.trunk/configs` and `trunk check` will still find them. See [Moving Linters](../configure-linters#moving-linters) for more info.
## Links
* [semgrep site](https://github.com/returntocorp/semgrep#readme)
* semgrep Trunk Code Quality [integration source](https://github.com/trunk-io/plugins/tree/main/linters/semgrep)
* Trunk Code Quality's [open source plugins repo](https://github.com/trunk-io/plugins/tree/main)
# ShellCheck
Source: https://docs.trunk.io/code-quality/overview/linters/supported/shellcheck
ShellCheck is a static analysis tool designed to identify and report syntax errors and potential issues in shell scripts
[**ShellCheck**](https://www.shellcheck.net/) is a linter for Bash.
You can enable the ShellCheck linter with:
```shell theme={null}
trunk check enable shellcheck
```
## Auto Enabling
Pylint will be auto-enabled if any of its config files are present: *`pylintrc`, `.pylintrc`*.
## Settings
Pylint supports the following config files:
* `pylintrc`
* `.pylintrc`
You can move these files to `.trunk/configs` and `trunk check` will still find them. See [Moving Linters](../configure-linters#moving-linters) for more info.
## Usage Notes
You may specify additional pylint plugins in your `.pylintrc`, using the line `load-plugins=...`
If you want to run the plugin `pylint-django` as part of your setup, you would add the line `load-plugins=pylint_django` to your `.pylintrc`, but you **also** need to tell trunk to install the package:
```yaml theme={null}
- pylint@2.11.0:
packages:
- pylint-django@2.4.4
```
## Links
* [Pylint site](https://pypi.org/project/pylint/)
* Pylint Trunk Code Quality [integration source](https://github.com/trunk-io/plugins/tree/main/linters/pylint)
* Trunk Code Quality's [open source plugins repo](https://github.com/trunk-io/plugins/tree/main)
# pyright
Source: https://docs.trunk.io/code-quality/overview/linters/supported/pyright
pyright is a linter for Python
[**pyright**](https://github.com/microsoft/pyright) is a linter for Python.
You can enable the pyright linter with:
```shell theme={null}
trunk check enable pyright
```
## Auto Enabling
pyright will be auto-enabled if a `pyrightconfig.json` config file is present.
## Settings
pyright supports the following config files:
* `pyrightconfig.json`
You can move these files to `.trunk/configs` and `trunk check` will still find them. See [Moving Linters](../configure-linters#moving-linters) for more info.
## Links
* [pyright site](https://github.com/microsoft/pyright)
* pyright Trunk Code Quality [integration source](https://github.com/trunk-io/plugins/tree/main/linters/pyright)
* Trunk Code Quality's [open source plugins repo](https://github.com/trunk-io/plugins/tree/main)
# regal
Source: https://docs.trunk.io/code-quality/overview/linters/supported/regal
regal is a linter for Rego
[**regal**](https://github.com/StyraInc/regal) is a linter for Rego.
You can enable the regal linter with:
```shell theme={null}
trunk check enable regal
```
## Auto Enabling
regal will be auto-enabled if a `.regal/config.yaml` config file is present.
## Settings
regal supports the following config files:
* `.regal/config.yaml`
Unlike with most tools under `trunk check`, these files cannot be moved.
## Links
* [regal site](https://github.com/StyraInc/regal)
* regal Trunk Code Quality [integration source](https://github.com/trunk-io/plugins/tree/main/linters/regal)
* Trunk Code Quality's [open source plugins repo](https://github.com/trunk-io/plugins/tree/main)
# remark-lint
Source: https://docs.trunk.io/code-quality/overview/linters/supported/remark-lint
remark-lint is a linter for Markdown
[**remark-lint**](https://github.com/remarkjs/remark-lint#readme) is a linter for Markdown.
You can enable the remark-lint linter with:
```shell theme={null}
trunk check enable remark-lint
```
## Auto Enabling
remark-lint will be auto-enabled if any of its config files are present: *`.remarkrc`, `.remarkrc.json`, `.remarkrc.cjs`*.
## Settings
remark-lint supports the following config files:
* `.remarkrc`
* `.remarkrc.json`
* `.remarkrc.cjs`
* `.remarkrc.mjs`
* `.remarkrc.js`
* `.remarkrc.yaml`
* `.remarkrc.yml`
You can move these files to `.trunk/configs` and `trunk check` will still find them. See [Moving Linters](../configure-linters#moving-linters) for more info. Trunk Code Quality provides a default `.remarkrc.yaml` if your project does not already have one.
## Links
* [remark-lint site](https://github.com/remarkjs/remark-lint#readme)
* remark-lint Trunk Code Quality [integration source](https://github.com/trunk-io/plugins/tree/main/linters/remark-lint)
* Trunk Code Quality's [open source plugins repo](https://github.com/trunk-io/plugins/tree/main)
# renovate
Source: https://docs.trunk.io/code-quality/overview/linters/supported/renovate
renovate is a linter for Renovate
[**renovate**](https://github.com/renovatebot/renovate#readme) is a linter for Renovate.
You can enable the renovate linter with:
```shell theme={null}
trunk check enable renovate
```
## Auto Enabling
renovate will be auto-enabled if any of its config files are present: *`renovate.json`, `renovate.json5`, `.github/renovate.json`*.
## Settings
renovate supports the following config files:
* `renovate.json`
* `renovate.json5`
* `.github/renovate.json`
* `.github/renovate.json5`
* `.gitlab/renovate.json`
* `.gitlab/renovate.json5`
* `.renovaterc`
* `.renovaterc.json`
* `.renovaterc.json5`
Unlike with most tools under `trunk check`, these files cannot be moved.
## Links
* [renovate site](https://github.com/renovatebot/renovate#readme)
* renovate Trunk Code Quality [integration source](https://github.com/trunk-io/plugins/tree/main/linters/renovate)
* Trunk Code Quality's [open source plugins repo](https://github.com/trunk-io/plugins/tree/main)
# rome
Source: https://docs.trunk.io/code-quality/overview/linters/supported/rome
rome is a linter for JavaScript and TypeScript
[**rome**](https://github.com/rome/tools#readme) is a linter for JavaScript and TypeScript.
You can enable the rome linter with:
```shell theme={null}
trunk check enable rome
```
## Auto Enabling
rome will never be auto-enabled. It must be enabled manually.
## Settings
rome supports the following config files:
* `rome.json`
You can move these files to `.trunk/configs` and `trunk check` will still find them. See [Moving Linters](../configure-linters#moving-linters) for more info.
## Links
* [rome site](https://github.com/rome/tools#readme)
* rome Trunk Code Quality [integration source](https://github.com/trunk-io/plugins/tree/main/linters/rome)
* Trunk Code Quality's [open source plugins repo](https://github.com/trunk-io/plugins/tree/main)
# rubocop
Source: https://docs.trunk.io/code-quality/overview/linters/supported/rubocop
rubocop is a linter for Ruby
[**rubocop**](https://github.com/rubocop/rubocop#readme) is a linter for Ruby.
You can enable the rubocop linter with:
```shell theme={null}
trunk check enable rubocop
```
## Auto Enabling
rubocop will be auto-enabled if a `.rubocop.yml` config file is present.
## Settings
rubocop supports the following config files:
* `.rubocop.yml`
You can move these files to `.trunk/configs` and `trunk check` will still find them. See [Moving Linters](../configure-linters#moving-linters) for more info.
## Links
* [rubocop site](https://github.com/rubocop/rubocop#readme)
* rubocop Trunk Code Quality [integration source](https://github.com/trunk-io/plugins/tree/main/linters/rubocop)
* Trunk Code Quality's [open source plugins repo](https://github.com/trunk-io/plugins/tree/main)
# Ruff
Source: https://docs.trunk.io/code-quality/overview/linters/supported/ruff
Discover Ruff, a speedy Python linter for large codebases. Integrates with CI/IDEs and supports .py, .pyi, and Jupyter Notebooks.
[**Ruff**](https://github.com/astral-sh/ruff) is a linter for Python.
ruff is composed of several linter commands.
`ruff` is for formatting general python code.
You can enable the `ruff` linter with:
```shell theme={null}
trunk check enable ruff
```
`ruff-nbqa` is for extra support for Jupyter notebooks.
You can enable the `ruff-nbqa` linter with:
```shell theme={null}
trunk check enable ruff-nbqa
```
## Auto Enabling
Ruff will be auto-enabled if any *Python, Python-interface, Jupyter, Python, Python-interface, Python, Python-interface, Python, Python-interface, Python or Python-interface* files are present.
## Settings
Ruff supports the following config files:
* `ruff.toml`
You can move these files to `.trunk/configs` and `trunk check` will still find them. See [Moving Linters](../configure-linters#moving-linters) for more info. Trunk Code Quality provides a default `ruff.toml` if your project does not already have one.
## Links
* [Ruff site](https://github.com/astral-sh/ruff)
* Ruff Trunk Code Quality [integration source](https://github.com/trunk-io/plugins/tree/main/linters/ruff)
* Trunk Code Quality's [open source plugins repo](https://github.com/trunk-io/plugins/tree/main)
# rufo
Source: https://docs.trunk.io/code-quality/overview/linters/supported/rufo
rufo is a linter for Ruby
[**rufo**](https://github.com/ruby-formatter/rufo#readme) is a linter for Ruby.
You can enable the rufo linter with:
```shell theme={null}
trunk check enable rufo
```
## Auto Enabling
rufo will be auto-enabled if a `.rufo` config file is present.
## Settings
rufo supports the following config files:
* `.rufo`
You can move these files to `.trunk/configs` and `trunk check` will still find them. See [Moving Linters](../configure-linters#moving-linters) for more info.
## Links
* [rufo site](https://github.com/ruby-formatter/rufo#readme)
* rufo Trunk Code Quality [integration source](https://github.com/trunk-io/plugins/tree/main/linters/rufo)
* Trunk Code Quality's [open source plugins repo](https://github.com/trunk-io/plugins/tree/main)
# rustfmt
Source: https://docs.trunk.io/code-quality/overview/linters/supported/rustfmt
Rustfmt is a code formatting tool for Rust that helps ensure your code adheres to the community-driven coding standards and style guidelines.
[**rustfmt**](https://github.com/rust-lang/rustfmt) is a formatter for Rust.
You can enable the rustfmt formatter with:
```shell theme={null}
trunk check enable rustfmt
```
## Auto Enabling
rustfmt will be auto-enabled if any *Rust* files are present.
## Settings
rustfmt supports the following config files:
* `rustfmt.toml`
* `.rustfmt.toml`
You can move these files to `.trunk/configs` and `trunk check` will still find them. See [Moving Linters](../configure-linters#moving-linters) for more info. Trunk Code Quality provides a default `.rustfmt.toml` if your project does not already have one.
## Usage Notes
We currently use the version of `rustfmt` packaged with rust, so for `rustfmt` version, specify your Rust version (for example `rustfmt@1.61.0`).
If you have `edition` in your `cargo.toml`, `rustfmt` also needs the same information in `.rustfmt.toml` in your repo root. For example, your `.rustfmt.toml` might contain:
```toml theme={null}
edition = "2021"
```
## Links
* [rustfmt site](https://github.com/rust-lang/rustfmt)
* rustfmt Trunk Code Quality [integration source](https://github.com/trunk-io/plugins/tree/main/linters/rustfmt)
* Trunk Code Quality's [open source plugins repo](https://github.com/trunk-io/plugins/tree/main)
# scalafmt
Source: https://docs.trunk.io/code-quality/overview/linters/supported/scalafmt
scalafmt is a linter for Scala
[**scalafmt**](https://github.com/scalameta/scalafmt#readme) is a linter for Scala.
You can enable the scalafmt linter with:
```shell theme={null}
trunk check enable scalafmt
```
## Auto Enabling
scalafmt will be auto-enabled if a `.scalafmt.conf` config file is present.
## Settings
scalafmt supports the following config files:
* `.scalafmt.conf`
You can move these files to `.trunk/configs` and `trunk check` will still find them. See [Moving Linters](../configure-linters#moving-linters) for more info.
## Links
* [scalafmt site](https://github.com/scalameta/scalafmt#readme)
* scalafmt Trunk Code Quality [integration source](https://github.com/trunk-io/plugins/tree/main/linters/scalafmt)
* Trunk Code Quality's [open source plugins repo](https://github.com/trunk-io/plugins/tree/main)
# semgrep
Source: https://docs.trunk.io/code-quality/overview/linters/supported/semgrep
semgrep is a linter for Go, Java, JavaScript, JSON, Python, Ruby, TypeScript and YAML
[**semgrep**](https://github.com/returntocorp/semgrep#readme) is a linter for Go, Java, JavaScript, JSON, Python, Ruby, TypeScript and YAML.
You can enable the semgrep linter with:
```shell theme={null}
trunk check enable semgrep
```
## Auto Enabling
semgrep will be auto-enabled if any of its config files are present: *`.semgrep.yaml`, `.semgrep.yml`*.
## Settings
semgrep supports the following config files:
* `.semgrep.yaml`
* `.semgrep.yml`
You can move these files to `.trunk/configs` and `trunk check` will still find them. See [Moving Linters](../configure-linters#moving-linters) for more info.
## Links
* [semgrep site](https://github.com/returntocorp/semgrep#readme)
* semgrep Trunk Code Quality [integration source](https://github.com/trunk-io/plugins/tree/main/linters/semgrep)
* Trunk Code Quality's [open source plugins repo](https://github.com/trunk-io/plugins/tree/main)
# ShellCheck
Source: https://docs.trunk.io/code-quality/overview/linters/supported/shellcheck
ShellCheck is a static analysis tool designed to identify and report syntax errors and potential issues in shell scripts
[**ShellCheck**](https://www.shellcheck.net/) is a linter for Bash.
You can enable the ShellCheck linter with:
```shell theme={null}
trunk check enable shellcheck
```
![shellcheck example output]() ## Auto Enabling
ShellCheck will be auto-enabled if any *Shell* files are present.
## Settings
ShellCheck supports the following config files:
* `.shellcheckrc`
* `shellcheckrc`
You can move these files to `.trunk/configs` and `trunk check` will still find them. See [Moving Linters](../configure-linters#moving-linters) for more info. Trunk Code Quality provides a default `.shellcheckrc` if your project does not already have one.
## Links
* [ShellCheck site](https://www.shellcheck.net/)
* ShellCheck Trunk Code Quality [integration source](https://github.com/trunk-io/plugins/tree/main/linters/shellcheck)
* Trunk Code Quality's [open source plugins repo](https://github.com/trunk-io/plugins/tree/main)
# shfmt
Source: https://docs.trunk.io/code-quality/overview/linters/supported/shfmt
shfmt is a linter for Bash
[**shfmt**](https://github.com/mvdan/sh#readme) is a linter for Bash.
You can enable the shfmt linter with:
```shell theme={null}
trunk check enable shfmt
```
## Auto Enabling
shfmt will be auto-enabled if any *Shell* files are present.
## Links
* [shfmt site](https://github.com/mvdan/sh#readme)
* shfmt Trunk Code Quality [integration source](https://github.com/trunk-io/plugins/tree/main/linters/shfmt)
* Trunk Code Quality's [open source plugins repo](https://github.com/trunk-io/plugins/tree/main)
# sort-package-json
Source: https://docs.trunk.io/code-quality/overview/linters/supported/sort-package-json
sort-package-json is a linter for package.json
[**sort-package-json**](https://github.com/keithamus/sort-package-json#readme) is a linter for package.json.
You can enable the sort-package-json linter with:
```shell theme={null}
trunk check enable sort-package-json
```
## Auto Enabling
sort-package-json will never be auto-enabled. It must be enabled manually.
## Links
* [sort-package-json site](https://github.com/keithamus/sort-package-json#readme)
* sort-package-json Trunk Code Quality [integration source](https://github.com/trunk-io/plugins/tree/main/linters/sort-package-json)
* Trunk Code Quality's [open source plugins repo](https://github.com/trunk-io/plugins/tree/main)
# sourcery
Source: https://docs.trunk.io/code-quality/overview/linters/supported/sourcery
sourcery is a linter for Python
[**sourcery**](https://sourcery.ai/) is a linter for Python.
You can enable the sourcery linter with:
```shell theme={null}
trunk check enable sourcery
```
## Auto Enabling
sourcery will never be auto-enabled. It must be enabled manually.
## Settings
sourcery supports the following config files:
* `.sourcery.yaml`
* `sourcery.yaml`
You can move these files to `.trunk/configs` and `trunk check` will still find them. See [Moving Linters](../configure-linters#moving-linters) for more info.
## Links
* [sourcery site](https://sourcery.ai/)
* sourcery Trunk Code Quality [integration source](https://github.com/trunk-io/plugins/tree/main/linters/sourcery)
* Trunk Code Quality's [open source plugins repo](https://github.com/trunk-io/plugins/tree/main)
# sql-formatter
Source: https://docs.trunk.io/code-quality/overview/linters/supported/sql-formatter
sql-formatter is a linter for SQL
[**sql-formatter**](https://github.com/sql-formatter-org/sql-formatter#readme) is a linter for SQL.
You can enable the sql-formatter linter with:
```shell theme={null}
trunk check enable sql-formatter
```
## Auto Enabling
sql-formatter will never be auto-enabled. It must be enabled manually.
## Links
* [sql-formatter site](https://github.com/sql-formatter-org/sql-formatter#readme)
* sql-formatter Trunk Code Quality [integration source](https://github.com/trunk-io/plugins/tree/main/linters/sql-formatter)
* Trunk Code Quality's [open source plugins repo](https://github.com/trunk-io/plugins/tree/main)
# SQLFluff
Source: https://docs.trunk.io/code-quality/overview/linters/supported/sqlfluff
SQLFluff is a dialect-flexible and configurable SQL linter.
[**SQLFluff**](https://github.com/sqlfluff/sqlfluff) is a linter for SQL.
You can enable the SQLFluff linter with:
```shell theme={null}
trunk check enable sqlfluff
```
## Auto Enabling
SQLFluff will be auto-enabled if a `.sqlfluff` config file is present.
## Settings
SQLFluff supports the following config files:
* `.sqlfluff`
You can move these files to `.trunk/configs` and `trunk check` will still find them. See [Moving Linters](../configure-linters#moving-linters) for more info. Trunk Code Quality provides a default `.sqlfluff` if your project does not already have one.
## Usage Notes
Sqlfluff is only configured as a linter by default because its formatting capabilities are limited. To turn sqlfluff formatting on, enable its subcommand:
```yaml theme={null}
lint:
enabled:
- sqlfluff@
## Auto Enabling
ShellCheck will be auto-enabled if any *Shell* files are present.
## Settings
ShellCheck supports the following config files:
* `.shellcheckrc`
* `shellcheckrc`
You can move these files to `.trunk/configs` and `trunk check` will still find them. See [Moving Linters](../configure-linters#moving-linters) for more info. Trunk Code Quality provides a default `.shellcheckrc` if your project does not already have one.
## Links
* [ShellCheck site](https://www.shellcheck.net/)
* ShellCheck Trunk Code Quality [integration source](https://github.com/trunk-io/plugins/tree/main/linters/shellcheck)
* Trunk Code Quality's [open source plugins repo](https://github.com/trunk-io/plugins/tree/main)
# shfmt
Source: https://docs.trunk.io/code-quality/overview/linters/supported/shfmt
shfmt is a linter for Bash
[**shfmt**](https://github.com/mvdan/sh#readme) is a linter for Bash.
You can enable the shfmt linter with:
```shell theme={null}
trunk check enable shfmt
```
## Auto Enabling
shfmt will be auto-enabled if any *Shell* files are present.
## Links
* [shfmt site](https://github.com/mvdan/sh#readme)
* shfmt Trunk Code Quality [integration source](https://github.com/trunk-io/plugins/tree/main/linters/shfmt)
* Trunk Code Quality's [open source plugins repo](https://github.com/trunk-io/plugins/tree/main)
# sort-package-json
Source: https://docs.trunk.io/code-quality/overview/linters/supported/sort-package-json
sort-package-json is a linter for package.json
[**sort-package-json**](https://github.com/keithamus/sort-package-json#readme) is a linter for package.json.
You can enable the sort-package-json linter with:
```shell theme={null}
trunk check enable sort-package-json
```
## Auto Enabling
sort-package-json will never be auto-enabled. It must be enabled manually.
## Links
* [sort-package-json site](https://github.com/keithamus/sort-package-json#readme)
* sort-package-json Trunk Code Quality [integration source](https://github.com/trunk-io/plugins/tree/main/linters/sort-package-json)
* Trunk Code Quality's [open source plugins repo](https://github.com/trunk-io/plugins/tree/main)
# sourcery
Source: https://docs.trunk.io/code-quality/overview/linters/supported/sourcery
sourcery is a linter for Python
[**sourcery**](https://sourcery.ai/) is a linter for Python.
You can enable the sourcery linter with:
```shell theme={null}
trunk check enable sourcery
```
## Auto Enabling
sourcery will never be auto-enabled. It must be enabled manually.
## Settings
sourcery supports the following config files:
* `.sourcery.yaml`
* `sourcery.yaml`
You can move these files to `.trunk/configs` and `trunk check` will still find them. See [Moving Linters](../configure-linters#moving-linters) for more info.
## Links
* [sourcery site](https://sourcery.ai/)
* sourcery Trunk Code Quality [integration source](https://github.com/trunk-io/plugins/tree/main/linters/sourcery)
* Trunk Code Quality's [open source plugins repo](https://github.com/trunk-io/plugins/tree/main)
# sql-formatter
Source: https://docs.trunk.io/code-quality/overview/linters/supported/sql-formatter
sql-formatter is a linter for SQL
[**sql-formatter**](https://github.com/sql-formatter-org/sql-formatter#readme) is a linter for SQL.
You can enable the sql-formatter linter with:
```shell theme={null}
trunk check enable sql-formatter
```
## Auto Enabling
sql-formatter will never be auto-enabled. It must be enabled manually.
## Links
* [sql-formatter site](https://github.com/sql-formatter-org/sql-formatter#readme)
* sql-formatter Trunk Code Quality [integration source](https://github.com/trunk-io/plugins/tree/main/linters/sql-formatter)
* Trunk Code Quality's [open source plugins repo](https://github.com/trunk-io/plugins/tree/main)
# SQLFluff
Source: https://docs.trunk.io/code-quality/overview/linters/supported/sqlfluff
SQLFluff is a dialect-flexible and configurable SQL linter.
[**SQLFluff**](https://github.com/sqlfluff/sqlfluff) is a linter for SQL.
You can enable the SQLFluff linter with:
```shell theme={null}
trunk check enable sqlfluff
```
## Auto Enabling
SQLFluff will be auto-enabled if a `.sqlfluff` config file is present.
## Settings
SQLFluff supports the following config files:
* `.sqlfluff`
You can move these files to `.trunk/configs` and `trunk check` will still find them. See [Moving Linters](../configure-linters#moving-linters) for more info. Trunk Code Quality provides a default `.sqlfluff` if your project does not already have one.
## Usage Notes
Sqlfluff is only configured as a linter by default because its formatting capabilities are limited. To turn sqlfluff formatting on, enable its subcommand:
```yaml theme={null}
lint:
enabled:
- sqlfluff@:
commands: [lint, fix]
```
## Links
* [SQLFluff site](https://github.com/sqlfluff/sqlfluff)
* SQLFluff Trunk Code Quality [integration source](https://github.com/trunk-io/plugins/tree/main/linters/sqlfluff)
* Trunk Code Quality's [open source plugins repo](https://github.com/trunk-io/plugins/tree/main)
# sqlfmt
Source: https://docs.trunk.io/code-quality/overview/linters/supported/sqlfmt
sqlfmt is a linter for SQL
[**sqlfmt**](https://github.com/tconbeer/sqlfmt#readme) is a linter for SQL.
You can enable the sqlfmt linter with:
```shell theme={null}
trunk check enable sqlfmt
```
## Auto Enabling
sqlfmt will never be auto-enabled. It must be enabled manually.
## Links
* [sqlfmt site](https://github.com/tconbeer/sqlfmt#readme)
* sqlfmt Trunk Code Quality [integration source](https://github.com/trunk-io/plugins/tree/main/linters/sqlfmt)
* Trunk Code Quality's [open source plugins repo](https://github.com/trunk-io/plugins/tree/main)
# Squawk
Source: https://docs.trunk.io/code-quality/overview/linters/supported/squawk
squawk is a linter for SQL
[**Squawk**](https://github.com/sbdchd/squawk) is a linter for SQL.
You can enable the Squawk linter with:
```shell theme={null}
trunk check enable squawk
```
## Auto Enabling
Squawk will be auto-enabled if a `.squawk.toml` config file is present.
## Settings
Squawk supports the following config files:
* `.squawk.toml`
You can move these files to `.trunk/configs` and `trunk check` will still find them. See [Moving Linters](../configure-linters#moving-linters) for more info.
## Links
* [Squawk site](https://github.com/sbdchd/squawk)
* Squawk Trunk Code Quality [integration source](https://github.com/trunk-io/plugins/tree/main/linters/squawk)
* Trunk Code Quality's [open source plugins repo](https://github.com/trunk-io/plugins/tree/main)
# standardrb
Source: https://docs.trunk.io/code-quality/overview/linters/supported/standardrb
standardrb is a linter for Ruby
[**standardrb**](https://github.com/testdouble/standard#readme) is a linter for Ruby.
You can enable the standardrb linter with:
```shell theme={null}
trunk check enable standardrb
```
## Auto Enabling
standardrb will be auto-enabled if a `.standard.yml` config file is present.
## Settings
standardrb supports the following config files:
* `.standard.yml`
You can move these files to `.trunk/configs` and `trunk check` will still find them. See [Moving Linters](../configure-linters#moving-linters) for more info.
## Links
* [standardrb site](https://github.com/testdouble/standard#readme)
* standardrb Trunk Code Quality [integration source](https://github.com/trunk-io/plugins/tree/main/linters/standardrb)
* Trunk Code Quality's [open source plugins repo](https://github.com/trunk-io/plugins/tree/main)
# stringslint
Source: https://docs.trunk.io/code-quality/overview/linters/supported/stringslint
stringslint is a linter for Swift
[**stringslint**](https://github.com/dral3x/StringsLint#readme) is a linter for Swift.
You can enable the stringslint linter with:
```shell theme={null}
trunk check enable stringslint
```
## Auto Enabling
stringslint will be auto-enabled if any of its config files are present: *`.stringslint.yml`, `.stringslint.yaml`, `.stringslint`*.
## Settings
stringslint supports the following config files:
* `.stringslint.yml`
* `.stringslint.yaml`
* `.stringslint`
You can move these files to `.trunk/configs` and `trunk check` will still find them. See [Moving Linters](../configure-linters#moving-linters) for more info.
## Links
* [stringslint site](https://github.com/dral3x/StringsLint#readme)
* stringslint Trunk Code Quality [integration source](https://github.com/trunk-io/plugins/tree/main/linters/stringslint)
* Trunk Code Quality's [open source plugins repo](https://github.com/trunk-io/plugins/tree/main)
# stylelint
Source: https://docs.trunk.io/code-quality/overview/linters/supported/stylelint
stylelint is a linter for CSS, SCSS
[**stylelint**](https://github.com/stylelint/stylelint#readme) is a linter for CSS, SCSS.
You can enable the stylelint linter with:
```shell theme={null}
trunk check enable stylelint
```
## Auto Enabling
stylelint will be auto-enabled if any of its config files are present: *`stylelint.config.js`, `.stylelintrc.js`, `stylelint.config.mjs`*.
## Settings
stylelint supports the following config files:
* `stylelint.config.js`
* `.stylelintrc.js`
* `stylelint.config.mjs`
* `.stylelintrc.mjs`
* `stylelint.config.cjs`
* `.stylelintrc.cjs`
* `.stylelintrc.json`
* `.stylelintrc.yml`
* `.stylelintrc.yaml`
* `.stylelintrc`
You can move these files to `.trunk/configs` and `trunk check` will still find them. See [Moving Linters](../configure-linters#moving-linters) for more info.
## Links
* [stylelint site](https://github.com/stylelint/stylelint#readme)
* stylelint Trunk Code Quality [integration source](https://github.com/trunk-io/plugins/tree/main/linters/stylelint)
* Trunk Code Quality's [open source plugins repo](https://github.com/trunk-io/plugins/tree/main)
# stylua
Source: https://docs.trunk.io/code-quality/overview/linters/supported/stylua
stylua is a linter for Lua
[**stylua**](https://github.com/JohnnyMorganz/StyLua/tree/main) is a linter for Lua.
You can enable the stylua linter with:
```shell theme={null}
trunk check enable stylua
```
## Auto Enabling
stylua will be auto-enabled if any of its config files are present: *`stylua.toml`, `.stylua.toml`*.
## Settings
stylua supports the following config files:
* `stylua.toml`
* `.stylua.toml`
You can move these files to `.trunk/configs` and `trunk check` will still find them. See [Moving Linters](../configure-linters#moving-linters) for more info. Trunk Code Quality provides a default `stylua.toml` if your project does not already have one.
## Links
* [stylua site](https://github.com/JohnnyMorganz/StyLua/tree/main)
* stylua Trunk Code Quality [integration source](https://github.com/trunk-io/plugins/tree/main/linters/stylua)
* Trunk Code Quality's [open source plugins repo](https://github.com/trunk-io/plugins/tree/main)
# SVGO
Source: https://docs.trunk.io/code-quality/overview/linters/supported/svgo
SVGO, or Scalable Vector Graphics Optimizer, is a tool designed to optimize SVG files, making them smaller and more efficient without compromising on quality.
[**SVGO**](https://github.com/svg/svgo) is a linter for SVG.
You can enable the SVGO linter with:
```shell theme={null}
trunk check enable svgo
```
## Auto Enabling
SVGO will be auto-enabled if any *SVG* files are present.
## Settings
SVGO supports the following config files:
* `svgo.config.js`
* `svgo.config.mjs`
* `svgo.config.cjs`
You can move these files to `.trunk/configs` and `trunk check` will still find them. See [Moving Linters](../configure-linters#moving-linters) for more info. Trunk Code Quality provides a default `svgo.config.js` if your project does not already have one.
## Links
* [SVGO site](https://github.com/svg/svgo)
* SVGO Trunk Code Quality [integration source](https://github.com/trunk-io/plugins/tree/main/linters/svgo)
* Trunk Code Quality's [open source plugins repo](https://github.com/trunk-io/plugins/tree/main)
# swiftformat
Source: https://docs.trunk.io/code-quality/overview/linters/supported/swiftformat
swiftformat is a linter for Swift
[**swiftformat**](https://github.com/nicklockwood/SwiftFormat#readme) is a linter for Swift.
You can enable the swiftformat linter with:
```shell theme={null}
trunk check enable swiftformat
```
## Auto Enabling
swiftformat will be auto-enabled if a `.swiftformat` config file is present.
## Settings
swiftformat supports the following config files:
* `.swiftformat`
You can move these files to `.trunk/configs` and `trunk check` will still find them. See [Moving Linters](../configure-linters#moving-linters) for more info.
## Links
* [swiftformat site](https://github.com/nicklockwood/SwiftFormat#readme)
* swiftformat Trunk Code Quality [integration source](https://github.com/trunk-io/plugins/tree/main/linters/swiftformat)
* Trunk Code Quality's [open source plugins repo](https://github.com/trunk-io/plugins/tree/main)
# swiftlint
Source: https://docs.trunk.io/code-quality/overview/linters/supported/swiftlint
swiftlint is a linter for Swift
[**swiftlint**](https://github.com/realm/SwiftLint#readme) is a linter for Swift.
You can enable the swiftlint linter with:
```shell theme={null}
trunk check enable swiftlint
```
## Auto Enabling
swiftlint will be auto-enabled if any of its config files are present: *`.swiftlint.yml`, `.swiftlint.yaml`, `.swiftlint`*.
## Settings
swiftlint supports the following config files:
* `.swiftlint.yml`
* `.swiftlint.yaml`
* `.swiftlint`
You can move these files to `.trunk/configs` and `trunk check` will still find them. See [Moving Linters](../configure-linters#moving-linters) for more info.
## Links
* [swiftlint site](https://github.com/realm/SwiftLint#readme)
* swiftlint Trunk Code Quality [integration source](https://github.com/trunk-io/plugins/tree/main/linters/swiftlint)
* Trunk Code Quality's [open source plugins repo](https://github.com/trunk-io/plugins/tree/main)
# taplo
Source: https://docs.trunk.io/code-quality/overview/linters/supported/taplo
taplo is a linter for TOML
[**taplo**](https://github.com/tamasfe/taplo#readme) is a linter for TOML.
You can enable the taplo linter with:
```shell theme={null}
trunk check enable taplo
```
## Auto Enabling
taplo will be auto-enabled if any *TOML* files are present.
## Settings
taplo supports the following config files:
* `.taplo.toml`
* `taplo.toml`
You can move these files to `.trunk/configs` and `trunk check` will still find them. See [Moving Linters](../configure-linters#moving-linters) for more info.
## Links
* [taplo site](https://github.com/tamasfe/taplo#readme)
* taplo Trunk Code Quality [integration source](https://github.com/trunk-io/plugins/tree/main/linters/taplo)
* Trunk Code Quality's [open source plugins repo](https://github.com/trunk-io/plugins/tree/main)
# Terraform
Source: https://docs.trunk.io/code-quality/overview/linters/supported/terraform
The command line interface to Terraform is the terraform command, which accepts a variety of subcommands such as terraform validate or terraform fmt
[**Terraform**](https://developer.hashicorp.com/terraform/cli/commands) is a formatter for Terraform.
You can enable the Terraform formatter with:
```shell theme={null}
trunk check enable terraform
```
## Auto Enabling
Terraform will never be auto-enabled. It must be enabled manually.
## Usage Notes
We currently support `terraform validate` and `terraform fmt`, but only `fmt` is enabled by default when you add `terraform` to your enabled list in `trunk.yaml`. To enable `validate`, add this to your `trunk.yaml`:
```yaml theme={null}
lint:
enabled:
- terraform@:
commands: [validate, fmt]
```
Note: you must run `terraform init` before running `trunk check` with `terraform validate` enabled (both locally, or on CI).
## Links
* [Terraform site](https://developer.hashicorp.com/terraform/cli/commands)
* Terraform Trunk Code Quality [integration source](https://github.com/trunk-io/plugins/tree/main/linters/terraform)
* Trunk Code Quality's [open source plugins repo](https://github.com/trunk-io/plugins/tree/main)
# terragrunt
Source: https://docs.trunk.io/code-quality/overview/linters/supported/terragrunt
terragrunt is a linter for Terragrunt
[**terragrunt**](https://terragrunt.gruntwork.io/docs/getting-started/quick-start/) is a linter for Terragrunt.
You can enable the terragrunt linter with:
```shell theme={null}
trunk check enable terragrunt
```
## Auto Enabling
terragrunt will never be auto-enabled. It must be enabled manually.
## Links
* [terragrunt site](https://terragrunt.gruntwork.io/docs/getting-started/quick-start/)
* terragrunt Trunk Code Quality [integration source](https://github.com/trunk-io/plugins/tree/main/linters/terragrunt)
* Trunk Code Quality's [open source plugins repo](https://github.com/trunk-io/plugins/tree/main)
# terrascan
Source: https://docs.trunk.io/code-quality/overview/linters/supported/terrascan
terrascan is a linter for Terrascan, Security and Terraform
[**terrascan**](https://github.com/tenable/terrascan#readme) is a linter for Terrascan, Security and Terraform.
You can enable the terrascan linter with:
```shell theme={null}
trunk check enable terrascan
```
## Auto Enabling
terrascan will never be auto-enabled. It must be enabled manually.
## Links
* [terrascan site](https://github.com/tenable/terrascan#readme)
* terrascan Trunk Code Quality [integration source](https://github.com/trunk-io/plugins/tree/main/linters/terrascan)
* Trunk Code Quality's [open source plugins repo](https://github.com/trunk-io/plugins/tree/main)
# TFLint
Source: https://docs.trunk.io/code-quality/overview/linters/supported/tflint
TFLint is an essential linter designed for Terraform. It helps improve code quality, maintainability, and security in infrastructure as code (IaC) projects.
[**TFLint**](https://github.com/rhysd/actionlint) is a linter for Terraform.
You can enable the TFLint linter with:
```shell theme={null}
trunk check enable tflint
```
## Auto Enabling
TFLint will be auto-enabled if any *Terraform* files are present.
## Settings
TFLint supports the following config files:
* `.tflint.hcl`
You can move these files to `.trunk/configs` and `trunk check` will still find them. See [Moving Linters](../configure-linters#moving-linters) for more info.
## Links
* [TFLint site](https://github.com/rhysd/actionlint)
* TFLint Trunk Code Quality [integration source](https://github.com/trunk-io/plugins/tree/main/linters/tflint)
* Trunk Code Quality's [open source plugins repo](https://github.com/trunk-io/plugins/tree/main)
# tfsec
Source: https://docs.trunk.io/code-quality/overview/linters/supported/tfsec
tfsec is a linter for Security and Terraform
[**tfsec**](https://github.com/aquasecurity/tfsec) is a linter for Security and Terraform.
You can enable the tfsec linter with:
```shell theme={null}
trunk check enable tfsec
```
## Auto Enabling
tfsec will never be auto-enabled. It must be enabled manually.
## Settings
tfsec supports the following config files:
* `tfsec.yml`
* `tfsec.yaml`
* `.tfsec/config.json`
* `.tfsec/config.yml`
* `.tfsec/config.yaml`
Unlike with most tools under `trunk check`, these files cannot be moved.
## Links
* [tfsec site](https://github.com/aquasecurity/tfsec)
* tfsec Trunk Code Quality [integration source](https://github.com/trunk-io/plugins/tree/main/linters/tfsec)
* Trunk Code Quality's [open source plugins repo](https://github.com/trunk-io/plugins/tree/main)
# tofu
Source: https://docs.trunk.io/code-quality/overview/linters/supported/tofu
tofu is a linter for Terraform
[**tofu**](https://github.com/opentofu/opentofu) is a linter for Terraform.
You can enable the tofu linter with:
```shell theme={null}
trunk check enable tofu
```
## Auto Enabling
tofu will never be auto-enabled. It must be enabled manually.
## Links
* [tofu site](https://github.com/opentofu/opentofu)
* tofu Trunk Code Quality [integration source](https://github.com/trunk-io/plugins/tree/main/linters/tofu)
* Trunk Code Quality's [open source plugins repo](https://github.com/trunk-io/plugins/tree/main)
# Trivy
Source: https://docs.trunk.io/code-quality/overview/linters/supported/trivy
Explore our guide on Trivy, the comprehensive vulnerability scanner. Learn about its features, installation, and configuration.
[**Trivy**](https://github.com/aquasecurity/trivy) is a linter for Security.
You can enable the Trivy linter with:
```shell theme={null}
trunk check enable trivy
```
![trivy example output]() ## Auto Enabling
Trivy will be auto-enabled if any of its config files are present: *`trivy.yaml`, `.trivyignore`, `.trivyignore.yaml`*.
## Settings
Trivy supports the following config files:
* `trivy.yaml`
* `.trivyignore`
* `.trivyignore.yaml`
* `trivy-secret.yaml`
You can move these files to `.trunk/configs` and `trunk check` will still find them. See [Moving Linters](../configure-linters#moving-linters) for more info.
## Usage Notes
Trivy has the following subcommands:
* `config`
* Runs `trivy config` ([docs) ](https://aquasecurity.github.io/trivy/latest/docs/scanner/misconfiguration/))to scan for misconfigurations in infrastructure-as-code files. Enabled by default
* `fx-vuln`
* Runs `trivy fs --scanners vuln` ([docs](https://aquasecurity.github.io/trivy/latest/docs/target/filesystem/)) to scan for security vulnerabilities. Disabled by default.
* `fs-secret`
* Runs `trivy fs --scanners secret` ([docs](https://aquasecurity.github.io/trivy/latest/docs/target/filesystem/)) to scan for secrets. Disabled by default.
To enable/disable these, add the subcommands you want enabled in your `.trunk/trunk.yaml` as such:
```yaml theme={null}
lint:
enabled:
- trivy@0.45.1:
commands: [config, fs-vuln]
```
## Links
* [Trivy site](https://github.com/aquasecurity/trivy)
* Trivy Trunk Code Quality [integration source](https://github.com/trunk-io/plugins/tree/main/linters/trivy)
* Trunk Code Quality's [open source plugins repo](https://github.com/trunk-io/plugins/tree/main)
# Trufflehog
Source: https://docs.trunk.io/code-quality/overview/linters/supported/trufflehog
Discover Trufflehog with our detailed guide. Learn installation, configuration, usage, and how to integrate it with other linters for optimal code security.
[**Trufflehog**](https://github.com/trufflesecurity/trufflehog) is a linter for Security.
trufflehog is composed of several linter commands.
`trufflehog` runs trufflehog normally.
You can enable the `trufflehog` linter with:
```shell theme={null}
trunk check enable trufflehog
```
`trufflehog-git` also runs trufflehog on the git history.
You can enable the `trufflehog-git` linter with:
```shell theme={null}
trunk check enable trufflehog-git
```
## Auto Enabling
Trufflehog will be auto-enabled if any *all* files are present.
## Links
* [Trufflehog site](https://github.com/trufflesecurity/trufflehog)
* Trufflehog Trunk Code Quality [integration source](https://github.com/trunk-io/plugins/tree/main/linters/trufflehog)
* Trunk Code Quality's [open source plugins repo](https://github.com/trunk-io/plugins/tree/main)
# txtpbfmt
Source: https://docs.trunk.io/code-quality/overview/linters/supported/txtpbfmt
txtpbfmt is a linter for Textproto
[**txtpbfmt**](https://github.com/protocolbuffers/txtpbfmt/) is a linter for Textproto.
You can enable the txtpbfmt linter with:
```shell theme={null}
trunk check enable txtpbfmt
```
## Auto Enabling
txtpbfmt will be auto-enabled if any *Textproto* files are present.
## Links
* [txtpbfmt site](https://github.com/protocolbuffers/txtpbfmt/)
* txtpbfmt Trunk Code Quality [integration source](https://github.com/trunk-io/plugins/tree/main/linters/txtpbfmt)
* Trunk Code Quality's [open source plugins repo](https://github.com/trunk-io/plugins/tree/main)
# vale
Source: https://docs.trunk.io/code-quality/overview/linters/supported/vale
vale is a linter for prose
[**vale**](https://vale.sh/) is a linter for prose.
You can enable the vale linter with:
```shell theme={null}
trunk check enable vale
```
## Auto Enabling
vale will be auto-enabled if a `.vale.ini` config file is present.
## Settings
vale supports the following config files:
* `.vale.ini`
You can move these files to `.trunk/configs` and `trunk check` will still find them. See [Moving Linters](../configure-linters#moving-linters) for more info. Trunk Code Quality provides a default `.vale.ini` if your project does not already have one.
## Links
* [vale site](https://vale.sh/)
* vale Trunk Code Quality [integration source](https://github.com/trunk-io/plugins/tree/main/linters/vale)
* Trunk Code Quality's [open source plugins repo](https://github.com/trunk-io/plugins/tree/main)
# Yamllint
Source: https://docs.trunk.io/code-quality/overview/linters/supported/yamllint
Yamllint is a linter that checks for formatting discrepancies, key-value pair issues, and syntax errors, ensuring your YAML files are syntactically correct.
[**Yamllint**](https://github.com/adrienverge/yamllint) is a linter for YAML.
You can enable the Yamllint linter with:
```shell theme={null}
trunk check enable yamllint
```
## Auto Enabling
Yamllint will be auto-enabled if any *Yaml* files are present.
## Settings
Yamllint supports the following config files:
* `.yamllint`
* `.yamllint.yaml`
* `.yamllint.yml`
You can move these files to `.trunk/configs` and `trunk check` will still find them. See [Moving Linters](../configure-linters#moving-linters) for more info. Trunk Code Quality provides a default `.yamllint.yaml` if your project does not already have one.
## Links
* [Yamllint site](https://github.com/adrienverge/yamllint)
* Yamllint Trunk Code Quality [integration source](https://github.com/trunk-io/plugins/tree/main/linters/yamllint)
* Trunk Code Quality's [open source plugins repo](https://github.com/trunk-io/plugins/tree/main)
# yapf
Source: https://docs.trunk.io/code-quality/overview/linters/supported/yapf
yapf is a linter for Python
[**yapf**](https://github.com/google/yapf#readme) is a linter for Python.
You can enable the yapf linter with:
```shell theme={null}
trunk check enable yapf
```
## Auto Enabling
yapf will be auto-enabled if any of its config files are present: *`.style.yapf`, `.yapfignore`*.
## Settings
yapf supports the following config files:
* `.style.yapf`
* `.yapfignore`
You can move these files to `.trunk/configs` and `trunk check` will still find them. See [Moving Linters](../configure-linters#moving-linters) for more info.
## Links
* [yapf site](https://github.com/google/yapf#readme)
* yapf Trunk Code Quality [integration source](https://github.com/trunk-io/plugins/tree/main/linters/yapf)
* Trunk Code Quality's [open source plugins repo](https://github.com/trunk-io/plugins/tree/main)
# Upgrades
Source: https://docs.trunk.io/code-quality/overview/linters/upgrades
Run `trunk upgrade` to update the Trunk CLI and all your plugins, linters, tools, and runtimes.
#### Upgrade scopes
Upgrades can be filtered to different scopes by adding them to `trunk upgrade
## Auto Enabling
Trivy will be auto-enabled if any of its config files are present: *`trivy.yaml`, `.trivyignore`, `.trivyignore.yaml`*.
## Settings
Trivy supports the following config files:
* `trivy.yaml`
* `.trivyignore`
* `.trivyignore.yaml`
* `trivy-secret.yaml`
You can move these files to `.trunk/configs` and `trunk check` will still find them. See [Moving Linters](../configure-linters#moving-linters) for more info.
## Usage Notes
Trivy has the following subcommands:
* `config`
* Runs `trivy config` ([docs) ](https://aquasecurity.github.io/trivy/latest/docs/scanner/misconfiguration/))to scan for misconfigurations in infrastructure-as-code files. Enabled by default
* `fx-vuln`
* Runs `trivy fs --scanners vuln` ([docs](https://aquasecurity.github.io/trivy/latest/docs/target/filesystem/)) to scan for security vulnerabilities. Disabled by default.
* `fs-secret`
* Runs `trivy fs --scanners secret` ([docs](https://aquasecurity.github.io/trivy/latest/docs/target/filesystem/)) to scan for secrets. Disabled by default.
To enable/disable these, add the subcommands you want enabled in your `.trunk/trunk.yaml` as such:
```yaml theme={null}
lint:
enabled:
- trivy@0.45.1:
commands: [config, fs-vuln]
```
## Links
* [Trivy site](https://github.com/aquasecurity/trivy)
* Trivy Trunk Code Quality [integration source](https://github.com/trunk-io/plugins/tree/main/linters/trivy)
* Trunk Code Quality's [open source plugins repo](https://github.com/trunk-io/plugins/tree/main)
# Trufflehog
Source: https://docs.trunk.io/code-quality/overview/linters/supported/trufflehog
Discover Trufflehog with our detailed guide. Learn installation, configuration, usage, and how to integrate it with other linters for optimal code security.
[**Trufflehog**](https://github.com/trufflesecurity/trufflehog) is a linter for Security.
trufflehog is composed of several linter commands.
`trufflehog` runs trufflehog normally.
You can enable the `trufflehog` linter with:
```shell theme={null}
trunk check enable trufflehog
```
`trufflehog-git` also runs trufflehog on the git history.
You can enable the `trufflehog-git` linter with:
```shell theme={null}
trunk check enable trufflehog-git
```
## Auto Enabling
Trufflehog will be auto-enabled if any *all* files are present.
## Links
* [Trufflehog site](https://github.com/trufflesecurity/trufflehog)
* Trufflehog Trunk Code Quality [integration source](https://github.com/trunk-io/plugins/tree/main/linters/trufflehog)
* Trunk Code Quality's [open source plugins repo](https://github.com/trunk-io/plugins/tree/main)
# txtpbfmt
Source: https://docs.trunk.io/code-quality/overview/linters/supported/txtpbfmt
txtpbfmt is a linter for Textproto
[**txtpbfmt**](https://github.com/protocolbuffers/txtpbfmt/) is a linter for Textproto.
You can enable the txtpbfmt linter with:
```shell theme={null}
trunk check enable txtpbfmt
```
## Auto Enabling
txtpbfmt will be auto-enabled if any *Textproto* files are present.
## Links
* [txtpbfmt site](https://github.com/protocolbuffers/txtpbfmt/)
* txtpbfmt Trunk Code Quality [integration source](https://github.com/trunk-io/plugins/tree/main/linters/txtpbfmt)
* Trunk Code Quality's [open source plugins repo](https://github.com/trunk-io/plugins/tree/main)
# vale
Source: https://docs.trunk.io/code-quality/overview/linters/supported/vale
vale is a linter for prose
[**vale**](https://vale.sh/) is a linter for prose.
You can enable the vale linter with:
```shell theme={null}
trunk check enable vale
```
## Auto Enabling
vale will be auto-enabled if a `.vale.ini` config file is present.
## Settings
vale supports the following config files:
* `.vale.ini`
You can move these files to `.trunk/configs` and `trunk check` will still find them. See [Moving Linters](../configure-linters#moving-linters) for more info. Trunk Code Quality provides a default `.vale.ini` if your project does not already have one.
## Links
* [vale site](https://vale.sh/)
* vale Trunk Code Quality [integration source](https://github.com/trunk-io/plugins/tree/main/linters/vale)
* Trunk Code Quality's [open source plugins repo](https://github.com/trunk-io/plugins/tree/main)
# Yamllint
Source: https://docs.trunk.io/code-quality/overview/linters/supported/yamllint
Yamllint is a linter that checks for formatting discrepancies, key-value pair issues, and syntax errors, ensuring your YAML files are syntactically correct.
[**Yamllint**](https://github.com/adrienverge/yamllint) is a linter for YAML.
You can enable the Yamllint linter with:
```shell theme={null}
trunk check enable yamllint
```
## Auto Enabling
Yamllint will be auto-enabled if any *Yaml* files are present.
## Settings
Yamllint supports the following config files:
* `.yamllint`
* `.yamllint.yaml`
* `.yamllint.yml`
You can move these files to `.trunk/configs` and `trunk check` will still find them. See [Moving Linters](../configure-linters#moving-linters) for more info. Trunk Code Quality provides a default `.yamllint.yaml` if your project does not already have one.
## Links
* [Yamllint site](https://github.com/adrienverge/yamllint)
* Yamllint Trunk Code Quality [integration source](https://github.com/trunk-io/plugins/tree/main/linters/yamllint)
* Trunk Code Quality's [open source plugins repo](https://github.com/trunk-io/plugins/tree/main)
# yapf
Source: https://docs.trunk.io/code-quality/overview/linters/supported/yapf
yapf is a linter for Python
[**yapf**](https://github.com/google/yapf#readme) is a linter for Python.
You can enable the yapf linter with:
```shell theme={null}
trunk check enable yapf
```
## Auto Enabling
yapf will be auto-enabled if any of its config files are present: *`.style.yapf`, `.yapfignore`*.
## Settings
yapf supports the following config files:
* `.style.yapf`
* `.yapfignore`
You can move these files to `.trunk/configs` and `trunk check` will still find them. See [Moving Linters](../configure-linters#moving-linters) for more info.
## Links
* [yapf site](https://github.com/google/yapf#readme)
* yapf Trunk Code Quality [integration source](https://github.com/trunk-io/plugins/tree/main/linters/yapf)
* Trunk Code Quality's [open source plugins repo](https://github.com/trunk-io/plugins/tree/main)
# Upgrades
Source: https://docs.trunk.io/code-quality/overview/linters/upgrades
Run `trunk upgrade` to update the Trunk CLI and all your plugins, linters, tools, and runtimes.
#### Upgrade scopes
Upgrades can be filtered to different scopes by adding them to `trunk upgrade `. The scopes available are:
| Scope | Description |
| -------- | --------------------------------------------------------------------------------------------------------------------------------------------------------------------------------------------------------------------------------------------------------------- |
| cli | Only upgrade the Trunk CLI to the latest version. |
| plugins | Upgrade any that you have sourced to their latest public release. The latest version must be compatible with your current `cli` version in order for the upgrade to be applied. |
| check | Upgrade any linters that you have enabled. Linters will be upgraded to the latest validated version that have passed tests in our [plugins](https://github.com/trunk-io/plugins) repo. Additional recommended linters can also be enabled by running with `-y`. |
| tools | Upgrade any that you have enabled. Tools will be upgraded to their latest public release. Note that any enabled linters that share a name with an enabled tool must keep their versions synced. |
| runtimes | Upgrade any that you have enabled. Runtimes will be upgraded to their recommended version for running linters, as specified by Trunk. |
#### Automatic upgrades
When running locally, Trunk automatically checks for upgrades in the background on a regular cadence. You'll see notifications for these upgrades appear in the VSCode Extension or at the end of a `trunk check` run. To stop seeing these notifications, you can run `trunk actions disable trunk-upgrade-available`.
When running in single-player mode, Trunk will automatically upgrade itself in the background and stay up to date.
#### Automatic upgrades with GitHub Actions
You can configure a GitHub workflow to create PRs with the latest Trunk and tool versions automatically. Here's a sample GitHub Action:
```yaml theme={null}
name: Nightly
on:
schedule:
- cron: 0 8 * * 1-5
workflow_dispatch: {}
permissions: read-all
jobs:
trunk_upgrade:
name: Upgrade Trunk
runs-on: ubuntu-latest
permissions:
contents: write # For trunk to create PRs
pull-requests: write # For trunk to create PRs
steps:
- name: Checkout
uses: actions/checkout@v3
# >>> Install your own deps here (npm install, etc) <<<
- name: Trunk Upgrade
uses: trunk-io/trunk-action/upgrade@v1
```
Then, provide permissions for this GitHub Action to [create and approve pull requests](https://docs.github.com/en/repositories/managing-your-repositorys-settings-and-features/enabling-features-for-your-repository/managing-github-actions-settings-for-a-repository#preventing-github-actions-from-creating-or-approving-pull-requests) by navigating to your repo's **Settings** → **Actions** → **General** → **Workflow permissions** → **Allow GitHub Actions to create and approve pull requests**.\
\
You can also set the `arguments` field to filter particular scopes to upgrade and set `base` to define the branch to create a PR against (default `main`).
**Triggering further workflow runs**
PRs created with this GitHub Action will not trigger further workflows by default. If you need the PRs created to trigger further GitHub Action Workflows, [follow the workarounds described here](https://github.com/peter-evans/create-pull-request/blob/main/docs/concepts-guidelines.md#triggering-further-workflow-runs).
#### Pinning versions
If you don't want a linter, tool, or runtime to be upgraded, you can pin its version by appending `!` to the version in your `.trunk/trunk.yaml`. For example:
```yaml theme={null}
lint:
enabled:
- pylint@2.17.5!
```
#### Plugin repositories and user.yaml
By default, upgrades are only applied to your repo's `.trunk/trunk.yaml`. If you're using a plugin repo that enables linters/tools, or if you would like upgrades to be applied to your `.trunk/user.yaml` file, you can run `trunk upgrade --apply-to ` to see upgrades applied there.
# Linting in CI
Source: https://docs.trunk.io/code-quality/overview/prevent-new-issues/index
Trunk Code Quality can be run in CI to prevent new issues form being introduced by PRs and on a nightly/scheduled cadence to report on existing issues.
### Configuring base branch
Trunk operates in **hold-the-line** mode by default. This means Trunk will run linters only on the **files that have changed** according to Git, by comparing it to the appropriate upstream branch.
If you're not using `main` or `master` as the base branch, make sure it's specified in `.trunk/trunk.yaml`.
```yaml theme={null}
version: 0.1
cli:
version: 1.22.2
repo:
# specify the base branch for hold-the-line
trunk_branch: develop
```
### Linting on pull requests
```yaml theme={null}
name: Trunk Code Quality
on:
push:
branches: main
pull_request:
branches: main
jobs:
test:
runs-on: ubuntu-latest
steps:
- uses: actions/checkout@v4
# ... other setup steps
- name: Trunk Code Quality
uses: trunk-io/trunk-action@v1
with:
post-annotations: true
# ... other CI steps
```
This step will automatically run Trunk Code Quality to reveal problems found when comparing the branch to `main` or another base branch you configured.
If you want to run the `trunk check` command directly in your workflow, or you're not using GitHub, you can run the following commands:
```sh theme={null}
curl -fsSLO --retry 3 https://trunk.io/releases/trunk \
chmod +x trunk \
./trunk check --ci
```
Trunk Code Quality can be run in CI to prevent new issues form being introduced by PRs and on a nightly/scheduled cadence to report on existing issues.
### Configuring base branch
Trunk operates in **hold-the-line** mode by default. This means Trunk will run linters only on the **files that have changed** according to Git, by comparing it to the appropriate upstream branch.
If you're not using `main` or `master` as the base branch, make sure it's specified in `.trunk/trunk.yaml`.
```yaml theme={null}
version: 0.
cli:
version: 1.22.2
repo:
# specify the base branch for hold-the-line
trunk_branch: develop
```
#### Manual configuration and Non-GitHub CI
If you want to run the `trunk check` command directly in your workflow, or you're not using GitHub, you can run the following commands:
```
curl -fsSLO --retry 3 https://trunk.io/releases/trunk \
chmod +x trunk \
./trunk check --ci
```
#### Skipping Trunk Code Quality on pull requests
You can include `/trunk skip-check` in the body of a PR description (i.e. the first comment on a given PR) to mark Trunk Code Quality as "skipped". Trunk Code Quality will still run on your PR and report issues, but this will allow the PR to pass a GitHub-required status check on `Trunk Check`.
This can be helpful if Code Quality is flagging known issues in a given PR that you don't want to ignore, which can come in handy if you're doing a large refactor.
### Caching and persistence
* Trunk caches the version of `trunk` itself, linters, formatters, and lint results in `~/.cache/trunk`
* If your build machines are persistent, make sure this directory is not wiped out between CI jobs for best performance. If Trunk has to re-download every linter for every job because this directory is wiped out, it will be very slow.
* If your build machines are ephemeral, there are a few options for caching:
* CI systems have support for caching between CI jobs on ephemeral runners:
* [GitHub Actions](https://github.com/actions/cache)
* [CircleCI](https://circleci.com/docs/caching/)
* [Travis CI](https://docs.travis-ci.com/user/caching/)
* You can include a seeded trunk cache in a regularly updated image used for CI by running `trunk check download`, which will download all requirements to `~/.cache/trunk`
### Hourly and nightly builds
If you'd like to set Code Quality to run on an hourly/nightly CI, you can run
```yaml theme={null}
name: Trunk Code Quality
on:
schedule:
# Run at 4 PM UTC daily (cron uses UTC time)
- cron: '0 16 * * *'
jobs:
test:
runs-on: ubuntu-latest
steps:
- uses: actions/checkout@v4
# ... other setup steps
- name: Trunk Code Quality
uses: trunk-io/trunk-action@v1
with:
check-mode: all
# ... other CI steps
```
You can do the same without Trunk's GitHub Action using the following command:
```bash theme={null}
curl -fsSLO --retry 3 https://trunk.io/releases/trunk \
chmod +x trunk \
./trunk check --all --ci-progress --monitor=false
```
`--ci-progress` will print out the tool's progress every 30 seconds, whereas `--no-progress` will suppress any progress reporting.
You can also explicitly set the upstream branch if needed via `--upstream`, but we do detect your main branch by default.
# Autofix CI Failures
Source: https://docs.trunk.io/flaky-tests/agents/autofix-ci-failures
Automatically investigate and fix CI failures with Trunk's autofix agent.
Trunk can return targeted information about CI failures, enabling AI agents and automation tools to analyze and fix issues automatically.
## Prerequisites
To use the Autofix CI Failures feature, you'll need to have:
* Your repository set up to [upload test results to Trunk](../get-started/index)
## Cursor CI Autofix
You can set up a [Cursor Automation](https://cursor.com/automations) to automatically fix CI failures by connecting to Trunk's CI failure investigation data via MCP. This is an extension of the Cursor `CI Autofix` template.
![Configuration for Cursor Automation]() Set up the Trunk MCP using [Bearer Authentication](../reference/mcp-reference/configuration/bearer-auth).
Set up the Trunk MCP using [Bearer Authentication](../reference/mcp-reference/configuration/bearer-auth).
```json theme={null}
{
"name": "CI Autofix v1",
"description": "Detect CI failures on main and automatically open PRs",
"triggers": [
{
"git": {
"ciCompleted": {
"repos": [
"https://github.com/"
],
"condition": 1,
"ignoreBaseFailures": true
}
}
}
],
"actions": [
{
"gitPr": {}
},
{
"mcp": {
"server": {
"name": "trunk"
}
}
}
],
"prompts": [
{
"prompt": "Your task is to fix CI failures on PRs.\n\n# Deduplication\n\nTo avoid racing against other agents, before any investigation:\n1. Collect the names of ALL failing CI jobs/checks from the CI Status Report above.\n2. Calculate your memory filename: sort the failing jobs alphabetically, join with \"_\", then remove any characters that are not letters, digits, hyphens, underscores, or dots. Prepend \"ci-fail-\" and truncate to 64 characters total. This is the filename.\n3. Read the memory file with this filename.\n - If it exists and the timestamp inside is less than 30 minutes old, stop immediately — no branch, no Slack, no output.\n4. Else, write the memory file with the current unix timestamp.\n - If the write SUCCEEDS: you claimed this failure. Proceed with the investigation below.\n - If the write FAILS (version conflict): another agent claimed it first. Stop immediately — no branch, no Slack, no output.\n\n# Investigation\n\nRoot cause the CI failure. Call investigate-ci-failure on the trunk MCP in order to get information about the failing test by passing in the workflow URL. Use that to identify which tests to fix. Look at the error output returned by this tool. ONLY IF you need additional information, look at the CI run's logs.\n\n- If the CI failure is due to a bug introduced on that commit, create a new PR that fixes the bug. The PR should be stacked on the PR with the failure. Modify/ensure the base branch of the PR you create is the branch of the PR you are fixing.\n- If the CI failure is due to a flaky test, create a new PR that skips that test.\n- If you are not confident in either of these outcomes, then do nothing.\n\n# Output\n\nOutput your results in the following format:\n**CI Autofix Automation**\n\n**Failure logs**: \n**Broken by**: (cc @prAuthor)\n**Reason**: <1-2 sentence explanation of why CI broke>\n**Fixed by**: <1-2 sentence explanation of what fixed it>\n\nMake sure to push the PR but don't include a PR link in your output — the system will generate that for you."
}
],
"memoryEnabled": true,
"scope": "team_editable_user",
"templateId": "ci-autofix"
}
```
We recommend the following conventions:
* Version your Automation names for more clarity (e.g., "CI Autofix v1")
* Refine the prompt to avoid scanning GitHub logs in order to save time and tokens
* Be specific about your repository's conventions and common failure patterns
Currently Cursor will create a pull request with a base of `main`. You will need to adjust the pull request base if you want to merge the fix into your PR.
## Claude Code Routines
**Coming soon.** Set up Claude Routines to autofix CI failures
# Autofix Flaky Tests
Source: https://docs.trunk.io/flaky-tests/agents/autofix-flaky-tests
Automatically investigate and fix flaky tests with Trunk's autofix agent.
Trunk can automatically investigate flaky tests in your codebase and raise fix pull requests with suggested solutions.
## Prerequisites
To use the Autofix Flaky Tests feature, you'll need:
1. Beta access via waitlist (reach out to us at [support@trunk.io](mailto:support@trunk.io))
2. The "Investigate Flaky Tests" setting enabled in your workspace
3. Active installation of the [Trunk GitHub App](../../setup-and-administration/github-app-permissions)
The "Investigate Flaky Tests" setting can only be changed by organization admins.
![Setting to enable Flaky Test investigation]() ## Auto-Investigate Flaky Tests
Once enabled, any time that Trunk [detects a flaky test](../detection/index), Trunk analyzes the failure patterns, failure output, and git history of the test to provide a number of insights.
## Auto-Investigate Flaky Tests
Once enabled, any time that Trunk [detects a flaky test](../detection/index), Trunk analyzes the failure patterns, failure output, and git history of the test to provide a number of insights.
![Results of an automatic flaky tests analysis]() Flaky tests can also be analyzed manually via the UI and via the [MCP server](../reference/mcp-reference/fix-flaky-test).
### Skipped and failed analyses
When Trunk skips or fails an analysis, the Analysis tab shows a banner explaining what happened. Common reasons an analysis is skipped:
* **Monthly analysis limit reached.** Your repository has used all available analyses for the current billing period. The banner shows how long ago the skip occurred.
* **Analysis already in progress.** A previous run is still queued; Trunk skips a new one to avoid duplicates.
If an analysis fails due to an internal error, the banner notes the failure without exposing internal details. In either case, you can request a new analysis once the blocking condition clears.
### Autofix with Cursor Automations
Whenever an investigation is completed, Trunk will emit a [webhook](../webhooks/index) for `test_case.investigation_completed`. Enable webhooks via [Svix](../webhooks/index).
You can then set up a [Cursor Automation](https://cursor.com/automations) to trigger when webhooks are received.
Flaky tests can also be analyzed manually via the UI and via the [MCP server](../reference/mcp-reference/fix-flaky-test).
### Skipped and failed analyses
When Trunk skips or fails an analysis, the Analysis tab shows a banner explaining what happened. Common reasons an analysis is skipped:
* **Monthly analysis limit reached.** Your repository has used all available analyses for the current billing period. The banner shows how long ago the skip occurred.
* **Analysis already in progress.** A previous run is still queued; Trunk skips a new one to avoid duplicates.
If an analysis fails due to an internal error, the banner notes the failure without exposing internal details. In either case, you can request a new analysis once the blocking condition clears.
### Autofix with Cursor Automations
Whenever an investigation is completed, Trunk will emit a [webhook](../webhooks/index) for `test_case.investigation_completed`. Enable webhooks via [Svix](../webhooks/index).
You can then set up a [Cursor Automation](https://cursor.com/automations) to trigger when webhooks are received.
![Configuration for Cursor Automation]()
```json theme={null}
{
"name": "Autofix Flaky Tests v1",
"triggers": [
{
"webhook": {}
}
],
"actions": [],
"prompts": [
{
"prompt": "Your task is to fix flaky tests in this repo using provided insights.\n\n# Filter\n\nIf the test does not include the repository html_url \"https://github.com/\", exit early and do nothing.\n\n# Root Cause\n\nThe payload will include metadata about the failing test as well as some insights about the flakiness.\n\n1. The markdown_summary field includes the most important insights and the first steps you should take to root cause the flaky tests.\n2. The facts field includes more findings from historical data about running the test.\n3. Remember that the test is flaky. Sometimes it passes and sometimes it fails. Use the investigation payload to target your analysis.\n4. Use the memory tool to capture any important findings as you analyze the codebase to root cause the flakiness, such as codebase structure or test patterns.\n\n## Antipatterns\n\n1. Identify the root cause of the flakiness of the test. Do not simply increase the test's timeout or change the assertion to be more generic.\n2. Do not attempt to fix flakiness in other tests, limit your analysis to this single test.\n3. Do not add new tests, fix the flaky test in the payload.\n4. If the test is not present on your stable branch, exit early.\n5. When modifying end to end tests, do not wait on internal API calls to resolve. Focus on the page state and what the end user sees.\n6. There may be additional reasons for test flakiness, such as nondeterministic seed data, noisy neighbors, or test order issues. Conduct a deep analysis for necessary evidence, do not terminate your analysis early.\n\n## Output\n\n1. Once you have identified the root cause of the test's flakiness, open a pull request to fix the PR.\n2. Title the Pull Request: \"[Cursor Fix Flaky Test]: \".\n3. Include 1 short paragraph about the fix and the supporting evidence in the pull request body. Include links to relevant files/pages that were relevant from the webhook payload and its facts.\n4. In a collapsible summary of the PR description, include the entire webhook payload you received."
}
],
"memoryEnabled": true,
"scope": "private",
"gitConfig": {
"repo": "https://github.com/",
"repos": [
"https://github.com/"
],
"branch": "main"
}
}
```
We recommend the following conventions:
* Version your Automation names for more clarity.
* Configure the Svix endpoint with the Cursor Bearer token.
* Webhooks are configured for your entire organization, so you will need to use [Svix transformations](https://docs.svix.com/transformations) or filter out events that are not for your intended repository.
* Be specific about conventions and antipatterns for your repository. You will need to refine the Automation prompt to suit your needs.
* If your CI setup allows it, prompt Cursor to run the tests to verify them.
## What's next?
* Continue to monitor your tests to confirm the flaky test fixes are effective
* Investigations can be triggered and applied via [MCP](../reference/mcp-reference/fix-flaky-test)
**Coming soon.** Set up Claude Routines to autofix flaky tests
# Agents
Source: https://docs.trunk.io/flaky-tests/agents/index
Use agents and AI workflows to investigate and fix flaky tests and CI failures.
# Changelog
Source: https://docs.trunk.io/flaky-tests/changelog
Recent updates to Trunk Flaky Tests.
## 2026
### August 2026
**[Flaky Tests: Asana ticketing integration](/changelog/2026-08-11-flaky-tests-asana-ticketing)**
Trunk Flaky Tests now integrates with Asana — create, link, and automate tasks for flaky and broken tests alongside the existing Linear and Jira integrations.
### July 2026
**[Flaky Tests: Automatic ticketing for Linear and Jira](/changelog/2026-07-31-flaky-tests-automatic-ticketing)**
Trunk can now create, reopen, and close Linear and Jira tickets automatically as your tests change status — no webhooks required.
### June 2026
**[Flaky Tests: Failure Details and Copy Prompt in the Browser Extension](/changelog/2026-06-17-flaky-tests-browser-extension-failure-details)**
The browser extension now shows test failure details inline on PR pages, with a one-click button to copy an investigation prompt for your AI assistant.
**[Flaky Tests: Test Details Panel in the Browser Extension](/changelog/2026-06-11-flaky-tests-extension-test-details)**
The Trunk browser extension can now show per-commit test run results inline on GitHub pull request pages for repositories with Flaky Tests uploads.
**[Flaky Tests: Pass-on-Retry Monitor Is Now Org-Scoped](/changelog/2026-06-11-flaky-tests-pass-on-retry-org-scoped)**
Pass-on-retry monitors now belong to your organization and can optionally target specific repositories, simplifying detection management across multi-repo orgs.
**[Flaky Tests: Multiple Pass-on-Retry Monitors Per Repository](/changelog/2026-06-09-flaky-tests-multiple-por-monitors)**
You can now create more than one pass-on-retry monitor per repository, each with independent settings.
**[Flaky Tests: Test Collections Have Quarantining On by Default](/changelog/2026-06-08-flaky-tests-collection-quarantine-default)**
New test collections now start with quarantining enabled, so uploads are protected from day one without requiring a manual settings change.
**[Flaky Tests: Monitor History Swimlane](/changelog/2026-06-08-flaky-tests-monitor-history-swimlane)**
The Monitors tab on the test detail page now shows a swimlane visualization of each monitor's classification history over time.
**[Flaky Tests: Jira Ticket Creation Improvements](/changelog/2026-06-05-flaky-tests-jira-assignee-improvements)**
The Jira ticket creation flow now loads all assignable users, lists them alphabetically, and correctly populates the Components field.
**[Flaky Tests: Configurable Minimum POR Count for the Pass-on-Retry Monitor](/changelog/2026-06-02-flaky-tests-por-count-monitor)**
Require multiple pass-on-retry commits before flagging a test as flaky, reducing noise in high-retry CI environments.
### May 2026
**[Flaky Tests: Lifecycle & Performance Monitors](/changelog/2026-05-28-flaky-tests-lifecycle-and-performance-monitors)**
Three new monitor types — new-test, skipped-test, and slow-test — apply labels to tests based on lifecycle and performance signals, without affecting health status.
**[Flaky Tests: Linear Field Defaults and Link Existing Tickets](/changelog/2026-05-19-flaky-tests-linear-improvements)**
Set per-repository defaults for auto-created Linear tickets, and link existing Linear tickets to a test without creating a duplicate.
**[Flaky Tests: Failure Count Monitor](/changelog/2026-05-18-flaky-tests-failure-count-monitor)**
Flag tests the moment they accumulate a configured number of failures on monitored branches.
**[Flaky Tests: Fork PR Uploads Without Sharing Your Org Token](/changelog/2026-05-18-flaky-tests-fork-pr-uploads)**
Opt a repository into uploading test results from fork pull requests using a non-secret public repo identifier instead of your organization API token.
**[Flaky Tests: Apply Labels from Monitors](/changelog/2026-05-18-flaky-tests-monitor-label-actions)**
Monitors can now apply labels to tests instead of classifying them as flaky or broken.
**[Flaky Tests: Organization-Scoped Test Labels](/changelog/2026-05-18-flaky-tests-test-labels)**
Tag, organize, and filter your test suite with org-wide labels.
**[Flaky Tests: Switch a Monitor's Action Type After Creation](/changelog/2026-05-14-flaky-tests-monitor-action-types)**
Change a monitor's action between Classify test status and Apply labels, or flip flaky and broken, without deleting and recreating it.
**[Flaky Tests: Independent Result and Quarantined filters on run history](/changelog/2026-05-07-flaky-tests-run-history-filters)**
Filter a test's run history by result and quarantine state with two independent controls instead of one combined picker.
**[Flaky Tests: Branch Scope for the Pass-on-Retry Monitor](/changelog/2026-05-06-flaky-tests-pass-on-retry-branch-scope)**
Restrict pass-on-retry detection to specific branches to cut noise from PR-branch retries.
### April 2026
**[Flaky Tests: Filterable Uploads History](/changelog/2026-04-28-flaky-tests-filterable-uploads-history)**
Browse a filterable, paginated history of every CI test upload, with a daily status breakdown chart and multi-value filters.
**[Flaky Tests: Linked Tickets Survive Linear Team and Jira Project Moves](/changelog/2026-04-15-flaky-tests-linked-tickets-survive-moves)**
Tickets you have linked to Trunk no longer disappear when they are moved to a different Linear team or Jira project.
**[Flaky Tests: Repositories Overview Dashboard](/changelog/2026-04-15-flaky-tests-repositories-overview-dashboard)**
The Flaky Tests landing page now summarizes every repo's flaky test health instead of redirecting into a single repo.
**[Flaky Tests: API Token Auth for the Trunk MCP Server](/changelog/2026-04-08-flaky-tests-mcp-api-token-auth)**
The Trunk MCP server now accepts a Trunk organization API token via the Authorization: Bearer header, so you can use Trunk's MCP tools from CI jobs, scripts, and any client that doesn't support an OAuth flow.
**[Flaky Tests: AI Investigations Delivered via Webhooks](/changelog/2026-04-06-flaky-tests-ai-investigations-webhooks)**
AI-powered investigations run automatically when a test first becomes flaky, with the findings delivered to your configured webhook endpoint.
**[Flaky Tests: No-Monitors Banner and Jira Custom Fields](/changelog/2026-04-06-flaky-tests-no-monitors-banner-jira-fields)**
The Flaky Tests page now warns when a repository has no detection monitors configured, and the Jira ticketing integration supports custom fields.
### March 2026
**[Flaky Tests: Automatically Create Jira Issues from Webhooks](/changelog/2026-03-27-flaky-tests-automatically-create-jira-issues-from-webhooks)**
A new Jira connector in your webhook settings creates issues in your Jira Cloud project whenever a test's status changes to flaky and impacts more than a configurable number of PRs.
**[Flaky Tests: Configurable Threshold Monitors with Live Preview](/changelog/2026-03-24-flaky-tests-configurable-threshold-monitors-with-live-preview)**
You now have full control over how flaky tests are detected. Threshold monitors let you define exactly when a test should be flagged as flaky or broken, set the failure rate threshold, time window,…
**[Flaky Tests: Detect Consistently Failing Tests as Broken](/changelog/2026-03-10-flaky-tests-detect-broken-tests)**
Threshold monitors can now classify consistently failing tests as Broken, distinct from Flaky.
**[Flaky Tests: Flag Any Test as Flaky in One Click](/changelog/2026-03-10-flaky-tests-flag-as-flaky-one-click)**
Flag any test as flaky directly from its detail page with a single click and an optional reason.
### February 2026
**[Flaky Tests: Infrastructure Failure Protection](/changelog/2026-02-02-flaky-tests-infrastructure-failure-protection)**
When infrastructure issues like database outages, network problems, or CI runner failures cause a large number of tests to fail simultaneously, retrying those tests can trigger mass false flaky…
## 2025
### November 2025
**[Flaky Tests: New API endpoints](/changelog/2025-11-18-flaky-tests-new-api-endpoints)**
We’ve added three new endpoints to make it easier to investigate flaky tests, automate triage, and integrate test health into your workflows.
### September 2025
**[Flaky Test: Corrected CLI test failure reporting flag](/changelog/2025-09-09-flaky-test-corrected-cli-test-failure-reporting-flag)**
Resolved an issue where test failures were not being reported or displayed when using the --disable-quarantining flag.
**[Flaky Tests: Auto quarantine no longer applied to broken tests](/changelog/2025-09-09-flaky-tests-auto-quarantine-no-longer-applied-to-broken-tests)**
Auto-quarantining test cases have been updated to target only 'flaky' tests specifically. Previously, both 'flaky' and 'broken' tests were subject to automatic quarantine.
### August 2025
**[Flaky Tests: New endpoint and XCode 26 support](/changelog/2025-08-25-flaky-tests-new-endpoint-and-xcode-26-support)**
A new endpoint is available from the trunk api at /flaky-tests/list-unhealthy-tests for your CI/CD integrations.
### July 2025
**[Flaky Tests: Commit details in timeline](/changelog/2025-07-02-flaky-tests-commit-details-in-timeline)**
We’ve added additional details about commits that trigger test status changes to test timelines in the Flaky Tests dashboard.
### June 2025
**[Flaky Tests: Manual test status overrides](/changelog/2025-06-25-flaky-tests-manual-test-status-overrides)**
You can now manually set a test’s status to Flaky, Healthy, or Broken in the Flaky Tests dashboard.
**[Flaky Tests: Test suite and class available on test details page](/changelog/2025-06-18-test-suite-and-class-available-on-test-details-page)**
The names of a test’s suite and class are now visible on the test details page of the flaky test dashboard, along with a file search link for repos using either GitHub or Bitbucket as source control…
**[Flaky Tests: test\_case.quarantining\_setting\_changed webhook](/changelog/2025-06-11-flaky-tests-test-case-quarantining-setting-changed-webhook)**
We’re happy to announce that a new testcase.quarantiningsetting\_changed webhook is now available for all Flaky Tests users.
### May 2025
**[Flaky Tests: Improved test failure details](/changelog/2025-05-21-improved-test-failure-details)**
More changes have landed on the Flaky Tests dashboard: unique failure details on the test details page are now available in a single table view.
**[RSpec Plugin for Ruby repos](/changelog/2025-05-15-rspec-plugin-for-ruby-repos)**
The new Flaky Tests RSpec plugin is the best way to run RSpec tests and upload the results to Trunk.
### April 2025
**[Flaky Tests: Linear integration](/changelog/2025-04-25-linear-integration)**
We now have a built-in Linear integration that creates tickets with relevant test and failure information from your flaky tests.
**[Flaky Tests: Link Ticket to Test Case API](/changelog/2025-04-25-link-ticket-to-test-case-api)**
Today, we’re introducing a new Link Ticket to Test Case API that allows you to link your existing Linear or Jira tickets to tests in the Flaky Tests dashboard.
**[Flaky Tests: Track environment-specific flakes with variants](/changelog/2025-04-17-track-environment-specific-flakes-with-variants)**
Starting today, the --variant option should be used to upload test results when the same tests are run on different environments, also known as matrix builds.
**[Flaky Tests: Test detail dashboard UI improvements](/changelog/2025-04-09-flaky-tests-test-detail-dashboard-ui-improvements)**
The test details page in the Flaky Tests dashboard is getting a major UX overhaul.
### March 2025
**[Flaky Tests: Quarantined Tests API](/changelog/2025-03-26-flaky-tests-quarantined-tests-api)**
A new Quarantined Tests API is now available to all Flaky Tests users. This API fetches a list of currently quarantined tests for a given repo, allowing organizations to implement custom workflows to…
### February 2025
**[Flaky Tests: Detailed Jira integration status updates](/changelog/2025-02-26-flaky-tests-detailed-jira-integration-status-updates)**
We have an exciting update for teams using the Flaky Test Jira integration to create and track their tickets.
**[Flaky Tests: Set a custom stable branch](/changelog/2025-02-14-flaky-tests-set-a-custom-stable-branch)**
If your stable branch is not main, you can now set a custom stable branch for your repositories to improve flaky test detection.
**[Flaky Tests: Weekly reports](/changelog/2025-02-10-flaky-tests-weekly-reports)**
We're excited to introduce a new way to help your team stay on top of your repository's test health through weekly email reports.
### January 2025
**[Flaky Tests: Webhook Integration for Slack, Microsoft Teams, GitHub Issues, and Linear](/changelog/2025-01-29-flaky-tests-webhook-integration-for-slack-microsoft-teams-github-issues-and-linea)**
We're excited to introduce webhook integrations for Slack, Microsoft Teams, GitHub Issues, and Linear.
**[Flaky Tests: CODEOWNERS support](/changelog/2025-01-16-flaky-tests-codeowners-support)**
We’re thrilled to announce support for CODEOWNERS in our Flaky Tests product, which is available for both GitHub and GitLab repositories.
**[Flaky Tests: Support for Bazel build event protocol](/changelog/2025-01-14-flaky-tests-support-for-bazel-build-event-protocol)**
Trunk Flaky Tests now supports uploading test results by parsing Bazel Build Event Protocol (BEP) files.
**[Flaky Tests: Flaky test detection on merge branches](/changelog/2025-01-03-flaky-tests-flaky-test-detection-on-merge-branches)**
We’re excited to announce improved flaky test detection for merge queue users. In a merge queue, a single flaky failure will force every enqueued PR behind it to be retested, affecting every engineer…
## 2024
### December 2024
**[Flaky Tests: Webhooks for status changes](/changelog/2024-12-16-flaky-tests-webhooks-for-status-changes)**
We’re excited to announce the addition of webhooks for flaky tests, designed to help you automate your workflows for better handling of flaky tests.
### November 2024
**[Flaky Tests: New onboarding flow](/changelog/2024-11-12-flaky-tests-new-onboarding-flow)**
Hi everyone, we’ve introduced a new onboarding flow to make it easier to integrate your test framework and CI provider with Trunk.
**[Flaky Tests: Added Flaky Test commands to Trunk CLI ](/changelog/2024-11-11-flaky-tests-added-flaky-test-commands-to-trunk-cli)**
The Trunk CLI now includes commands for uploading and validating test results for Trunk Flaky Tests.
**[Flaky Tests: Dashboard improvements](/changelog/2024-11-08-flaky-tests-dashboard-improvements)**
We’re continually refining our UX with the help of our beta users’ feedback and we’ve made some changes to how Flaky Tests displays key information on the dashboards.
**[Flaky Tests: Data uploads view](/changelog/2024-11-04-flaky-tests-data-uploads-view)**
A common pain point during onboarding is the lack of transparency after the Trunk CLI uploads test results.
### October 2024
**[Flaky Tests: Improved support for iOS and Swift developers](/changelog/2024-10-28-flaky-tests-improved-support-for-ios-and-swift-developers)**
Flaky Tests now supports the XCResults format outputted by Swift projects using XCTests. You can now upload the .xcresults format to Trunk directly, without configuring a JUnit XML reporter.
**[Flaky Tests: PR test summaries](/changelog/2024-10-17-flaky-tests-pr-test-summaries)**
We're excited to introduce a powerful new feature that will help you accelerate your PR iterations: PR Test Summaries!
**[Flaky Tests: Quarantining](/changelog/2024-10-14-flaky-tests-quarantining)**
We’re excited to provide a new way for you to mitigate the negative impact of flaky tests in your repo through quarantining.
### August 2024
**[Flaky Tests: Jira Integration](/changelog/2024-08-27-flaky-tests-jira-integration)**
We’re excited to announce the latest enhancement: Jira integration for managing flaky tests. This update builds on our MVP by streamlining the issue management process within Jira.
### July 2024
**[Flaky Tests: Issue handling MVP](/changelog/2024-07-15-test-analytics-beta-issue-handling-mvp-copy-issue-details)**
Today, we are releasing our first feature to support issue handling related to flaky tests. This MVP feature is designed to streamline reporting and managing flaky tests, saving valuable time and…
### June 2024
**[Flaky Tests: UX improvements](/changelog/2024-06-28-test-analytics-beta-ux-improvements-dashboard-test-details)**
We are rolling out substantial UX improvements to the dashboard and detail views. These enhancements provide users with quick and easy access to critical information.
# Dashboard
Source: https://docs.trunk.io/flaky-tests/dashboard
Learn to find flaky tests and understand their impact using the Flaky Tests dashboard
Trunk Flaky Tests detects flaky tests by analyzing test results. The health of your tests is displayed in the Flaky Tests dashboard.
Press ⌘ K (macOS) or Ctrl K (Windows and Linux) anywhere in the Trunk app to open the command palette. Start typing to jump to Merge Queue, Flaky Tests, your account settings, or any connected repository by name.
## Repositories overview
When you navigate to `//flaky-tests`, you land on a repositories overview showing all monitored repositories at a glance.
Each repository row displays:
| Column | Description |
| -------------- | ------------------------------------------------------------------------- |
| **Tests** | Total tracked test cases in the repository (60-day window) |
| **Flaky** | Number of currently flaky test cases, with a 10-day trend sparkline |
| **Broken** | Number of currently broken test cases, with a 10-day trend sparkline |
| **Runs / Day** | Bar chart of test run volume over the last 10 days, with per-day tooltips |
A quarantine status icon appears next to each repository name when quarantining is configured:
| Icon | Meaning |
| --------------------- | ---------------------------------------------------------------------- |
| Shield | Quarantining is enabled for this repository — auto-quarantine is off |
| Shield with checkmark | Auto-quarantine is enabled — flaky tests are quarantined automatically |
Active repositories (with test data in the last 30 days) appear at the top of the list. Repositories with no recent data are collapsed under an **Inactive Repositories** section that you can expand to view.
Selecting a repository opens its detailed dashboard. If your organization has no repositories connected yet, the page redirects to onboarding. See [Quarantining](./quarantining/) to learn how to configure quarantine settings.
## Key repository metrics
![]()
![]() Trunk Flaky Tests provides key repo metrics based on the detected health status of your tests. You'll find metrics for the following information at the top of the Flaky Tests dashboard.
| Metric | Description |
| --------------------------- | ------------------------------------------------- |
| Flaky tests | Number of flaky test cases in your repo. |
| PRs blocked by failed tests | PRs that have been blocked by failed tests in CI. |
These numbers are important for understanding the overall health of your repo’s tests, how flaky tests impact your developer productivity, and the developer hours saved from quarantining tests. You can also view the trends in these numbers in the trend charts.
The trend charts display the New Test Cases added by day, as well as Test Transitions and Quarantined Runs. Test Transitions represent the number of tests that have transitioned to a particular status on a particular day, excluding new test cases (which default to a status of Healthy). If a bar shows 5 Healthy, 10 Flaky, and 2 Broken on a single day, that indicates 5 tests transitioned to Healthy, 10 to Flaky, and 2 to Broken on that day. Quarantined Runs represents the number of runs of quarantined tests by day.
## Test cases overview
Trunk Flaky Tests provides key repo metrics based on the detected health status of your tests. You'll find metrics for the following information at the top of the Flaky Tests dashboard.
| Metric | Description |
| --------------------------- | ------------------------------------------------- |
| Flaky tests | Number of flaky test cases in your repo. |
| PRs blocked by failed tests | PRs that have been blocked by failed tests in CI. |
These numbers are important for understanding the overall health of your repo’s tests, how flaky tests impact your developer productivity, and the developer hours saved from quarantining tests. You can also view the trends in these numbers in the trend charts.
The trend charts display the New Test Cases added by day, as well as Test Transitions and Quarantined Runs. Test Transitions represent the number of tests that have transitioned to a particular status on a particular day, excluding new test cases (which default to a status of Healthy). If a bar shows 5 Healthy, 10 Flaky, and 2 Broken on a single day, that indicates 5 tests transitioned to Healthy, 10 to Flaky, and 2 to Broken on that day. Quarantined Runs represents the number of runs of quarantined tests by day.
## Test cases overview
![]()
![]() You can view a table of all your test cases and their current status in Trunk Flaky Tests.
Filters can also be set on the table to narrow test results down by test status, quarantine setting, ticket status, or by the name, file, or suite name of the test case.
The table is sorted by default by the number of PRs impacted by the case, which is the best way to measure the impact of a flaky test. You can click on each test case to view [the test case’s details](./dashboard#test-case-details).
| Column | Description |
| ------------ | ----------------------------------------------------------------------------------------------------------------------------------------------------------------- |
| Tests | The variant, file path, and name of the test case. |
| Status | The health status of the test case: **Healthy**, **Flaky**, or **Broken**. Broken indicates consistent high-rate failures; Flaky indicates intermittent failures. |
| Failure Rate | The percentage of CI runs failed due to this test case. |
| PRs Impacted | The number of PRs that have been affected by this test case failing in CI. |
| Last Run | The most recent timestamp for an upload test run. |
You can view a table of all your test cases and their current status in Trunk Flaky Tests.
Filters can also be set on the table to narrow test results down by test status, quarantine setting, ticket status, or by the name, file, or suite name of the test case.
The table is sorted by default by the number of PRs impacted by the case, which is the best way to measure the impact of a flaky test. You can click on each test case to view [the test case’s details](./dashboard#test-case-details).
| Column | Description |
| ------------ | ----------------------------------------------------------------------------------------------------------------------------------------------------------------- |
| Tests | The variant, file path, and name of the test case. |
| Status | The health status of the test case: **Healthy**, **Flaky**, or **Broken**. Broken indicates consistent high-rate failures; Flaky indicates intermittent failures. |
| Failure Rate | The percentage of CI runs failed due to this test case. |
| PRs Impacted | The number of PRs that have been affected by this test case failing in CI. |
| Last Run | The most recent timestamp for an upload test run. |
Test Deletion & History
* Inactive tests disappear from the dashboard automatically after 30 days and are fully removed after 45 days. Tests cannot be manually deleted.
* Changing test identifiers (e.g., adding file paths) creates new test entries — merging with old history isn’t supported.
## Test case details
You can *click* on any of the test cases listed on the Flaky Tests dashboard to access the test case’s details. The test details page uses a tabbed layout:
* **Summary**: Run result charts and failure types grouped by unique failure reason.
* **Test History**: A searchable, paginated table of every individual test run with filtering and a detail panel.
* **Monitors**: Detection monitors configured for this test (visible when the detection engine is enabled).
* **Events**: A timeline of detection events, quarantine actions, ticketing events, and status transitions (Healthy, Flaky, Broken) for this test (visible when the detection engine is enabled). Use the category filter to scope to **Flake Detection** events to see which monitor triggered each transition.
In addition to the tabbed content, the test details page shows the test’s current status (Healthy, Flaky, or Broken), ticket status, and codeowner information.
The **Monitors** tab opens on a monitor history swimlane: one row per monitor, each showing a 30-day timeline of the classifications it produced. Bars are colored by status (or by the label's color for label monitors). By default the swimlane shows only monitors with recent activity; the **Show inactive and disabled monitors** toggle reveals rows for disabled monitors and monitors with no events in the last 30 days.
![A swimlane timeline on the Monitors tab with rows for Test Status, a failure-rate monitor, a pass-on-retry monitor, and a second failure-rate monitor, spanning May 27 to June 26.]()
![A swimlane timeline on the Monitors tab with rows for Test Status, a failure-rate monitor, a pass-on-retry monitor, and a second failure-rate monitor, spanning May 27 to June 26.]() ## Code owners
If you have a codeowners file configured in your repos, you will see who owns each flaky test in the test details view. We support code owners for [GitHub](https://docs.github.com/en/repositories/managing-your-repositorys-settings-and-features/customizing-your-repository/about-code-owners) and [GitLab](https://docs.gitlab.com/ee/user/project/codeowners/) repos.
## Code owners
If you have a codeowners file configured in your repos, you will see who owns each flaky test in the test details view. We support code owners for [GitHub](https://docs.github.com/en/repositories/managing-your-repositorys-settings-and-features/customizing-your-repository/about-code-owners) and [GitLab](https://docs.gitlab.com/ee/user/project/codeowners/) repos.
![]()
![]() This information will also be provided when creating a ticket with the [Jira integration](./management/ticketing/jira-integration) or [webhooks](./webhooks/).
## Summary tab
This information will also be provided when creating a ticket with the [Jira integration](./management/ticketing/jira-integration) or [webhooks](./webhooks/).
## Summary tab
![]()
![]() The Summary tab shows an overview of the test’s recent run results and groups past failures by unique failure type.
### Failure types
The Summary tab shows an overview of the test’s recent run results and groups past failures by unique failure type.
### Failure types
![]()
![]() The Failure Types table shows the history of past test runs grouped by unique failure types.
The Failure Type is a summary of the stack trace of the test run. You can click on the failure type to see a list of test runs labeled by branch, PR, Author, CI Job link, duration, and time.
### Failure details
You can click on any of these test runs to see the detailed stack trace:
The Failure Types table shows the history of past test runs grouped by unique failure types.
The Failure Type is a summary of the stack trace of the test run. You can click on the failure type to see a list of test runs labeled by branch, PR, Author, CI Job link, duration, and time.
### Failure details
You can click on any of these test runs to see the detailed stack trace:
![]()
![]() You can flip through the stack traces of similar failures across different test runs by clicking the left and right arrow buttons. You can also see other similar failures on this and other tests.
**Go to the CI job logs.** If you want to see full logging of the original CI job for an individual test failure, you can click **Logs** in the expanded failure details panel to go to the job’s page in your CI provider.
You can flip through the stack traces of similar failures across different test runs by clicking the left and right arrow buttons. You can also see other similar failures on this and other tests.
**Go to the CI job logs.** If you want to see full logging of the original CI job for an individual test failure, you can click **Logs** in the expanded failure details panel to go to the job’s page in your CI provider.
![]()
![]() ## Test History tab
The Test History tab gives you full visibility into every individual run of a test. Use it to investigate patterns across branches, find specific failing runs, and drill into error details.
## Test History tab
The Test History tab gives you full visibility into every individual run of a test. Use it to investigate patterns across branches, find specific failing runs, and drill into error details.
![The Test History tab with a result and quarantine filter bar, a daily runs chart, and a paginated table of individual test runs.]()
![The Test History tab with a result and quarantine filter bar, a daily runs chart, and a paginated table of individual test runs.]() ### Daily runs chart
A stacked bar chart at the top of the tab shows daily test run counts. The legend identifies four categories:
* **Green**: Pass
* **Red**: Fail
* **Blue**: Quarantined
* **Gray**: Skipped
Click and drag on the chart to select a date range, which scopes the table below to runs from the selected days. The selected range appears next to the legend with an X button to clear just the range. The **Reset** button on the filter bar clears all filters at once, including the date range.
The **Result** and **Quarantined** filters from the filter bar also apply to the chart bars. When you filter to only passing runs, for example, the chart shows only green (Pass) bars. The chart and table always reflect the same set of runs.
### Filters
A filter bar below the chart provides four independent controls:
| Filter | Description |
| ----------- | ------------------------------------------------------------------------------------------------------------------------------------------------------- |
| Result | Segmented control with **All**, **Pass**, and **Fail** to scope the table to a specific outcome. |
| Quarantined | Segmented control with **Include** (default), **Exclude**, and **Only** to control whether quarantined runs are mixed in, hidden, or shown exclusively. |
| SHA | Filter by commit hash. Matches runs whose SHA starts with the entered text. |
| Branch | Filter by branch name. Accepts exact names or glob patterns. Use `*` to match any sequence of characters and `?` to match a single character. |
Branch filter examples:
| Pattern | Matches |
| --------------- | --------------------------------------------------------------- |
| `main` | The branch named `main` exactly |
| `release/*` | All release branches, e.g. `release/1.0`, `release/2.3` |
| `feature-??` | Feature branches with a two-character suffix, e.g. `feature-v2` |
| `trunk-merge/*` | All merge queue branches |
All filters combine using AND logic, so you can use them together. For example, set **Result** to **Fail** and **Quarantined** to **Only** to surface only quarantined failures. The **Reset** button clears every filter at once, including the chart date range.
Filter state is saved in the URL, so you can share or bookmark a filtered view. The Result filter accepts `result=pass` or `result=fail`. The Quarantined filter accepts `quarantined=include`, `quarantined=exclude`, or `quarantined=only`.
### Runs table
The runs table displays a paginated list of individual test runs (25 per page) with the following columns:
| Column | Description |
| --------- | ----------------------------------------------------------------------------------------------------------------- |
| Timestamp | When the test ran, displayed in your local time zone. |
| Duration | How long the test took to execute. |
| PR | The pull request number associated with the run, e.g. `#1234`. Empty for runs that aren't tied to a PR. |
| Branch | The branch the test ran against, e.g. `main`, `feature/x`, or `trunk-merge/pr-1234/...` for merge queue branches. |
| Commit | The first 7 characters of the commit SHA. |
Each row has a colored left border indicating the run's outcome. Quarantined runs always show blue, regardless of whether the run passed or failed. For non-quarantined runs, the border is green for pass, red for fail, orange for error, and a neutral gray for any other state.
### Run detail panel
Click any row in the runs table to open a detail panel on the right side of the page. The panel shows:
* **Run header**: Timestamp, a result badge (Pass, Fail, Error, or Quarantined), and run duration.
* **Source control**: A CI job link (with the provider's icon, the job name, and the CI duration), the linked pull request, branch, and commit. Merge queue runs also include a **View in Merge Queue** link.
* **Error details**: For failed, errored, or quarantined runs, an optional AI summary of the failure followed by the raw error text or stack trace.
### Debugging a flaky test from the UI
The Summary tab, failure details, and Test History tab give you most of what you need to investigate a flaky test. A few gaps come up often enough to call out, along with the workarounds that exist today.
#### Drilling into the right parallel worker
The CI job link in the run detail panel points to the parent build, not the specific worker that produced the failure. If your CI runs a single job, this is fine. If you fan out across many parallel workers (some customers run 40+), you'll have to click through workers in the CI provider to find the one whose log contains the failure.
To shortcut this, capture the per-worker URL at test run time and include it in your JUnit output so it surfaces in the failure detail. Most CI providers expose an environment variable for the running job's URL:
| CI provider | Environment variable |
| -------------- | ------------------------------------------------------------------------- |
| CircleCI | `CIRCLE_BUILD_URL` |
| GitHub Actions | `${GITHUB_SERVER_URL}/${GITHUB_REPOSITORY}/actions/runs/${GITHUB_RUN_ID}` |
| Buildkite | `BUILDKITE_BUILD_URL` |
| GitLab CI | `CI_JOB_URL` |
Read the value at the start of the test job and append it to a test property, log line, or system-out block in your JUnit XML. The link then appears alongside the failure in Trunk instead of routing to the parent build.
#### Bundle Upload ID lookups
When the `trunk-analytics-cli` uploads a bundle, it prints a Bundle Upload ID to the job log. This ID does not currently map to a URL in the web app — there's no search field for it in the dashboard. If you need to trace a specific upload back to its run data, contact support with the Bundle Upload ID.
### Daily runs chart
A stacked bar chart at the top of the tab shows daily test run counts. The legend identifies four categories:
* **Green**: Pass
* **Red**: Fail
* **Blue**: Quarantined
* **Gray**: Skipped
Click and drag on the chart to select a date range, which scopes the table below to runs from the selected days. The selected range appears next to the legend with an X button to clear just the range. The **Reset** button on the filter bar clears all filters at once, including the date range.
The **Result** and **Quarantined** filters from the filter bar also apply to the chart bars. When you filter to only passing runs, for example, the chart shows only green (Pass) bars. The chart and table always reflect the same set of runs.
### Filters
A filter bar below the chart provides four independent controls:
| Filter | Description |
| ----------- | ------------------------------------------------------------------------------------------------------------------------------------------------------- |
| Result | Segmented control with **All**, **Pass**, and **Fail** to scope the table to a specific outcome. |
| Quarantined | Segmented control with **Include** (default), **Exclude**, and **Only** to control whether quarantined runs are mixed in, hidden, or shown exclusively. |
| SHA | Filter by commit hash. Matches runs whose SHA starts with the entered text. |
| Branch | Filter by branch name. Accepts exact names or glob patterns. Use `*` to match any sequence of characters and `?` to match a single character. |
Branch filter examples:
| Pattern | Matches |
| --------------- | --------------------------------------------------------------- |
| `main` | The branch named `main` exactly |
| `release/*` | All release branches, e.g. `release/1.0`, `release/2.3` |
| `feature-??` | Feature branches with a two-character suffix, e.g. `feature-v2` |
| `trunk-merge/*` | All merge queue branches |
All filters combine using AND logic, so you can use them together. For example, set **Result** to **Fail** and **Quarantined** to **Only** to surface only quarantined failures. The **Reset** button clears every filter at once, including the chart date range.
Filter state is saved in the URL, so you can share or bookmark a filtered view. The Result filter accepts `result=pass` or `result=fail`. The Quarantined filter accepts `quarantined=include`, `quarantined=exclude`, or `quarantined=only`.
### Runs table
The runs table displays a paginated list of individual test runs (25 per page) with the following columns:
| Column | Description |
| --------- | ----------------------------------------------------------------------------------------------------------------- |
| Timestamp | When the test ran, displayed in your local time zone. |
| Duration | How long the test took to execute. |
| PR | The pull request number associated with the run, e.g. `#1234`. Empty for runs that aren't tied to a PR. |
| Branch | The branch the test ran against, e.g. `main`, `feature/x`, or `trunk-merge/pr-1234/...` for merge queue branches. |
| Commit | The first 7 characters of the commit SHA. |
Each row has a colored left border indicating the run's outcome. Quarantined runs always show blue, regardless of whether the run passed or failed. For non-quarantined runs, the border is green for pass, red for fail, orange for error, and a neutral gray for any other state.
### Run detail panel
Click any row in the runs table to open a detail panel on the right side of the page. The panel shows:
* **Run header**: Timestamp, a result badge (Pass, Fail, Error, or Quarantined), and run duration.
* **Source control**: A CI job link (with the provider's icon, the job name, and the CI duration), the linked pull request, branch, and commit. Merge queue runs also include a **View in Merge Queue** link.
* **Error details**: For failed, errored, or quarantined runs, an optional AI summary of the failure followed by the raw error text or stack trace.
### Debugging a flaky test from the UI
The Summary tab, failure details, and Test History tab give you most of what you need to investigate a flaky test. A few gaps come up often enough to call out, along with the workarounds that exist today.
#### Drilling into the right parallel worker
The CI job link in the run detail panel points to the parent build, not the specific worker that produced the failure. If your CI runs a single job, this is fine. If you fan out across many parallel workers (some customers run 40+), you'll have to click through workers in the CI provider to find the one whose log contains the failure.
To shortcut this, capture the per-worker URL at test run time and include it in your JUnit output so it surfaces in the failure detail. Most CI providers expose an environment variable for the running job's URL:
| CI provider | Environment variable |
| -------------- | ------------------------------------------------------------------------- |
| CircleCI | `CIRCLE_BUILD_URL` |
| GitHub Actions | `${GITHUB_SERVER_URL}/${GITHUB_REPOSITORY}/actions/runs/${GITHUB_RUN_ID}` |
| Buildkite | `BUILDKITE_BUILD_URL` |
| GitLab CI | `CI_JOB_URL` |
Read the value at the start of the test job and append it to a test property, log line, or system-out block in your JUnit XML. The link then appears alongside the failure in Trunk instead of routing to the parent build.
#### Bundle Upload ID lookups
When the `trunk-analytics-cli` uploads a bundle, it prints a Bundle Upload ID to the job log. This ID does not currently map to a URL in the web app — there's no search field for it in the dashboard. If you need to trace a specific upload back to its run data, contact support with the Bundle Upload ID.
Uploads are processed periodically, not in real time, so a run you just uploaded may not appear immediately. If it isn't visible yet, wait and refresh before assuming the upload failed.
#### CI artifact retention
CI providers typically retain build artifacts (screenshots, videos, traces) for one to two days. Flaky test tickets often take longer than that to investigate and resolve, which means the artifacts that would have helped explain the failure may already be gone by the time you open the ticket.
If artifacts matter for your debugging flow, store them outside the CI provider's retention window:
* Upload screenshots, videos, and traces to S3 (or another long-lived store) as a CI step, and include the object URL in the JUnit output alongside the per-worker URL described above.
* For especially noisy tests, attach the artifact URL to the Jira/Linear ticket Trunk opens via the [ticketing integration](./management/ticketing/jira-integration).
#### Known limitations
A few framework-specific quirks are worth knowing about up front.
**RSpec `MultipleExceptionError`**
When an example raises multiple exceptions (for example, an error in the test body plus a separate error in an `after` hook), RSpec wraps them in `RSpec::Core::MultipleExceptionError`. The `rspec_trunk_flaky_tests` gem already uploads the full set of captured exceptions; the failure detail view currently renders only one of them. To see all of them, check the CI job logs for the full exception list when you encounter this error type.
**Go subtests with 0ms duration**
`go test` reports the top-level test duration but does not always emit per-subtest durations. When a subtest's duration is reported as 0ms, timing-based signals — including the AI failure analysis — have less to work with for that case. If timing context matters for your investigation, post-process your JUnit XML to reflect real subtest durations before uploading, or rely on the raw stack trace rather than the AI summary.
# Failure Count Monitor
Source: https://docs.trunk.io/flaky-tests/detection/failure-count-monitor
Detect flaky or broken tests as soon as they accumulate a configured number of failures
The failure count monitor flags a test the moment it accumulates a configured number of failures on monitored branches within a rolling time window. Unlike the failure rate monitor, which requires a failure *rate* calculated over many runs, the failure count monitor reacts to individual failures without needing a minimum sample size or a percentage calculation.
This makes it well-suited for stable branches like `main` where any test failure is unexpected and worth investigating immediately.
## When to Use This Monitor
Use the failure count monitor when you want immediate visibility into test failures on branches that should be green. Common scenarios:
* **Stable branch alerting:** Flag any test that fails on `main`, even once. On a branch where all tests should pass, a single failure is a meaningful signal.
* **Post-merge regression detection:** Catch tests that start failing after a merge, before the failure rate accumulates enough data for a failure rate monitor to trigger.
* **High-confidence branches:** Monitor merge queue or release branches where failures are suspicious by definition.
If you need to detect patterns of intermittent failure over time (e.g., a test that fails 20% of the time), use a [failure rate monitor](./failure-rate-monitor) instead. If you want to catch tests that fail and then pass on retry within a single commit, [pass-on-retry](./pass-on-retry-monitor) handles that automatically.
## How It Works
The monitor counts the number of test failures on configured branches within a rolling time window. When a test reaches the configured failure count, the monitor activates and runs its configured [action](#action) — by default, flagging the test as flaky or broken.
### Example
You configure a failure count monitor with:
| Setting | Value |
| ------------------ | ---------- |
| Detection type | Broken |
| Failure count | 1 |
| Window | 30 minutes |
| Resolution timeout | 2 hours |
| Branches | `main` |
A developer merges a change that breaks `test_checkout`. Here is what happens:
1. `test_checkout` fails on the next CI run on `main`.
2. The monitor sees 1 failure within the 30-minute window, which meets the configured failure count of 1.
3. `test_checkout` is immediately flagged as **broken**.
4. The developer identifies the issue and merges a correction.
5. Two hours pass with no new failures for `test_checkout`.
6. The monitor automatically resolves the test back to **healthy**.
If another test, `test_signup`, also failed during that window, it would be flagged independently. Each test is evaluated on its own.
## Configuration
### Failure Count
The number of failures required to trigger detection. The default is **1**, meaning any single failure on a monitored branch flags the test.
Setting this higher (e.g., 3) requires multiple failures before the monitor reacts. This is useful if you want to filter out one-off infrastructure blips while still catching tests that fail repeatedly in a short window.
### Window Duration
The rolling time window over which failures are counted. Only test failures within this window contribute to the failure count.
A shorter window (e.g., 30 minutes) limits detection to very recent failures. A longer window (e.g., 6 hours) catches failures that are spread out over time but still accumulating.
The window should be long enough to capture the failures you care about but short enough that old failures roll off naturally. For a monitor with a failure count of 1, the window mainly controls how quickly a detection event is created after a failure. In practice, the pipeline evaluates frequently, so detection is near-immediate regardless of window size.
### Resolution Timeout
How long a flagged test must go without any new failures before it is automatically resolved. This is the only way a failure count monitor resolves — there is no "recovery rate" or sample-based resolution like the failure rate monitor, and no stale timeout. If a test stops running entirely (e.g., it was deleted or renamed), it stays flagged until the resolution timeout elapses from its last observed failure.
For example, with a resolution timeout of 2 hours, a test that was flagged at 3:00 PM will resolve at 5:00 PM if no new failures occur. If a new failure arrives at 4:30 PM, the clock resets, and the test will not resolve until 6:30 PM.
The resolution timeout must be at least as long as the detection window. If the window is 30 minutes, the resolution timeout should be 30 minutes or longer.
Choose a resolution timeout that gives your team enough time to verify a fix has landed. A short timeout (e.g., 30 minutes) resolves quickly but may prematurely clear tests that fail intermittently. A longer timeout (e.g., 24 hours) is more conservative and ensures the test stays flagged until it has been clean for a full day.
### Branch Scope
Which branches the monitor evaluates. You can specify branch names or glob patterns. Only test failures on matching branches count toward the failure count.
Branch patterns work the same way as [failure rate monitor branch patterns](./failure-rate-monitor#branch-pattern-syntax), including glob syntax and merge queue patterns. Refer to that section for pattern syntax, examples, and tips.
### Action
What happens when the monitor activates on a test. You pick the action at creation and can switch it at any time.
**Classify test status (default).** The test's status is set according to the monitor's **detection type**, and restored to healthy when the monitor resolves. The detection type is either:
* **Flaky** — appropriate when failures on the monitored branch are likely non-deterministic. A test that fails once on `main` but passes on retry is probably flaky.
* **Broken** — appropriate when failures indicate a real regression. If a test fails on `main` and you expect it to keep failing until someone fixes it, broken is the right classification.
**Apply labels.** The configured labels are added to the test while the monitor is active. The test's health status is not changed by this monitor. See [Automatic labeling from monitors](../management/test-labels#automatic-labeling-from-monitors) for how to configure and what to expect.
## Preview Panel
When you create or edit a failure count monitor, a **Preview** panel appears on the right side of the dialog on larger screens. The preview updates as you adjust the monitor's settings, giving you a live look at what the monitor would detect against your current branch data.
Once the monitor configuration produces detections, the panel shows a **Failing tests** list. Each row displays the test name as a link to its detail page, along with its failure count. Counts that meet or exceed your configured failure count are highlighted in red; counts below appear in muted text.
You can search the list by test name or parent test name. The search is case-insensitive and filters as you type. If no tests match your search term, the list shows a "No tests match" message. When more than 100 tests are detected, only the first 100 are shown with a notice to narrow your search.
### Status Filter
A **status filter dropdown** in the preview panel lets you filter the test list to any combination of statuses: **Healthy**, **Flaky**, and **Broken**. By default, all statuses are shown.
Filtering to **Healthy** is the most useful view: it shows tests that are currently healthy but would be flagged by this monitor if created with the current settings. This lets you see the new coverage the monitor adds without noise from tests already detected by other monitors.
Selecting multiple statuses (for example, Healthy and Flaky) shows tests matching any of the selected statuses.
When a status filter is active, the info tooltip in the panel header shows "X of Y tests" to indicate how many tests are visible relative to the total that match the monitor configuration.
If no tests match the active filter, the empty state includes a hint to clear the filter.
### Large Repo Truncation
For repositories with a large number of matching tests, preview results may be truncated. When this happens, an amber warning appears in the panel. The truncation applies to the list of tests shown, not to the underlying detection logic — the monitor evaluates all matching tests when active.
## Muting
You can temporarily mute a failure count monitor for a specific test case. See [Muting monitors](./index#muting-monitors) for details.
## Choosing Between Monitors
| Scenario | Recommended monitor |
| ---------------------------------------------------- | ---------------------------------------------------- |
| Any failure on `main` should be flagged immediately | **Failure count** with count = 1 |
| Tests failing at an elevated rate over many runs | **Threshold** with appropriate activation percentage |
| A test fails then passes on retry in the same commit | **Pass-on-retry** (enabled by default) |
| Consistently failing tests (80%+ failure rate) | **Threshold** with broken detection type |
| Quick alerting on merge queue failures | **Failure count** scoped to merge queue branches |
# Failure Rate Monitor
Source: https://docs.trunk.io/flaky-tests/detection/failure-rate-monitor
Detect flaky or broken tests based on failure rate over a configurable time window
The failure rate monitor detects tests based on failure rate over a rolling time window. Unlike pass-on-retry, which looks for a specific pattern on a single commit, the failure rate monitor identifies tests that fail too often over a period of time, even if no individual failure looks like a retry.
You can create multiple failure rate monitors with different configurations. This is how you tailor detection to different branches, test volumes, and sensitivity levels.
## How It Works
The monitor periodically calculates the failure rate for each test within a time window you define. If the rate meets or exceeds your activation threshold and the test has enough runs to be statistically meaningful, the monitor activates on the test and runs its configured [action](#action) — by default, flagging the test as flaky or broken.
![Test runs resolve pass or fail while a failure-rate meter rises past the 30% activation line and is flagged flaky, then falls below the 15% resolution line and resolves to healthy.]() ### Example
You configure a failure rate monitor with:
| Setting | Value |
| -------------------- | ------- |
| Detection type | Flaky |
| Activation threshold | 30% |
| Window | 6 hours |
| Minimum sample size | 50 runs |
| Branches | `main` |
Over the last 6 hours, here's what the monitor observes:
| Test | Runs | Failures | Failure rate | Meets min sample? | Result |
| --------------- | ---- | -------- | ------------ | ----------------- | ------------------------------------------------- |
| `test_checkout` | 120 | 42 | 35% | Yes (120 ≥ 50) | **Flagged as flaky** — rate exceeds 30% threshold |
| `test_signup` | 8 | 3 | 37.5% | No (8 \< 50) | **Not flagged** — insufficient data |
`test_checkout` is flagged because its 35% failure rate exceeds the 30% threshold and it has enough runs to be statistically meaningful. `test_signup` has a higher failure rate but is skipped entirely — the monitor needs at least 50 runs before making a call.
## Configuration
### Activation Threshold
The failure rate that triggers detection, expressed as a percentage. A test is flagged when its failure rate meets or exceeds this value within the time window.
For flaky monitors, setting this lower (e.g., 10%) catches more intermittent failures but may produce false positives. Setting it higher (e.g., 50%) is more conservative and only flags tests that fail frequently.
For broken monitors, a high threshold (e.g., 80–100%) is appropriate — you want to catch tests that are consistently failing, not ones with occasional failures.
### Resolution Threshold
The failure rate a test must drop below to be resolved. If not set, it defaults to the activation threshold, meaning a test resolves as soon as its failure rate drops below the activation level.
Setting this lower than the activation threshold creates a buffer that prevents tests from flapping between flagged and resolved. For example, if you activate at 30% and resolve at 15%, a test flagged at 30% must improve to below 15% before it's marked healthy again. A test hovering at 20% failure rate stays flagged rather than flipping back and forth.
The gap between activation (30%) and resolution (15%) is the buffer zone. A test with a failure rate in this range keeps its current status: a healthy test won't be flagged, but a test already flagged won't be resolved either.
### Window Duration
The rolling time window (in hours) over which failure rate is calculated. Only test runs within this window are considered.
A shorter window (e.g., 1 hour) reacts quickly to recent failures but may miss patterns that play out over longer periods. A longer window (e.g., 24 hours) smooths out short-term spikes and gives a more stable picture, but takes longer to detect new issues and longer to resolve.
### Minimum Sample Size
The minimum number of test runs required within the time window before the monitor will evaluate a test. Tests with fewer runs are skipped entirely. They won't be flagged or resolved until enough data accumulates.
This prevents the monitor from making decisions on insufficient data. A test that ran 3 times with 2 failures is a 66% failure rate, but that's not enough data to be confident.
The right minimum depends on how often a test actually runs on the branches you're monitoring. To get a sense of run frequency, open the test's **Test History** and filter to the branch you care about — this shows how many runs accumulate over any given period. If your tests run hundreds of times per day, a minimum of 50 to 100 is reasonable. If tests only run a few times per day, a lower minimum may be necessary, but lower minimums mean less statistical confidence.
### Stale Timeout
How long (in hours) a flagged test can go without any runs before it's automatically resolved as stale. This clears out tests that have been deleted, renamed, or are no longer part of your test suite.
When not set, flagged tests remain in their detected state indefinitely until they run enough times to recover through the normal threshold check. Setting a stale timeout (e.g., 24 hours) keeps abandoned tests from cluttering your test list.
To remove a previously set stale timeout, clear the field when editing the monitor. The monitor will then keep tests flagged indefinitely until they recover through the normal threshold check.
A test resolved as stale is no longer being tracked by this monitor. If the test starts running again and exceeds the activation threshold, it will be re-flagged.
### Example
You configure a failure rate monitor with:
| Setting | Value |
| -------------------- | ------- |
| Detection type | Flaky |
| Activation threshold | 30% |
| Window | 6 hours |
| Minimum sample size | 50 runs |
| Branches | `main` |
Over the last 6 hours, here's what the monitor observes:
| Test | Runs | Failures | Failure rate | Meets min sample? | Result |
| --------------- | ---- | -------- | ------------ | ----------------- | ------------------------------------------------- |
| `test_checkout` | 120 | 42 | 35% | Yes (120 ≥ 50) | **Flagged as flaky** — rate exceeds 30% threshold |
| `test_signup` | 8 | 3 | 37.5% | No (8 \< 50) | **Not flagged** — insufficient data |
`test_checkout` is flagged because its 35% failure rate exceeds the 30% threshold and it has enough runs to be statistically meaningful. `test_signup` has a higher failure rate but is skipped entirely — the monitor needs at least 50 runs before making a call.
## Configuration
### Activation Threshold
The failure rate that triggers detection, expressed as a percentage. A test is flagged when its failure rate meets or exceeds this value within the time window.
For flaky monitors, setting this lower (e.g., 10%) catches more intermittent failures but may produce false positives. Setting it higher (e.g., 50%) is more conservative and only flags tests that fail frequently.
For broken monitors, a high threshold (e.g., 80–100%) is appropriate — you want to catch tests that are consistently failing, not ones with occasional failures.
### Resolution Threshold
The failure rate a test must drop below to be resolved. If not set, it defaults to the activation threshold, meaning a test resolves as soon as its failure rate drops below the activation level.
Setting this lower than the activation threshold creates a buffer that prevents tests from flapping between flagged and resolved. For example, if you activate at 30% and resolve at 15%, a test flagged at 30% must improve to below 15% before it's marked healthy again. A test hovering at 20% failure rate stays flagged rather than flipping back and forth.
The gap between activation (30%) and resolution (15%) is the buffer zone. A test with a failure rate in this range keeps its current status: a healthy test won't be flagged, but a test already flagged won't be resolved either.
### Window Duration
The rolling time window (in hours) over which failure rate is calculated. Only test runs within this window are considered.
A shorter window (e.g., 1 hour) reacts quickly to recent failures but may miss patterns that play out over longer periods. A longer window (e.g., 24 hours) smooths out short-term spikes and gives a more stable picture, but takes longer to detect new issues and longer to resolve.
### Minimum Sample Size
The minimum number of test runs required within the time window before the monitor will evaluate a test. Tests with fewer runs are skipped entirely. They won't be flagged or resolved until enough data accumulates.
This prevents the monitor from making decisions on insufficient data. A test that ran 3 times with 2 failures is a 66% failure rate, but that's not enough data to be confident.
The right minimum depends on how often a test actually runs on the branches you're monitoring. To get a sense of run frequency, open the test's **Test History** and filter to the branch you care about — this shows how many runs accumulate over any given period. If your tests run hundreds of times per day, a minimum of 50 to 100 is reasonable. If tests only run a few times per day, a lower minimum may be necessary, but lower minimums mean less statistical confidence.
### Stale Timeout
How long (in hours) a flagged test can go without any runs before it's automatically resolved as stale. This clears out tests that have been deleted, renamed, or are no longer part of your test suite.
When not set, flagged tests remain in their detected state indefinitely until they run enough times to recover through the normal threshold check. Setting a stale timeout (e.g., 24 hours) keeps abandoned tests from cluttering your test list.
To remove a previously set stale timeout, clear the field when editing the monitor. The monitor will then keep tests flagged indefinitely until they recover through the normal threshold check.
A test resolved as stale is no longer being tracked by this monitor. If the test starts running again and exceeds the activation threshold, it will be re-flagged.
Skipped tests count as not being run. If you have a stale timeout configured and a test starts being skipped rather than executed, the monitor will treat it as having no runs and resolve it as stale once the timeout elapses.
### Branch Scope
Which branches the monitor evaluates. You can specify up to 10 branch patterns. Only test runs on matching branches are included in the failure rate calculation. Runs across all matching patterns are pooled together — the failure rate is calculated from the combined set of runs, not evaluated per-pattern individually. This means a monitor scoped to `main` and `release/*` will look at all runs on any of those branches together when determining the failure rate.
**Branch pattern syntax.** Branch patterns use glob-style matching with two special characters:
| Character | Meaning | Regex equivalent |
| --------- | -------------------------------------------- | ---------------- |
| `*` | Zero or more of any character, including `/` | `.*` |
| `?` | Exactly one of any character | `.` |
All other characters are matched literally. Special regex characters (like `.`, `+`, `(`, `)`, `[`, `]`) are treated as literal characters in patterns, not as regex operators. You don't need to escape them.
Unlike some glob implementations, `*` matches across `/` separators. The pattern `feature/*` matches both `feature/login` and `feature/api/auth`.
**Pattern examples:**
| Pattern | Matches | Does not match |
| --------------- | ----------------------------------- | ------------------------------------------------------ |
| `main` | `main` | `main-v2`, `maint` |
| `feature/*` | `feature/login`, `feature/api/auth` | `feature` (no trailing path), `features/x` |
| `release-?.?.?` | `release-1.2.3` | `release-10.2.3` (10 is two characters), `release-1.2` |
| `*-hotfix` | `prod-hotfix`, `release/v1-hotfix` | `hotfix`, `hotfix-1` |
| `*` | All branches | |
A pattern with no special characters matches that exact branch name only. For example, `main` matches the branch named `main` and nothing else.
**Stable branch patterns.** For your main or stable branch, use the exact branch name:
| Your stable branch | Pattern |
| ------------------ | --------- |
| `main` | `main` |
| `master` | `master` |
| `develop` | `develop` |
**Merge queue branch patterns.** If you use a merge queue, your queue creates temporary branches to test changes before merging. Each merge queue product uses a different branch naming convention:
| Merge queue | Branch pattern | Example branches matched |
| -------------------- | --------------------- | ------------------------------------------ |
| Trunk Merge Queue | `trunk-merge/*` | `trunk-merge/main/1`, `trunk-merge/main/2` |
| GitHub Merge Queue | `gh-readonly-queue/*` | `gh-readonly-queue/main/pr-123-abc` |
| Graphite Merge Queue | `graphite-merge/*` | `graphite-merge/main/1` |
GitLab Merge Trains run on the target branch directly rather than creating separate branches. To monitor merge train runs, scope your monitor to the target branch (e.g., `main`).
**Tips for branch scoping:**
* You can add up to **10 patterns** per monitor. A test run is included if its branch matches any of the patterns.
* Since patterns can't express "everything except a branch," a practical approach is to create **separate monitors**: one scoped to `main` with strict settings, and another scoped to your PR branch naming patterns (e.g., `feature/*`, `fix/*`) with more lenient settings.
* `**` is treated as two consecutive `*` wildcards, which is functionally identical to a single `*`. There is no special multi-segment matching behavior.
### Action
What happens when the monitor activates on a test. You pick the action at creation and can switch it at any time.
**Classify test status (default).** The test's status is set according to the monitor's **detection type**, and restored to healthy when the monitor resolves. The detection type is either:
* **Flaky** — for tests that fail intermittently (e.g., 20–50% failure rate). These are typically caused by timing issues, shared state, or non-deterministic behavior. Flaky tests are often quarantined while you investigate the root cause.
* **Broken** — for tests that fail consistently at a high rate (e.g., 80%+ failure rate). These usually indicate a real regression — something in the code or environment is genuinely broken and needs a fix. Broken tests represent real failures that should be fixed, not hidden.
**Apply labels.** The configured labels are added to the test while the monitor is active. The test's health status is not changed by this monitor. See [Automatic labeling from monitors](../management/test-labels#automatic-labeling-from-monitors) for how to configure and what to expect.
## Preview Panel
When creating or editing a failure rate monitor, a preview panel shows which tests the current configuration would flag based on recent data. The panel is split into two sections: **Current** and **Proposed**.
* **Current** shows tests flagged by the existing configuration (if editing an existing monitor).
* **Proposed** shows tests that would be flagged with the settings currently entered in the form.
The Current section is collapsed by default, so the Proposed view is immediately visible when you open the form.
### Status Filter
A **status filter dropdown** in the preview panel lets you filter the test list to any combination of statuses: **Healthy**, **Flaky**, and **Broken**. By default, all statuses are shown.
Filtering to **Healthy** shows tests that are currently healthy but would be flagged by this monitor — the new coverage it adds beyond tests already detected. Filtering to other statuses, or combining them, adjusts the visible list without affecting the underlying detection counts.
When a filter is active, the info tooltip shows "X of Y tests" to indicate how many tests are visible relative to the total matching the configuration. If no tests match the active filter, the empty state includes a hint to clear the filter.
The status filter applies to the **Proposed** section. The not-in-window count in the Current section reflects the full unfiltered result set and is not affected by the filter.
## Muting
You can temporarily mute a failure rate monitor for a specific test case. See [Muting monitors](./index#muting-monitors) for details.
## Recommended Configurations
A common setup is to pair two failure rate monitors — one to catch broken tests quickly and one to catch flaky tests over a longer window:
| Monitor | Detection type | Activation threshold | Window | Purpose |
| -------------- | -------------- | -------------------- | ----------- | -------------------------------------------------------------------------------------- |
| Broken on main | Broken | 80–100% | 1–6 hours | Catch tests that are reliably failing — real regressions that need immediate attention |
| Flaky on main | Flaky | 20–50% | 12–72 hours | Catch intermittently failing tests — candidates for investigation or quarantine |
You can create as many monitors as you need. For example, you might want separate monitors for your main branch and pull request branches, or different thresholds for different levels of severity. The following sections provide starting points for common scenarios.
**Choosing a window:** The window duration should match how often tests run on the branches you're monitoring. A window needs enough runs to reach the minimum sample size before it can flag anything. If tests run infrequently, a longer window is necessary to accumulate enough data. A narrower window reacts more quickly — spikes of failures roll off faster, and tests recover to healthy more quickly once the underlying problem is resolved.
### Main Branch: Catch Flakiness Early
Failures on your stable branch are a strong signal. Tests should be passing before code is merged, so failures here are unexpected and likely indicate flakiness.
| Setting | Suggested value | Why |
| -------------------- | ------------------------------------- | ---------------------------------------------------------------- |
| Activation threshold | 10 to 20% | Low threshold catches subtle flakiness early |
| Resolution threshold | 5 to 10% | Requires clear improvement before resolving |
| Window | 6 to 24 hours | Long enough to accumulate data, short enough to catch new issues |
| Min sample size | 20 to 50 | Depends on how often your tests run on main |
| Branches | `main` (or `master`, `develop`, etc.) | Use the exact name of your stable branch |
### Pull Requests: Catch Broken Tests
On PR branches, tests are expected to fail — that's part of active development. Analyzing failure rate for flakiness on PRs is generally not productive because a new failing test is likely caused by the code change under review, not non-deterministic behavior. Pass-on-retry already handles real flakiness on PRs: if a test fails and then passes on retry within the same commit, it will be detected regardless of branch.
If you do want a failure rate monitor on PRs, scope it to catch **broken** tests rather than flaky ones — tests that are consistently failing at a high rate across many PRs, which may indicate a persistent regression or a broken test environment.
| Setting | Suggested value | Why |
| -------------------- | ------------------------------------ | ----------------------------------------------------------------------------- |
| Detection type | Broken | Focus on consistently failing tests, not intermittent ones |
| Activation threshold | 70 to 90% | High threshold distinguishes real breakage from expected development failures |
| Resolution threshold | 40 to 50% | Wide buffer prevents flapping |
| Window | 12 to 24 hours | Longer window smooths out short-lived development failures |
| Min sample size | 30 to 100 | Higher minimum avoids flagging tests that only ran a few times on PRs |
| Branches | `feature/*`, `fix/*`, `dependabot/*` | Match your team's PR branch naming conventions |
Since branch patterns can't express "everything except main," create one monitor scoped to `main` with strict settings and a second monitor scoped to your PR branch naming patterns with more lenient settings.
### Merge Queue: Strict Monitoring
Merge queue branches test code that has already passed PR checks. Failures here are suspicious. If you use a merge queue, consider a dedicated monitor with settings similar to or stricter than your main branch monitor.
When sizing your window and minimum sample size, consider how many PRs your repo merges per day. For example, if your team merges 10 PRs per day, a 12-hour window will accumulate roughly 5 merge queue runs — setting a minimum sample size of 10 would mean the rule never has enough data to evaluate. Match your minimum sample size to a realistic run count within your chosen window.
| Setting | Suggested value | Why |
| -------------------- | ---------------------------------------- | --------------------------------------------------------------- |
| Activation threshold | 10 to 15% | Low threshold, failures here are unexpected |
| Resolution threshold | 5% | Strict recovery |
| Window | 6 to 12 hours | Shorter window for faster detection |
| Min sample size | 5 to 15 | Size to how many merge queue runs accumulate in your window |
| Branches | `trunk-merge/*` or `gh-readonly-queue/*` | Use the pattern for your merge queue provider (see table above) |
Common branch patterns for merge queues:
| Merge queue | Branch pattern |
| ------------------ | --------------------- |
| Trunk Merge Queue | `trunk-merge/*` |
| GitHub Merge Queue | `gh-readonly-queue/*` |
### Other Patterns
* **Release branches:** A monitor scoped to `release/*` with strict thresholds catches flakiness before it ships.
* **Nightly or scheduled builds:** If you run comprehensive test suites on a schedule, a monitor with a longer window and higher minimum sample size can catch slow-burn flakiness that doesn't show up in faster CI runs.
# Flag as Flaky
Source: https://docs.trunk.io/flaky-tests/detection/flag-as-flaky
Manually mark a test as flaky from the test detail page
Manually mark a test as flaky when you know it's unreliable but automated monitors haven't detected it yet — or when you want to keep a test classified as flaky while monitors consider it healthy.
## When to Use It
* A test is intermittently failing but hasn't been flagged by threshold or pass-on-retry monitors.
* You want to immediately quarantine a test while investigating.
* You've identified a flaky test through code review or local observation.
## How It Works
### Flagging a Test
1. Navigate to the test detail page for the test you want to flag.
2. Click the **Flag as Flaky** button in the header row, next to the status badge.
3. In the popover that appears, optionally add a reason (up to 256 characters) explaining why you're flagging it.
4. Click **Flag** to confirm.
Once flagged:
* The test is immediately marked as **flaky**, even if no automated monitor has detected it.
* An amber banner appears below the header showing who flagged it, when, and the reason (if provided).
* The flag is additive — if automated monitors later detect the test as flaky too, both signals coexist.
A manual flag does not override a **broken** status. Broken always takes precedence over flaky, so if an active monitor classifies the test as broken, the test shows as broken until that monitor resolves or is [muted](./index#muting-monitors). While a test is broken, the **Flag as Flaky** button is disabled — if you believe the broken classification is incorrect, [mute the monitor](./index#muting-monitors) or update its configuration instead. You can still remove an existing flag while the test is broken.
### Removing the Flag
1. On the test detail page, find the amber "Manually flagged as flaky" banner.
2. Click the **Remove flag** button on the right side of the banner.
3. Confirm by clicking **Remove flag** in the popover.
After removing:
* The test's status reverts to whatever the automated monitors determine.
* If monitors are still detecting the test as flaky, it remains flaky. The flag removal only clears the manual override.
## Relationship to Monitors
The "Flag as Flaky" action is separate from automated monitors (threshold-based, pass-on-retry) and does not appear in the Monitors tab, but it participates in the same [status resolution](./index#how-monitors-work) as health classification monitors: the most severe status wins, and broken outranks flaky. If a test's status looks wrong — for example, it shows as broken when you believe it's merely flaky — [mute](./index#muting-monitors) or reconfigure the monitor responsible rather than reaching for the flag.
| Scenario | Test status |
| --------------------------------------------- | -------------------------------- |
| No monitors active, no flag | Healthy |
| Flaky monitors active, no flag | Flaky (detected) |
| No monitors active, flag set | Flaky (manually flagged) |
| Flaky monitors active, flag set | Flaky (both) |
| Broken monitor active, flag set | Broken (broken takes precedence) |
| Broken monitor resolves or is muted, flag set | Flaky (manually flagged) |
| Flag removed, flaky monitors still active | Flaky (detected) |
| Flag removed, monitors inactive | Healthy |
## Flag History
All flag and unflag actions are recorded as events. You can view the history by opening the Flag History panel from the test detail page. Each entry shows who performed the action, when, and the reason (if one was provided).
# Flake Detection
Source: https://docs.trunk.io/flaky-tests/detection/index
Learn how Trunk detects and labels flaky and broken tests
Flake Detection automatically identifies problematic tests in your test suite by monitoring test behavior over time. Instead of a single set of built-in detection rules, Trunk uses **monitors**, independent detectors that each watch for a specific pattern. When a monitor activates on a test, it runs the **action** you configured on the monitor — either classifying the test as flaky or broken, or [applying labels](../management/test-labels#automatic-labeling-from-monitors) to it.
## How Monitors Work
Each monitor independently observes your test runs and tracks two states per test: **active** (problematic behavior detected) or **inactive** (no problematic behavior). When a monitor transitions to active, it executes its configured action; when it resolves, it undoes that action (restoring health status, or removing the labels it applied).
For monitors whose action is **Classify test status** (referred to below as *health classification monitors*), the test's overall status is determined by combining all such monitors, with the most severe status winning:
| Priority | Status | Condition |
| -------- | ----------- | ---------------------------------------------------------------------------------------- |
| Highest | **Broken** | Any enabled broken-type monitor (failure rate or failure count) is active for this test |
| Middle | **Flaky** | Any enabled flaky-type monitor (failure rate, failure count, or pass-on-retry) is active |
| Lowest | **Healthy** | No active health classification monitor |
If a test triggers both a broken monitor and a flaky monitor simultaneously, it shows as **Broken**. When the broken monitor resolves (e.g., you fix the regression and the failure rate drops), the test transitions to **Flaky** if a flaky monitor is still active, or to **Healthy** if no health classification monitors remain active.
A test stays in its detected state until every health classification monitor that flagged it has independently resolved. Monitors configured to apply labels do not contribute to this status calculation — they only add or remove labels.
### Disabling or Deleting a Monitor
When you select **Disable** or **Delete** from a monitor's context menu, a confirmation dialog appears first. The dialog describes the concrete effect on affected tests before the change fires. You can re-enable a disabled monitor at any time.
When you disable or delete a monitor, it is immediately set to **resolved** for every test case in the repo. For a health classification monitor, this triggers a status re-evaluation for all affected tests: if the disabled monitor was the only active health classification monitor for a test, that test transitions to healthy; if others are still active, the test remains in the most severe active state. For a labeling monitor, the labels it had applied are removed (subject to its **Remove these labels when the monitor resolves** setting).
For example, if you have a broken failure rate monitor and a flaky pass-on-retry monitor, and you disable the broken monitor, any test that was only flagged by the broken monitor will become healthy. A test flagged by both will transition from broken to flaky (because pass-on-retry is still active).
Each affected test case records a **Monitor disabled** or **Monitor deleted** event in its [Events tab](../dashboard#test-case-details), attributed to the person who performed the action. These events are visible under the **Monitors** filter category and show the same monitor name and type as the original detection events, making it straightforward to trace why a test transitioned back to healthy.
## Monitor Types
Trunk groups monitors into two categories based on what they do when they activate:
* **Health classification monitors** determine a test's overall health status (healthy, flaky, or broken). When one activates, the test's status changes across the dashboard, CI annotations, and notifications.
* **Lifecycle and performance monitors** apply labels to tests based on lifecycle events or performance characteristics. They do not affect health status. These monitors appear in a separate section of the monitors page.
### Health Classification Monitors
| Monitor | What it detects | Available actions | Default state |
| -------------------------------------------- | ---------------------------------------------------------------------- | -------------------------------------------------------------------------------------------------------- | ------------- |
| [**Pass-on-Retry**](./pass-on-retry-monitor) | A test fails then passes on the same commit (retry after failure) | Classify (flaky) or [apply labels](../management/test-labels#automatic-labeling-from-monitors) | Enabled |
| [**Failure Rate**](./failure-rate-monitor) | Failure rate exceeds a configured percentage over a time window | Classify (flaky or broken) or [apply labels](../management/test-labels#automatic-labeling-from-monitors) | Disabled |
| [**Failure Count**](./failure-count-monitor) | A test accumulates a configured number of failures in a rolling window | Classify (flaky or broken) or [apply labels](../management/test-labels#automatic-labeling-from-monitors) | Disabled |
### Lifecycle and Performance Monitors
These monitors apply labels based on lifecycle events or performance characteristics. They do not classify tests as flaky or broken, and they do not contribute to the test's overall health status.
| Monitor | What it detects | Available actions | Default state |
| ---------------------------------------------------- | -------------------------------------------------------------------------------------------------------- | -------------------------------------------------------------------------- | ------------- |
| [**New Test**](./new-test-monitor) | A test case seen for the first time, tracked for a configurable grace period | [Apply labels](../management/test-labels#automatic-labeling-from-monitors) | Disabled |
| [**Skipped Test**](./skipped-test-monitor) | A test is consistently skipped across runs within a time window | [Apply labels](../management/test-labels#automatic-labeling-from-monitors) | Disabled |
| [**Slow Test**](./slow-test-monitor) | A test's average duration exceeds a configured threshold | [Apply labels](../management/test-labels#automatic-labeling-from-monitors) | Disabled |
| [**Timeout Inflation**](./timeout-inflation-monitor) | A test's typical failure duration is much larger than its passing duration, exposing an inflated timeout | [Apply labels](../management/test-labels#automatic-labeling-from-monitors) | Disabled |
You can run multiple monitors simultaneously. For example, you might use pass-on-retry to catch classic retry-based flakiness while also running failure rate monitors scoped to different branches. A common pattern is to pair a broken-type failure rate monitor (catching consistently failing tests) with a flaky-type failure rate monitor (catching intermittently failing tests). See [Failure Rate Monitor: Recommended Configurations](./failure-rate-monitor#recommended-configurations) for details.
The [failure count monitor](./failure-count-monitor) complements failure rate monitors by reacting to individual failures rather than failure rates. Use it on branches where any failure is a meaningful signal, like `main` or merge queue branches.
If you need to manually flag a test that automated monitors haven't caught, use [Flag as Flaky](./flag-as-flaky) from the test detail page.
## Dry-Running with Labels
You can preview how a new health classification monitor would behave by deploying it as a labeling monitor first. Because **Apply labels** attaches labels without changing health status, you can let the monitor run on live test data, see which tests it activates on, refine the settings, and only flip it to **Classify test status** once you trust the configuration.
The flow is typically:
1. Create the monitor with **Apply labels** and a dedicated label (e.g., `would-be-flaky`).
2. Let the monitor run for a few cycles and observe which tests pick up the label.
3. Refine the settings until the labeled set matches what you want classified.
4. Switch the monitor's action to **Classify test status**.
The Preview Panel on each monitor config form shows a static snapshot at configuration time, but a label dry-run validates the monitor against live runs without committing to a status change.
## Branch-Aware Detection
Tests often behave differently depending on where they run. Failures on `main` are usually unexpected and signal flakiness. Failures on PR branches may be expected during active development. Merge queue failures are suspicious because the code has already passed PR checks.
Rather than applying a single set of branch rules automatically, Trunk gives you control over how detection treats different branches through **branch scoping** on failure rate monitors. You can create separate monitors with different thresholds and windows for your stable branch, PR branches, and merge queue branches. See [Failure Rate Monitor: Recommended configurations](./failure-rate-monitor#recommended-configurations) for specific guidance.
Pass-on-retry detection is branch-agnostic. It flags any test that fails and passes on the same commit, regardless of which branch the test ran on.
## Muting Monitors
You can temporarily mute a monitor for a specific test case. A muted monitor continues to run and record detections, but it won't contribute to the test's flaky status until the mute expires.
This is useful when you know a test is flaky but want to suppress the signal temporarily, for example while a fix is in progress or during a known infrastructure issue. Unlike [Flag as Flaky](./flag-as-flaky), which is a persistent user override, muting preserves the detection history and automatically re-enables itself after the mute period.
### How Muting Works
You can mute a monitor from the test case view in the Trunk app. When muting, you choose a duration:
| Duration |
| -------- |
| 1 hour |
| 4 hours |
| 24 hours |
| 7 days |
| 30 days |
While muted, the monitor is excluded from the test's status calculation. If the muted monitor was the only active health classification monitor, the test transitions from flaky to healthy for the duration of the mute. When the mute expires, the monitor is automatically included in the next status evaluation. If it's still active, the test will be flagged again.
You can also unmute a monitor early from the test case view.
You can only mute a monitor that has already detected flaky behavior for a test. If a monitor has never been active for a test, the mute option is disabled.
### When to Mute vs. Other Options
| Situation | Recommended action |
| --------------------------------------------------------------------------------- | ------------------------------------------------------------------------------------------------------------------------------------------------------------------------------------------------ |
| Fix is in progress and you want to suppress noise temporarily | **Mute** the monitor for a few days |
| Test is flaky but no automated monitor has caught it | Use [**Flag as Flaky**](./flag-as-flaky) to mark it as flaky |
| A test shows as **Broken** (or Flaky) and you believe the classification is wrong | **Mute** the monitor that's driving the status, or update its configuration (thresholds, branch scope) so it stops misfiring — a [Flag as Flaky](./flag-as-flaky) can't override a broken status |
| You want to stop a monitor from evaluating a test permanently | Adjust the monitor's branch scope or thresholds instead |
| You want to suppress all flaky signals for a test | Mute each active monitor individually, or address the root cause |
## Variants
If you run the same tests across different environments or architectures, you can use [variants](../reference/cli-reference) to separate these runs into distinct test cases. This lets monitors detect environment-specific flakes. For example, a test might be flaky on iOS but stable on Android. Using variants, monitors isolate flakes on the iOS variant instead of marking the test as flaky across all environments. See the [Trunk Analytics CLI docs](../reference/cli-reference) for details on how to upload with variants.
## Detection Time
Detection of flaky tests is run automatically when test uploads are processed. From the time that a test with configured flake detection is uploaded, it will take at most 20 minutes for the flakiness to be detected.
# Infrastructure Failure Protection
Source: https://docs.trunk.io/flaky-tests/detection/infrastructure-failure-protection
Prevent false Trunk Flaky Tests detections during CI outages and infrastructure failures.
When infrastructure issues like database outages, network problems, or CI runner failures cause a large number of tests to fail simultaneously, retrying those tests can trigger mass false flaky detections. Infrastructure Failure Protection identifies these scenarios and excludes them from flakiness detection.
![Configuration for Infrastructure Failure Protection and Failure Threshold]() ## How it works
Trunk monitors the failure rate of each test upload. If the percentage of failing tests exceeds your configured threshold, that upload is flagged as an infrastructure failure and excluded from Trunk Flaky Tests detection.
For example, if your threshold is set to 80% and a CI run has 85% of tests failing (this could be due to a database being unavailable or similar infrastructure issue, etc.), that entire run will be excluded from Trunk Flaky Tests detection. This prevents tests from being incorrectly marked as flaky when they're retried and pass.
## How it works
Trunk monitors the failure rate of each test upload. If the percentage of failing tests exceeds your configured threshold, that upload is flagged as an infrastructure failure and excluded from Trunk Flaky Tests detection.
For example, if your threshold is set to 80% and a CI run has 85% of tests failing (this could be due to a database being unavailable or similar infrastructure issue, etc.), that entire run will be excluded from Trunk Flaky Tests detection. This prevents tests from being incorrectly marked as flaky when they're retried and pass.
Uploads excluded due to infrastructure failure protection will appear in the **Uploads** tab with the status **"Upload Skipped Due to Infrastructure Error."**
## Configuring Infrastructure Failure Protection
Administrators can enable this feature in repository settings:
1. Click on your profile and open **Settings**
2. Select your repository from the left navigation
3. Locate **Infrastructure Failure Protection** under Flaky Tests
4. Toggle **Enable Protection** to on
5. Set your **Failure Threshold** percentage (default: 80%)
The threshold determines what percentage of test failures triggers infrastructure failure detection. A threshold of 80% is a reasonable starting point for most repositories—adjust based on your test suite size and typical failure patterns.
## Trade-offs
When a test upload is excluded due to infrastructure failure protection:
**Uploads are still recorded:**
* The upload appears in the Uploads tab with "Upload Skipped Due to Infrastructure Error" status
**Failures are excluded from analysis:**
* Failures do not impact flakiness detection
* Failures do not contribute to failure rate metrics
* Stack traces from that run are not visible in test case history
This is generally an acceptable trade-off since infrastructure failures don't reflect the actual behavior of individual test cases.
## When to use this
Enable Infrastructure Failure Protection if you experience:
* Database or service outages that cause mass test failures
* CI runner infrastructure issues
* Network failures during test runs
* Any scenario where a large percentage of tests fail for reasons unrelated to code changes
If you're using test quarantine, this feature is especially important to prevent infrastructure issues from automatically quarantining large numbers of tests.
## Next steps
* Learn more about how Trunk [detects flaky tests](./index)
* View excluded uploads in the Uploads tab
* Configure [test quarantine](../quarantining/#enable-quarantining) to automatically skip flaky tests
# New Test Monitor
Source: https://docs.trunk.io/flaky-tests/detection/new-test-monitor
Track recently added tests and apply labels until they have an established history.
The new test monitor identifies test cases the first time they are seen in your test uploads and keeps them labeled for a configurable number of days. It is designed for visibility, not classification: the monitor does not mark tests as flaky or broken. Instead, it applies the labels you configure so your team can distinguish brand-new tests from established ones during triage.
## When to Use This Monitor
* **New test tracking:** Apply a `new-test` label automatically so reviewers know a failing test may simply lack history.
* **Coverage audits:** Identify which tests were added in the last sprint without manually diffing test suites.
* **Noise reduction during ramp-up:** Suppress new tests from triggering alerts by combining this monitor's label with quarantine or alert filter rules.
## How It Works
When a test upload contains a test case ID that has never appeared before, the monitor records its first-seen timestamp. For the next `newDays` days, that test is considered "active" by this monitor and the configured labels are applied. After `newDays` days have passed since the first observation, the monitor resolves the test and the labels are removed.
The monitor runs every five minutes. Detection lookback is capped at six hours per run to keep each pass bounded, so a test seen for the first time will be labeled within at most twenty minutes of its upload being processed.
## Configuration
| Setting | Description | Default |
| -------- | ----------------------------------------------------------------------------------------- | ------------ |
| New days | Number of days after first observation before the monitor resolves and labels are removed | Required |
| Action | Apply labels (the only available action — this monitor does not classify) | Apply labels |
### New Days
Set `newDays` to how long you want the "new" label to stay on a test. A value of 7 means any test added in the last week carries the label. A value of 30 gives a full month of ramp-up coverage before the label drops.
### Action
The new test monitor is a performance-type monitor. It applies labels only and does not change a test's health status (flaky or broken). Choose which labels to apply in the monitor configuration. When the monitor resolves, those labels are removed according to the monitor's label removal setting.
## Resolution
The monitor resolves a test automatically once `newDays` days have elapsed since `first_seen_at`. There is no manual resolution step — once the window passes, the label is removed on the next detection cycle.
If a test is deleted and re-uploaded with the same test case ID, the original `first_seen_at` timestamp is used. The monitor does not reset the clock for re-appearing tests.
## Choosing Between Monitors
| Goal | Recommended monitor |
| -------------------------------------------- | --------------------- |
| Label brand-new tests for a grace period | New test monitor |
| Detect tests that consistently skip runs | Skipped test monitor |
| Flag tests whose runtime exceeds a threshold | Slow test monitor |
| Detect tests that fail then pass on retry | Pass-on-retry monitor |
| Alert on tests failing at a sustained rate | Failure rate monitor |
# Pass-on-Retry Monitor
Source: https://docs.trunk.io/flaky-tests/detection/pass-on-retry-monitor
Detect tests that fail then pass on retry within the same commit
The pass-on-retry monitor detects the most common flakiness pattern: a test fails, is retried, and passes on the same commit. This indicates the failure wasn't caused by a code change and that the test is unreliable.
By default, this monitor evaluates test runs on all branches. You can scope it to specific branches to focus detection where pass-on-retry behavior is actually meaningful.
## How It Works
The monitor continuously scans your test runs looking for commits where a test has both a failure and a success. When it finds one, the monitor activates on that test and runs its configured [action](#action): by default, the test is flagged as flaky.
Once active, the monitor stays active on the test until no pass-on-retry behavior has been observed for a configurable recovery period. This prevents tests from bouncing between flaky and healthy if they only fail intermittently.
![A test fails on attempt 1 and passes on retry on the same commit, gets flagged flaky, then passes on each of the next 7 days and resolves to healthy.]() ### Example
Your CI retries failed tests automatically. On commit `abc123`:
1. `test_login` fails on the first attempt
2. `test_login` passes on retry
The monitor detects that `test_login` had both a failure and success on the same commit and flags it as flaky.
Seven days later (assuming default settings), if `test_login` hasn't exhibited any more retry behavior, the monitor resolves and the test returns to healthy.
## Configuration
| Setting | Description | Default |
| --------------------- | ----------------------------------------------------------------------------------------------------------------------------------------------------------------- | ------------------ |
| **Enabled** | Whether the monitor is active | On |
| **Recovery days** | Days without pass-on-retry behavior before a test is resolved as healthy. Range: 1 to 15 days. | 7 |
| **Branch scope** | Which branches the monitor evaluates. Accepts branch names and glob patterns. | All branches (`*`) |
| **Minimum POR count** | The minimum number of distinct commits that must show pass-on-retry behavior before the monitor activates. Increase this to reduce noise from occasional retries. | 1 |
| **Action** | What happens when the monitor activates. Either classify the test as flaky or apply labels. | Classify as flaky |
### Multiple monitors per repository
You can create more than one pass-on-retry monitor for the same repository. Each monitor runs independently with its own settings, so you can apply different recovery periods, branch scopes, or actions to different parts of your test suite.
A common pattern is to run one monitor scoped to stable branches (like `main`) with a shorter recovery period for fast feedback, and a second monitor scoped to `release/*` branches with a longer recovery period for builds where intermittent failures are more expensive to re-investigate.
To add a monitor, navigate to **Settings** in the Trunk web app, open the repository, open the **Monitors** tab, and click **Add monitor**. Each monitor you create appears as a separate row in the monitors table and can be individually enabled, disabled, or deleted.
### Example
Your CI retries failed tests automatically. On commit `abc123`:
1. `test_login` fails on the first attempt
2. `test_login` passes on retry
The monitor detects that `test_login` had both a failure and success on the same commit and flags it as flaky.
Seven days later (assuming default settings), if `test_login` hasn't exhibited any more retry behavior, the monitor resolves and the test returns to healthy.
## Configuration
| Setting | Description | Default |
| --------------------- | ----------------------------------------------------------------------------------------------------------------------------------------------------------------- | ------------------ |
| **Enabled** | Whether the monitor is active | On |
| **Recovery days** | Days without pass-on-retry behavior before a test is resolved as healthy. Range: 1 to 15 days. | 7 |
| **Branch scope** | Which branches the monitor evaluates. Accepts branch names and glob patterns. | All branches (`*`) |
| **Minimum POR count** | The minimum number of distinct commits that must show pass-on-retry behavior before the monitor activates. Increase this to reduce noise from occasional retries. | 1 |
| **Action** | What happens when the monitor activates. Either classify the test as flaky or apply labels. | Classify as flaky |
### Multiple monitors per repository
You can create more than one pass-on-retry monitor for the same repository. Each monitor runs independently with its own settings, so you can apply different recovery periods, branch scopes, or actions to different parts of your test suite.
A common pattern is to run one monitor scoped to stable branches (like `main`) with a shorter recovery period for fast feedback, and a second monitor scoped to `release/*` branches with a longer recovery period for builds where intermittent failures are more expensive to re-investigate.
To add a monitor, navigate to **Settings** in the Trunk web app, open the repository, open the **Monitors** tab, and click **Add monitor**. Each monitor you create appears as a separate row in the monitors table and can be individually enabled, disabled, or deleted.
![The repository Monitors tab showing a pass-on-retry monitor, two failure-rate monitors, and lifecycle monitors, each as a separate row with an Add Monitor control.]()
![The repository Monitors tab showing a pass-on-retry monitor, two failure-rate monitors, and lifecycle monitors, each as a separate row with an Add Monitor control.]() ### What Recovery Days Controls
A shorter recovery period (e.g., 1 to 3 days) returns tests to healthy quickly, which is useful if you fix flaky tests promptly and want fast feedback. A longer recovery period (e.g., 10 to 15 days) is more conservative. It keeps tests flagged longer to account for flaky behavior that only surfaces occasionally.
### Branch Scope
Use the **Branch scope** setting to restrict the monitor to a specific set of branches.
This is useful when PR branches generate too much noise. CI often retries tests on pull request branches automatically; if those retries aren't meaningful signals for your team, you can limit detection to stable branches like `main`.
Branch scope uses the same glob syntax as [failure rate monitor branch patterns](./failure-rate-monitor#branch-pattern-syntax) and accepts up to 10 patterns. Type a pattern and press **Enter** or comma to add it as a chip. For example:
* `main`: only stable branch runs
* `main` and `release/*`: stable plus release branches
* `*` (default): all branches
Changes to branch scope take effect for newly detected events. Previously detected flaky tests are not re-evaluated.
### Minimum POR Count
By default, a single commit where a test fails and then passes on retry is enough to activate the monitor. A minimum of 1 means: as soon as one commit shows the pattern, the test is flagged.
Raising the minimum (for example, to 2 or 3) requires the same test to show that pattern on multiple distinct commits within the detection window before the monitor activates. This reduces false positives in environments where CI retries most failures automatically, producing one-off retry events for otherwise reliable tests.
Set a higher minimum when your retry rate is high enough that a single commit's retry event is not a reliable flakiness signal.
### Action
You pick the action at creation and can switch it at any time.
* **Classify test status** (default) — flags the test as **flaky** while the monitor is active and restores it to healthy when the monitor resolves. Pass-on-retry only classifies as flaky; there is no broken option.
* **Apply labels** — adds the configured labels to the test while the monitor is active. The test's health status is not changed by this monitor. See [Automatic labeling from monitors](../management/test-labels#automatic-labeling-from-monitors).
## When Detection Happens
Pass-on-retry detection runs continuously as new test results arrive. A failure and its corresponding retry don't need to arrive at exactly the same time.
Resolution is evaluated daily. If a test hasn't shown pass-on-retry behavior within the recovery window, it resolves on the next daily check.
## Muting
You can temporarily mute the pass-on-retry monitor for a specific test case. See [Muting monitors](./index#muting-monitors) for details.
## Edge Cases
**Failure without a retry yet:** If a test fails but hasn't been retried, no detection occurs. If the retry arrives later (even hours or days later on the same commit), the monitor will pick it up.
**Multiple retries on one commit:** If a test fails and is retried several times on the same commit, the monitor treats it as a single detection for that commit.
# Skipped Test Monitor
Source: https://docs.trunk.io/flaky-tests/detection/skipped-test-monitor
Detect tests that are consistently being skipped and apply labels to surface them for review.
The skipped test monitor tracks test cases that accumulate a configured number of skipped runs within a time window. It applies labels to those tests so your team can identify tests that are being silently ignored, rather than classifying them as flaky or broken.
## When to Use This Monitor
* **Surface suppressed tests:** Find tests that someone marked as skip (`.skip`, `xtest`, `xit`) and never re-enabled.
* **Track intentional skips:** Apply a `skipped` label so dashboards reflect tests that are excluded from runs, giving a more accurate picture of suite coverage.
* **Scope to specific branches:** Detect skips on main or release branches where a skipped test represents a gap in coverage rather than a development convenience.
## How It Works
The monitor counts the number of skipped runs for each test case within a configurable time window (in minutes). When a test accumulates at least `minSkippedCount` skipped runs in that window, the monitor activates and applies the configured labels.
Resolution occurs after `resolutionDays` days pass with no new skipped runs recorded for that test on any monitored branch.
## Configuration
| Setting | Description | Default |
| ----------------- | ------------------------------------------------------------------------- | ------------ |
| Window | Time window (minutes) over which skipped runs are counted | Required |
| Min skipped count | Number of skipped runs in the window required to activate | Required |
| Resolution days | Days without a new skipped run before the monitor resolves | Required |
| Branch scope | Branch names or glob patterns to monitor | All branches |
| Action | Apply labels (the only available action — this monitor does not classify) | Apply labels |
### Window
The time window controls how far back the monitor looks when counting skipped runs. A shorter window (e.g., 60 minutes) catches tests skipped in a burst around a specific CI run. A longer window (e.g., 2 days, 2880 minutes) catches tests that are habitually skipped across many runs.
### Min Skipped Count
Set this to 1 to flag any test the moment it skips a single run in the window. Set it higher to require repeated skips, filtering out tests that are skipped once for a legitimate reason (such as a flaky environment that resolves itself).
### Resolution Days
After a test stops being skipped, the monitor waits `resolutionDays` before resolving. This prevents the label from flickering on and off for tests that skip intermittently.
### Branch Scope
Use branch patterns to limit detection to branches where a skipped test is significant. For example, monitoring only `main` means tests skipped on feature branches do not trigger the monitor.
## Choosing Between Monitors
| Goal | Recommended monitor |
| -------------------------------------------- | --------------------- |
| Detect tests consistently being skipped | Skipped test monitor |
| Track recently added tests | New test monitor |
| Flag tests whose runtime exceeds a threshold | Slow test monitor |
| Detect tests that fail then pass on retry | Pass-on-retry monitor |
| Alert on tests failing at a sustained rate | Failure rate monitor |
# Slow Test Monitor
Source: https://docs.trunk.io/flaky-tests/detection/slow-test-monitor
Flag tests whose duration percentile exceeds a configured threshold.
The slow test monitor detects test cases whose measured duration exceeds a threshold you set, evaluated over a configurable percentile, time window, and sample size. It applies labels to slow tests so your team can identify and prioritize performance improvements without classifying tests as flaky or broken.
## When to Use This Monitor
* **Identify tests slowing down CI:** Surface the specific tests adding the most wall time to your pipeline.
* **Enforce duration budgets:** Label any test that exceeds an acceptable runtime so it gets reviewed before merging.
* **Track regressions:** Catch tests that were fast but became slow after a code change.
## How It Works
The monitor evaluates test duration at a configured percentile across runs in a rolling time window. When a test's percentile duration meets or exceeds the configured threshold and enough sample runs have been collected, the monitor activates and applies the configured labels.
Resolution happens when the test's measured duration drops back below the threshold over subsequent runs. If `staleAfterMinutes` is set, the monitor also resolves any active test that has had no recent runs on monitored branches — this prevents labels from persisting on tests that have been removed from the suite.
Once the monitor activates, detection evidence (the specific runs that triggered it) is visible in the **Events** tab on the test details page.
## Configuration
| Setting | Description | Default |
| ------------------ | -------------------------------------------------------------------------------------------- | ------------ |
| Duration threshold | Duration (milliseconds) at the configured percentile that triggers detection | Required |
| Percentile | Which duration percentile to evaluate, as a value between 0 and 1 (for example, 0.5 for p50) | Required |
| Window | Time window (minutes) over which duration is measured | Required |
| Sample size | Minimum number of runs required before the monitor can activate | Required |
| Stale after | Minutes without any run on monitored branches before an active test resolves (optional) | Disabled |
| Branch scope | Branch names or glob patterns to monitor | All branches |
| Action | Apply labels (the only available action — this monitor does not classify) | Apply labels |
### Duration Threshold
Set the threshold in milliseconds. With the percentile set to 0.5 (p50), a value of 5000 flags any test whose median run exceeds 5 seconds. Tune this based on your acceptable CI budget — tighter thresholds surface more tests but may require more review bandwidth.
### Percentile
The percentile controls which point on the duration distribution is compared to the threshold.
* **p95** means 95% of a test's runs are at or below the measured duration. A test only needs occasional slow runs to push its p95 above the threshold, making this a less strict setting that catches intermittent slowness.
* **p50** means 50% of a test's runs are at or below the measured duration. A test must have the majority of its runs be slow before it triggers, making this a stricter setting that filters out one-off spikes.
Choose a higher percentile (p75, p90, p95) to catch tests with sporadic slowness. Choose a lower percentile (p50) to surface only tests that are consistently slow.
### Window and Sample Size
The window controls how far back duration samples are collected. Sample size sets the minimum number of runs needed before the monitor will activate. This prevents a single slow run from triggering the monitor on a test with no history. For example, a window of 1440 minutes (one day) and a sample size of 5 means the monitor evaluates the configured percentile over the last day's runs and requires at least five before drawing a conclusion. The preview panel shows up to 1000 tests that ran within the configured window.
### Stale After
When set, any test that has been active (labeled slow) but stops running on monitored branches for `staleAfterMinutes` minutes will be automatically resolved. Use this to clean up labels after a slow test is removed from the suite or renamed.
### Branch Scope
Scope the monitor to branches where test duration matters most, such as `main` or merge queue branches. Tests running on feature branches may have intentionally limited execution or variable infrastructure and may not represent a genuine slowness concern.
## Choosing Between Monitors
| Goal | Recommended monitor |
| ------------------------------------------------------------- | -------------------------------------------------------- |
| Flag tests that are taking too long | Slow test monitor |
| Flag tests whose timeouts are far larger than they need to be | [Timeout inflation monitor](./timeout-inflation-monitor) |
| Track recently added tests | New test monitor |
| Detect tests consistently being skipped | Skipped test monitor |
| Detect tests that fail then pass on retry | Pass-on-retry monitor |
| Alert on tests failing at a sustained rate | Failure rate monitor |
# The Importance of PR Test Results
Source: https://docs.trunk.io/flaky-tests/detection/the-importance-of-pr-test-results
Why uploading test results from pull requests is required for accurate flaky test detection, quarantining, and impact measurement.
Uploading test results from pull requests (PRs) is a critical step for enabling Trunk Flaky Tests. This data provides a primary signal for *detecting* flaky tests and is the key metric for *measuring* their impact. Without it, you lose the most significant source of information for identifying and prioritizing these disruptive tests.
Here's a breakdown of the key features that depend on PR test results:
## Crucial Flakiness Detection
The most common and critical signal for identifying a flaky test happens on PRs. Flakiness is detected when a test produces different results on the same git commit.
This typically happens when:
1. A developer opens a PR, and a test fails.
2. The developer reruns the exact same tests without changing any code.
3. The test now passes.
This "fail then pass" sequence on the same commit is a clear indication of non-deterministic, or "flaky," behavior. Since the majority of test runs occur during the development and review cycle, PRs are the largest source of this vital signal.
## Measuring Test Impact
The Flaky Tests dashboard is designed to help you prioritize which tests to fix first. The single most important metric for this is `PRs Impacted`. By default, the overview table is sorted by this metric because it's the best way to measure a flaky test's true impact on developer productivity.
If you don't upload test results from PRs:
* The `PRs Impacted` count for every test will be zero.
* You will have no way to determine which flaky tests are causing the most disruption.
* You lose the ability to prioritize fixes based on real-world data, potentially wasting time on less important issues.
## Unblocking Developers with Quarantining
Quarantining is one of the most important features of Trunk Flaky Tests. Its core purpose is to prevent known flaky tests from blocking developers and breaking CI pipelines, especially merge queues.
The entire quarantining workflow is predicated on analyzing test results from PRs. Without PR data, you cannot:
* **Identify tests as flaky from PR test runs:** The system needs to see a test pass and fail on the same commit (a signal primarily gathered from PRs) to classify it as flaky.
* **Apply Quarantine Logic at Runtime:** Uploading a test result and checking if it should be quarantined are part of the same, single step in your CI job. When a test fails on a PR, the `Trunk Analytics CLI` uploads the failure and, in the same operation, checks with the Trunk service to see if that test is on the quarantine list. If it is, the CLI overrides the job's exit code, allowing the build to pass. Without running the `Trunk Analytics CLI` on your PR jobs, this real-time check cannot occur, and even known flaky tests will continue to block your PRs.
## Immediate CI Feedback and Error Summaries
The `Trunk Analytics CLI` provides a detailed summary directly in the CI job's output log. This is the fastest, most immediate feedback a developer gets about their test run.
Without uploading PR results, you lose:
* A Clear Test Report Summary: A quick overview of `Total`, `Pass`, `Fail`, and `Quarantined` tests.
* In-Log Failure Details: A snippet of the stack trace and assertion error for any failed test, providing immediate context without digging through full CI logs.
* Actionable Exit Codes: The CLI intelligently determines the job's outcome.
* When a real test fails, it exits with a non-zero code: `Not all test failures were quarantined, using exit code 1 from command`
* When *only* a known flaky test fails, it passes the job: `All test failures were quarantined, overriding exit code to be exit_success`
This immediate, in-CI feedback loop is invaluable for developers trying to quickly understand why their build failed.
## Enabling Developer Productivity Features
Trunk Flaky Tests offers features directly within the developer workflow that depend entirely on PR data, most significantly the automated pull request comment.
These comments provide a summary of all tests run on a specific PR, highlighting failures and indicating whether they are due to a known flaky test. This feature prevents developers from wasting time investigating a failure that is already identified as flaky. Without uploading PR test results, this valuable, time-saving context is completely lost.
## Next Steps: Enable PR Uploads
Now that you understand why uploading test results from pull requests is essential, the next step is to configure your CI pipeline. This single step is the key to accurate flakiness detection, true impact measurement, and features like quarantining.
Our documentation provides step-by-step guides for all major CI providers to make this setup simple.
[Find your CI provider and start uploading test results](../get-started/ci-providers/index)
# Timeout Inflation Monitor
Source: https://docs.trunk.io/flaky-tests/detection/timeout-inflation-monitor
Flag tests whose failure times sit far above their passing times, exposing timeouts that have ratcheted up beyond what the test actually needs.
The timeout inflation monitor detects tests whose failure durations are much larger than their passing durations. When a test consistently passes in a few seconds at p95 but takes ten times longer to fail, its failures aren't slow runs of a working test - they're a broken test sitting on an inflated timeout. The monitor surfaces these tests so you can bring the timeout down to something anchored in reality and get fast failure signal back.
## When to Use This Monitor
* **Tighten inflated timeouts:** Find tests where the configured timeout is far larger than the test ever needs when healthy, so you can ratchet the timeout back down.
* **Speed up broken-build feedback:** Cut the wall-clock cost of a broken test that fails, retries, and hangs against its timeout on every attempt.
* **Audit Playwright and other UI automation suites:** These suites tend to accumulate the largest timeouts and benefit the most from surfacing inflation.
## How It Works
For each test case, the monitor looks at recent runs within a configurable window and computes two durations:
* The **passing duration** at a configured percentile (default p95) — a conservative upper bound on how long a healthy run takes.
* The **failing duration** at a configured percentile (default p50) — the typical case when the test goes red.
If the failing duration is at least X times larger than the passing duration, and the absolute gap between the two exceeds the minimum absolute gap, the monitor activates and applies the configured labels. Stacking the slowest reasonable success against the typical failure means a single slow outlier can't fool the detector - the failures have to consistently land above the passes.
## Configuration
| Setting | Description | Default |
| ---------------- | --------------------------------------------------------------------------------------------------------------- | ------------ |
| Pass percentile | Percentile of passing-run durations used as the healthy upper bound, as a value between 0 and 1 | 0.95 |
| Fail percentile | Percentile of failing-run durations compared against the passing baseline | 0.5 |
| Activation ratio | How many times larger the failing percentile must be than the passing percentile to activate | 2 |
| Min absolute gap | Minimum absolute gap (milliseconds) between the failing and passing percentiles before the monitor can activate | 3000 |
| Min pass samples | Minimum number of passing runs required inside the window before the monitor can activate | 5 |
| Min fail samples | Minimum number of failing runs required inside the window before the monitor can activate | 3 |
| Window | Time window (hours) over which passing and failing durations are collected | 168 |
| Resolution ratio | Ratio at or below which an active test automatically resolves | 1.5 |
| Branch scope | Branch names or glob patterns to monitor | All branches |
| Action | Apply labels (the only available action — this monitor does not classify) | Apply labels |
### Pass and Fail Percentiles
The pass percentile controls what counts as a realistic upper bound on a healthy run. p95 means 95% of a test's passing runs finish at or below the measured duration, so it captures the slowest reasonable success without being thrown off by a single outlier.
The fail percentile controls what counts as a typical failure. p50 means half of a test's failing runs finish at or below the measured duration, so a small number of unusually fast failures can't hide a broken test that usually hangs on its timeout.
Using p95 for passes and p50 for failures is deliberately conservative: it compares the slowest reasonable success against the typical failure and requires a clean gap between the two.
### Activation Ratio and Minimum Absolute Gap
The activation ratio is how much larger the fail percentile has to be than the pass percentile before the monitor flags the test. The default of 2 means failures have to typically take at least twice as long as the slowest reasonable pass. Raise it to only surface the worst offenders; lower it to catch milder inflation earlier.
The minimum absolute gap is a floor in milliseconds so tiny durations don't trip the monitor. A test that passes in 10ms and fails in 30ms is technically a 3x ratio but not worth flagging. The default of 3000ms keeps sub-second tests quiet while still catching the multi-second inflation that dominates real CI cost.
### Sample Sizes and Window
The window is how far back the monitor looks for passing and failing runs. The default of 168 hours (one week) keeps the signal tied to recent behavior rather than ancient history.
The minimum pass and fail sample sizes prevent the monitor from acting on thin data. Defaults are 5 passes and 3 failures inside the window, so a test needs enough of both outcomes for the percentile comparison to be meaningful.
### Resolution Ratio
Once a test is active, the monitor watches the fail/pass ratio on subsequent runs. When the ratio drops to or below this ratio, the monitor resolves the test and removes the labels it applied. The default of 1.5 means the test has to come back well under the activation threshold - not just barely - before it clears, which prevents flapping around the activation line.
### Branch Scope
Scope the monitor to branches where timeout inflation matters most, such as `main` or merge queue branches. Feature branches often have intentionally partial test runs or unusual infrastructure and are less useful for measuring inflation.
## What to Do About an Inflated Timeout
When the monitor flags a test, the fix is usually to bring the timeout down to something anchored in the test's real behavior. If the test passes in 2 seconds at p95, it does not need a 60 second timeout — a 3 second timeout gives it 50% more time than it ever uses when healthy, and future breakages will fail fast instead of hanging against the old ceiling.
Bringing the timeout down turns a three-minute retry-and-hang cycle into a few seconds of actual signal, which is the point of the test suite in the first place.
# Atlassian Bamboo
Source: https://docs.trunk.io/flaky-tests/get-started/ci-providers/atlassian-bamboo
Configure Atlassian Bamboo to upload test results to Trunk Flaky Tests
Trunk Flaky Tests integrates with your CI by adding a step in your Bamboo Plans to upload tests with the [Trunk Analytics CLI](../../reference/cli-reference).
### What Recovery Days Controls
A shorter recovery period (e.g., 1 to 3 days) returns tests to healthy quickly, which is useful if you fix flaky tests promptly and want fast feedback. A longer recovery period (e.g., 10 to 15 days) is more conservative. It keeps tests flagged longer to account for flaky behavior that only surfaces occasionally.
### Branch Scope
Use the **Branch scope** setting to restrict the monitor to a specific set of branches.
This is useful when PR branches generate too much noise. CI often retries tests on pull request branches automatically; if those retries aren't meaningful signals for your team, you can limit detection to stable branches like `main`.
Branch scope uses the same glob syntax as [failure rate monitor branch patterns](./failure-rate-monitor#branch-pattern-syntax) and accepts up to 10 patterns. Type a pattern and press **Enter** or comma to add it as a chip. For example:
* `main`: only stable branch runs
* `main` and `release/*`: stable plus release branches
* `*` (default): all branches
Changes to branch scope take effect for newly detected events. Previously detected flaky tests are not re-evaluated.
### Minimum POR Count
By default, a single commit where a test fails and then passes on retry is enough to activate the monitor. A minimum of 1 means: as soon as one commit shows the pattern, the test is flagged.
Raising the minimum (for example, to 2 or 3) requires the same test to show that pattern on multiple distinct commits within the detection window before the monitor activates. This reduces false positives in environments where CI retries most failures automatically, producing one-off retry events for otherwise reliable tests.
Set a higher minimum when your retry rate is high enough that a single commit's retry event is not a reliable flakiness signal.
### Action
You pick the action at creation and can switch it at any time.
* **Classify test status** (default) — flags the test as **flaky** while the monitor is active and restores it to healthy when the monitor resolves. Pass-on-retry only classifies as flaky; there is no broken option.
* **Apply labels** — adds the configured labels to the test while the monitor is active. The test's health status is not changed by this monitor. See [Automatic labeling from monitors](../management/test-labels#automatic-labeling-from-monitors).
## When Detection Happens
Pass-on-retry detection runs continuously as new test results arrive. A failure and its corresponding retry don't need to arrive at exactly the same time.
Resolution is evaluated daily. If a test hasn't shown pass-on-retry behavior within the recovery window, it resolves on the next daily check.
## Muting
You can temporarily mute the pass-on-retry monitor for a specific test case. See [Muting monitors](./index#muting-monitors) for details.
## Edge Cases
**Failure without a retry yet:** If a test fails but hasn't been retried, no detection occurs. If the retry arrives later (even hours or days later on the same commit), the monitor will pick it up.
**Multiple retries on one commit:** If a test fails and is retried several times on the same commit, the monitor treats it as a single detection for that commit.
# Skipped Test Monitor
Source: https://docs.trunk.io/flaky-tests/detection/skipped-test-monitor
Detect tests that are consistently being skipped and apply labels to surface them for review.
The skipped test monitor tracks test cases that accumulate a configured number of skipped runs within a time window. It applies labels to those tests so your team can identify tests that are being silently ignored, rather than classifying them as flaky or broken.
## When to Use This Monitor
* **Surface suppressed tests:** Find tests that someone marked as skip (`.skip`, `xtest`, `xit`) and never re-enabled.
* **Track intentional skips:** Apply a `skipped` label so dashboards reflect tests that are excluded from runs, giving a more accurate picture of suite coverage.
* **Scope to specific branches:** Detect skips on main or release branches where a skipped test represents a gap in coverage rather than a development convenience.
## How It Works
The monitor counts the number of skipped runs for each test case within a configurable time window (in minutes). When a test accumulates at least `minSkippedCount` skipped runs in that window, the monitor activates and applies the configured labels.
Resolution occurs after `resolutionDays` days pass with no new skipped runs recorded for that test on any monitored branch.
## Configuration
| Setting | Description | Default |
| ----------------- | ------------------------------------------------------------------------- | ------------ |
| Window | Time window (minutes) over which skipped runs are counted | Required |
| Min skipped count | Number of skipped runs in the window required to activate | Required |
| Resolution days | Days without a new skipped run before the monitor resolves | Required |
| Branch scope | Branch names or glob patterns to monitor | All branches |
| Action | Apply labels (the only available action — this monitor does not classify) | Apply labels |
### Window
The time window controls how far back the monitor looks when counting skipped runs. A shorter window (e.g., 60 minutes) catches tests skipped in a burst around a specific CI run. A longer window (e.g., 2 days, 2880 minutes) catches tests that are habitually skipped across many runs.
### Min Skipped Count
Set this to 1 to flag any test the moment it skips a single run in the window. Set it higher to require repeated skips, filtering out tests that are skipped once for a legitimate reason (such as a flaky environment that resolves itself).
### Resolution Days
After a test stops being skipped, the monitor waits `resolutionDays` before resolving. This prevents the label from flickering on and off for tests that skip intermittently.
### Branch Scope
Use branch patterns to limit detection to branches where a skipped test is significant. For example, monitoring only `main` means tests skipped on feature branches do not trigger the monitor.
## Choosing Between Monitors
| Goal | Recommended monitor |
| -------------------------------------------- | --------------------- |
| Detect tests consistently being skipped | Skipped test monitor |
| Track recently added tests | New test monitor |
| Flag tests whose runtime exceeds a threshold | Slow test monitor |
| Detect tests that fail then pass on retry | Pass-on-retry monitor |
| Alert on tests failing at a sustained rate | Failure rate monitor |
# Slow Test Monitor
Source: https://docs.trunk.io/flaky-tests/detection/slow-test-monitor
Flag tests whose duration percentile exceeds a configured threshold.
The slow test monitor detects test cases whose measured duration exceeds a threshold you set, evaluated over a configurable percentile, time window, and sample size. It applies labels to slow tests so your team can identify and prioritize performance improvements without classifying tests as flaky or broken.
## When to Use This Monitor
* **Identify tests slowing down CI:** Surface the specific tests adding the most wall time to your pipeline.
* **Enforce duration budgets:** Label any test that exceeds an acceptable runtime so it gets reviewed before merging.
* **Track regressions:** Catch tests that were fast but became slow after a code change.
## How It Works
The monitor evaluates test duration at a configured percentile across runs in a rolling time window. When a test's percentile duration meets or exceeds the configured threshold and enough sample runs have been collected, the monitor activates and applies the configured labels.
Resolution happens when the test's measured duration drops back below the threshold over subsequent runs. If `staleAfterMinutes` is set, the monitor also resolves any active test that has had no recent runs on monitored branches — this prevents labels from persisting on tests that have been removed from the suite.
Once the monitor activates, detection evidence (the specific runs that triggered it) is visible in the **Events** tab on the test details page.
## Configuration
| Setting | Description | Default |
| ------------------ | -------------------------------------------------------------------------------------------- | ------------ |
| Duration threshold | Duration (milliseconds) at the configured percentile that triggers detection | Required |
| Percentile | Which duration percentile to evaluate, as a value between 0 and 1 (for example, 0.5 for p50) | Required |
| Window | Time window (minutes) over which duration is measured | Required |
| Sample size | Minimum number of runs required before the monitor can activate | Required |
| Stale after | Minutes without any run on monitored branches before an active test resolves (optional) | Disabled |
| Branch scope | Branch names or glob patterns to monitor | All branches |
| Action | Apply labels (the only available action — this monitor does not classify) | Apply labels |
### Duration Threshold
Set the threshold in milliseconds. With the percentile set to 0.5 (p50), a value of 5000 flags any test whose median run exceeds 5 seconds. Tune this based on your acceptable CI budget — tighter thresholds surface more tests but may require more review bandwidth.
### Percentile
The percentile controls which point on the duration distribution is compared to the threshold.
* **p95** means 95% of a test's runs are at or below the measured duration. A test only needs occasional slow runs to push its p95 above the threshold, making this a less strict setting that catches intermittent slowness.
* **p50** means 50% of a test's runs are at or below the measured duration. A test must have the majority of its runs be slow before it triggers, making this a stricter setting that filters out one-off spikes.
Choose a higher percentile (p75, p90, p95) to catch tests with sporadic slowness. Choose a lower percentile (p50) to surface only tests that are consistently slow.
### Window and Sample Size
The window controls how far back duration samples are collected. Sample size sets the minimum number of runs needed before the monitor will activate. This prevents a single slow run from triggering the monitor on a test with no history. For example, a window of 1440 minutes (one day) and a sample size of 5 means the monitor evaluates the configured percentile over the last day's runs and requires at least five before drawing a conclusion. The preview panel shows up to 1000 tests that ran within the configured window.
### Stale After
When set, any test that has been active (labeled slow) but stops running on monitored branches for `staleAfterMinutes` minutes will be automatically resolved. Use this to clean up labels after a slow test is removed from the suite or renamed.
### Branch Scope
Scope the monitor to branches where test duration matters most, such as `main` or merge queue branches. Tests running on feature branches may have intentionally limited execution or variable infrastructure and may not represent a genuine slowness concern.
## Choosing Between Monitors
| Goal | Recommended monitor |
| ------------------------------------------------------------- | -------------------------------------------------------- |
| Flag tests that are taking too long | Slow test monitor |
| Flag tests whose timeouts are far larger than they need to be | [Timeout inflation monitor](./timeout-inflation-monitor) |
| Track recently added tests | New test monitor |
| Detect tests consistently being skipped | Skipped test monitor |
| Detect tests that fail then pass on retry | Pass-on-retry monitor |
| Alert on tests failing at a sustained rate | Failure rate monitor |
# The Importance of PR Test Results
Source: https://docs.trunk.io/flaky-tests/detection/the-importance-of-pr-test-results
Why uploading test results from pull requests is required for accurate flaky test detection, quarantining, and impact measurement.
Uploading test results from pull requests (PRs) is a critical step for enabling Trunk Flaky Tests. This data provides a primary signal for *detecting* flaky tests and is the key metric for *measuring* their impact. Without it, you lose the most significant source of information for identifying and prioritizing these disruptive tests.
Here's a breakdown of the key features that depend on PR test results:
## Crucial Flakiness Detection
The most common and critical signal for identifying a flaky test happens on PRs. Flakiness is detected when a test produces different results on the same git commit.
This typically happens when:
1. A developer opens a PR, and a test fails.
2. The developer reruns the exact same tests without changing any code.
3. The test now passes.
This "fail then pass" sequence on the same commit is a clear indication of non-deterministic, or "flaky," behavior. Since the majority of test runs occur during the development and review cycle, PRs are the largest source of this vital signal.
## Measuring Test Impact
The Flaky Tests dashboard is designed to help you prioritize which tests to fix first. The single most important metric for this is `PRs Impacted`. By default, the overview table is sorted by this metric because it's the best way to measure a flaky test's true impact on developer productivity.
If you don't upload test results from PRs:
* The `PRs Impacted` count for every test will be zero.
* You will have no way to determine which flaky tests are causing the most disruption.
* You lose the ability to prioritize fixes based on real-world data, potentially wasting time on less important issues.
## Unblocking Developers with Quarantining
Quarantining is one of the most important features of Trunk Flaky Tests. Its core purpose is to prevent known flaky tests from blocking developers and breaking CI pipelines, especially merge queues.
The entire quarantining workflow is predicated on analyzing test results from PRs. Without PR data, you cannot:
* **Identify tests as flaky from PR test runs:** The system needs to see a test pass and fail on the same commit (a signal primarily gathered from PRs) to classify it as flaky.
* **Apply Quarantine Logic at Runtime:** Uploading a test result and checking if it should be quarantined are part of the same, single step in your CI job. When a test fails on a PR, the `Trunk Analytics CLI` uploads the failure and, in the same operation, checks with the Trunk service to see if that test is on the quarantine list. If it is, the CLI overrides the job's exit code, allowing the build to pass. Without running the `Trunk Analytics CLI` on your PR jobs, this real-time check cannot occur, and even known flaky tests will continue to block your PRs.
## Immediate CI Feedback and Error Summaries
The `Trunk Analytics CLI` provides a detailed summary directly in the CI job's output log. This is the fastest, most immediate feedback a developer gets about their test run.
Without uploading PR results, you lose:
* A Clear Test Report Summary: A quick overview of `Total`, `Pass`, `Fail`, and `Quarantined` tests.
* In-Log Failure Details: A snippet of the stack trace and assertion error for any failed test, providing immediate context without digging through full CI logs.
* Actionable Exit Codes: The CLI intelligently determines the job's outcome.
* When a real test fails, it exits with a non-zero code: `Not all test failures were quarantined, using exit code 1 from command`
* When *only* a known flaky test fails, it passes the job: `All test failures were quarantined, overriding exit code to be exit_success`
This immediate, in-CI feedback loop is invaluable for developers trying to quickly understand why their build failed.
## Enabling Developer Productivity Features
Trunk Flaky Tests offers features directly within the developer workflow that depend entirely on PR data, most significantly the automated pull request comment.
These comments provide a summary of all tests run on a specific PR, highlighting failures and indicating whether they are due to a known flaky test. This feature prevents developers from wasting time investigating a failure that is already identified as flaky. Without uploading PR test results, this valuable, time-saving context is completely lost.
## Next Steps: Enable PR Uploads
Now that you understand why uploading test results from pull requests is essential, the next step is to configure your CI pipeline. This single step is the key to accurate flakiness detection, true impact measurement, and features like quarantining.
Our documentation provides step-by-step guides for all major CI providers to make this setup simple.
[Find your CI provider and start uploading test results](../get-started/ci-providers/index)
# Timeout Inflation Monitor
Source: https://docs.trunk.io/flaky-tests/detection/timeout-inflation-monitor
Flag tests whose failure times sit far above their passing times, exposing timeouts that have ratcheted up beyond what the test actually needs.
The timeout inflation monitor detects tests whose failure durations are much larger than their passing durations. When a test consistently passes in a few seconds at p95 but takes ten times longer to fail, its failures aren't slow runs of a working test - they're a broken test sitting on an inflated timeout. The monitor surfaces these tests so you can bring the timeout down to something anchored in reality and get fast failure signal back.
## When to Use This Monitor
* **Tighten inflated timeouts:** Find tests where the configured timeout is far larger than the test ever needs when healthy, so you can ratchet the timeout back down.
* **Speed up broken-build feedback:** Cut the wall-clock cost of a broken test that fails, retries, and hangs against its timeout on every attempt.
* **Audit Playwright and other UI automation suites:** These suites tend to accumulate the largest timeouts and benefit the most from surfacing inflation.
## How It Works
For each test case, the monitor looks at recent runs within a configurable window and computes two durations:
* The **passing duration** at a configured percentile (default p95) — a conservative upper bound on how long a healthy run takes.
* The **failing duration** at a configured percentile (default p50) — the typical case when the test goes red.
If the failing duration is at least X times larger than the passing duration, and the absolute gap between the two exceeds the minimum absolute gap, the monitor activates and applies the configured labels. Stacking the slowest reasonable success against the typical failure means a single slow outlier can't fool the detector - the failures have to consistently land above the passes.
## Configuration
| Setting | Description | Default |
| ---------------- | --------------------------------------------------------------------------------------------------------------- | ------------ |
| Pass percentile | Percentile of passing-run durations used as the healthy upper bound, as a value between 0 and 1 | 0.95 |
| Fail percentile | Percentile of failing-run durations compared against the passing baseline | 0.5 |
| Activation ratio | How many times larger the failing percentile must be than the passing percentile to activate | 2 |
| Min absolute gap | Minimum absolute gap (milliseconds) between the failing and passing percentiles before the monitor can activate | 3000 |
| Min pass samples | Minimum number of passing runs required inside the window before the monitor can activate | 5 |
| Min fail samples | Minimum number of failing runs required inside the window before the monitor can activate | 3 |
| Window | Time window (hours) over which passing and failing durations are collected | 168 |
| Resolution ratio | Ratio at or below which an active test automatically resolves | 1.5 |
| Branch scope | Branch names or glob patterns to monitor | All branches |
| Action | Apply labels (the only available action — this monitor does not classify) | Apply labels |
### Pass and Fail Percentiles
The pass percentile controls what counts as a realistic upper bound on a healthy run. p95 means 95% of a test's passing runs finish at or below the measured duration, so it captures the slowest reasonable success without being thrown off by a single outlier.
The fail percentile controls what counts as a typical failure. p50 means half of a test's failing runs finish at or below the measured duration, so a small number of unusually fast failures can't hide a broken test that usually hangs on its timeout.
Using p95 for passes and p50 for failures is deliberately conservative: it compares the slowest reasonable success against the typical failure and requires a clean gap between the two.
### Activation Ratio and Minimum Absolute Gap
The activation ratio is how much larger the fail percentile has to be than the pass percentile before the monitor flags the test. The default of 2 means failures have to typically take at least twice as long as the slowest reasonable pass. Raise it to only surface the worst offenders; lower it to catch milder inflation earlier.
The minimum absolute gap is a floor in milliseconds so tiny durations don't trip the monitor. A test that passes in 10ms and fails in 30ms is technically a 3x ratio but not worth flagging. The default of 3000ms keeps sub-second tests quiet while still catching the multi-second inflation that dominates real CI cost.
### Sample Sizes and Window
The window is how far back the monitor looks for passing and failing runs. The default of 168 hours (one week) keeps the signal tied to recent behavior rather than ancient history.
The minimum pass and fail sample sizes prevent the monitor from acting on thin data. Defaults are 5 passes and 3 failures inside the window, so a test needs enough of both outcomes for the percentile comparison to be meaningful.
### Resolution Ratio
Once a test is active, the monitor watches the fail/pass ratio on subsequent runs. When the ratio drops to or below this ratio, the monitor resolves the test and removes the labels it applied. The default of 1.5 means the test has to come back well under the activation threshold - not just barely - before it clears, which prevents flapping around the activation line.
### Branch Scope
Scope the monitor to branches where timeout inflation matters most, such as `main` or merge queue branches. Feature branches often have intentionally partial test runs or unusual infrastructure and are less useful for measuring inflation.
## What to Do About an Inflated Timeout
When the monitor flags a test, the fix is usually to bring the timeout down to something anchored in the test's real behavior. If the test passes in 2 seconds at p95, it does not need a 60 second timeout — a 3 second timeout gives it 50% more time than it ever uses when healthy, and future breakages will fail fast instead of hanging against the old ceiling.
Bringing the timeout down turns a three-minute retry-and-hang cycle into a few seconds of actual signal, which is the point of the test suite in the first place.
# Atlassian Bamboo
Source: https://docs.trunk.io/flaky-tests/get-started/ci-providers/atlassian-bamboo
Configure Atlassian Bamboo to upload test results to Trunk Flaky Tests
Trunk Flaky Tests integrates with your CI by adding a step in your Bamboo Plans to upload tests with the [Trunk Analytics CLI](../../reference/cli-reference).
**Not using GitHub for source control?**
Flaky Test support for source control providers like GitLab and BitBucket is still experimental. If you're using a source control provider other than GitHub, [**contact us**](mailto:support@trunk.io) **to get started**.
Before you start on these steps, see the [Test Frameworks](../frameworks/) docs for instructions on producing a Trunk-compatible output for your test framework.
## Setup steps
Work through the steps below in order. Once you've finished the last one, you're set up — navigate to [app.trunk.io](https://app.trunk.io) to see your results.
Get your Trunk organization slug and token} />
Set your slug and token as a variable in CI} />
Configure your CI to upload to Trunk} />
Validate your uploads in Trunk} />
## Trunk Organization Slug and Token
Before setting up uploads to Trunk, you must sign in to [app.trunk.io](https://app.trunk.io/login?intent=flaky%20tests) and obtain your Trunk organization slug and token.
### Trunk Slug
You can find your organization slug under **Settings** → **Organization** → **General**. You'll save this as a variable in CI in a later step.
### Trunk Token
You can find your token under **Settings** → **Organization** → **General**, in the **API** section. Since this is a secret, do not leak it publicly. Ensure you get your *organization token*, not your project/repo token.
## Add the Trunk Token as a Secret
Store the Trunk slug and API token obtained in the previous step as [Bamboo plan variables](https://confluence.atlassian.com/bamboo/bamboo-variables-289277087.html). Name them `TRUNK_ORG_URL_SLUG` and `TRUNK_API_TOKEN` respectively, and mark `TRUNK_API_TOKEN` as a **Secret** variable in the Bamboo UI to prevent it from appearing in build logs.
## Upload to Trunk
Add an `Upload Test Results` step after running tests in each of your Bamboo jobs that run tests. This should be minimally all jobs that run on pull requests, as well as from jobs that run on your [stable branches](../../detection#stable-branches), for example, `main`, `master`, or `develop`.
It is important to upload test results from CI runs on [**stable branches**](../../detection#stable-branches), such as `main`, `master`, or `develop`. This will give you a stronger signal about the health of your code and tests.
Trunk can also detect test flakes on PR and merge branches. To best detect flaky tests, it is recommended to upload test results from stable, PR, and merge branch CI runs.
[Learn more about detection](../../detection)
### Example Bamboo Plan Spec
The following is an example of a [Bamboo Plan Spec](https://confluence.atlassian.com/bamboo/bamboo-specs-894743906.html) that uploads test results after your tests run. The upload step is placed under `final-tasks` so it runs even when tests fail. Note: you must either run `trunk` from the repo root when uploading test results or pass a `--repo-root` argument.
To find out how to produce the report files the uploader needs, see the instructions for your test framework in the [frameworks](../frameworks/) docs.
```yaml XML theme={null}
version: 2
plan:
project-key:
key:
name: Run Tests and Upload to Trunk.io
Run Tests and Upload to Trunk:
key:
tasks:
- checkout:
description: Checkout Source Code
- script:
name: Run Tests
body: |
# Your test command here
final-tasks:
- script:
name: Upload Test Results to Trunk.io
body: |
curl -fL --retry 3 "https://github.com/trunk-io/analytics-cli/releases/latest/download/trunk-analytics-cli-x86_64-unknown-linux.tar.gz" | tar -xz
chmod +x trunk-analytics-cli
./trunk-analytics-cli upload \
--junit-paths "" \
--org-url-slug ${bamboo.TRUNK_ORG_URL_SLUG} \
--token ${bamboo.TRUNK_API_TOKEN}
variables:
TRUNK_ORG_URL_SLUG:
TRUNK_API_TOKEN:
```
```yaml Bazel theme={null}
version: 2
plan:
project-key:
key:
name: Run Tests and Upload to Trunk.io
Run Tests and Upload to Trunk:
key:
tasks:
- checkout:
description: Checkout Source Code
- script:
name: Run Tests
body: |
# Your test command here
final-tasks:
- script:
name: Upload Test Results to Trunk.io
body: |
curl -fL --retry 3 "https://github.com/trunk-io/analytics-cli/releases/latest/download/trunk-analytics-cli-x86_64-unknown-linux.tar.gz" | tar -xz
chmod +x trunk-analytics-cli
./trunk-analytics-cli upload \
--bazel-bep-path \
--org-url-slug ${bamboo.TRUNK_ORG_URL_SLUG} \
--token ${bamboo.TRUNK_API_TOKEN}
variables:
TRUNK_ORG_URL_SLUG:
TRUNK_API_TOKEN:
```
```yaml XCode theme={null}
version: 2
plan:
project-key:
key:
name: Run Tests and Upload to Trunk.io
Run Tests and Upload to Trunk:
key:
tasks:
- checkout:
description: Checkout Source Code
- script:
name: Run Tests
body: |
# Your test command here
final-tasks:
- script:
name: Upload Test Results to Trunk.io
body: |
curl -fL --retry 3 "https://github.com/trunk-io/analytics-cli/releases/latest/download/trunk-analytics-cli-x86_64-unknown-linux.tar.gz" | tar -xz
chmod +x trunk-analytics-cli
./trunk-analytics-cli upload \
--xcresult-path \
--org-url-slug ${bamboo.TRUNK_ORG_URL_SLUG} \
--token ${bamboo.TRUNK_API_TOKEN}
variables:
TRUNK_ORG_URL_SLUG:
TRUNK_API_TOKEN:
```
### Uploading from Pull Request Builds
To detect flaky tests on pull requests, configure your plan to create [plan branches](https://confluence.atlassian.com/bamboo/using-plan-branches-289276872.html) for pull requests. Add the following to your Plan Spec:
```yaml theme={null}
branches:
create:
for-pull-request:
accept-fork: false
```
Bamboo automatically sets the `bamboo_repository_pr_key` variable on PR builds, which the Trunk Analytics CLI uses to associate uploads with the correct pull request.
**PR number not detected?** If your Bamboo setup does not set `bamboo_repository_pr_key`, you can override it by passing the `--pr-number` flag or setting the `TRUNK_PR_NUMBER` environment variable when running the upload command.
The examples above use the Linux x64 binary. If your CI runs on a different platform, see the [Trunk Analytics CLI](../../reference/cli-reference#manual-download) page for all available platform downloads.
See the [uploader.md](../../reference/cli-reference.md) for all available command line arguments and usage.
### Stale files
Ensure you report every test run in CI and **clean up stale files** produced by your test framework. If you're reusing test runners and using a glob like `**/junit.xml` to upload tests, stale files not cleaned up will be included in the current test run, throwing off detection of flakiness. You should clean up all your results files after every upload step.
## Validate Your Uploads
Once your pipeline has run on a stable branch, navigate to [app.trunk.io](https://app.trunk.io) and confirm Trunk received your results.
* The **Uploads** tab lists every report Trunk has ingested, with status and any warnings (missing file paths, malformed XML, and so on).
* The **Tests** tab shows individual test cases once an upload has been processed.
If a recent run isn't showing up, check your CI logs for upload errors and confirm your `TRUNK_API_TOKEN` and `TRUNK_ORG_URL_SLUG` secrets are set on the project running the pipeline.
# Azure DevOps Pipelines
Source: https://docs.trunk.io/flaky-tests/get-started/ci-providers/azure-devops-pipelines
Upload test results from Azure DevOps Pipelines to Trunk for flaky test detection.
Trunk Flaky Tests integrates with your CI by adding a step in your Azure DevOps Pipelines to upload tests with the [Trunk Analytics CLI](../../reference/cli-reference).
**Not using GitHub for source control?**
Flaky Test support for source control providers like GitLab and BitBucket is still experimental. If you're using a source control provider other than GitHub, [**contact us**](mailto:support@trunk.io) **to get started**.
Before you start on these steps, see the [Test Frameworks](../frameworks/) docs for instructions on producing a Trunk-compatible output for your test framework.
## Setup steps
Work through the steps below in order. Once you've finished the last one, you're set up — navigate to [app.trunk.io](https://app.trunk.io) to see your results.
Get your Trunk organization slug and token} />
Set your slug and token as a variable in CI} />
Configure your CI to upload to Trunk} />
Validate your uploads in Trunk} />
## Trunk Organization Slug and Token
Before setting up uploads to Trunk, you must sign in to [app.trunk.io](https://app.trunk.io/login?intent=flaky%20tests) and obtain your Trunk organization slug and token.
### Trunk Slug
You can find your organization slug under **Settings** → **Organization** → **General**. You'll save this as a variable in CI in a later step.
### Trunk Token
You can find your token under **Settings** → **Organization** → **General**, in the **API** section. Since this is a secret, do not leak it publicly. Ensure you get your *organization token*, not your project/repo token.
## Add the Trunk Token as a Secret
Store the Trunk slug and API token obtained in the previous step in your Azure DevOps Pipelines as new variables named `TRUNK_ORG_URL_SLUG` and `TRUNK_API_TOKEN` respectively.
## Upload to Trunk
Add an upload step after running tests in each of your CI jobs that run tests. This should be minimally all jobs that run on pull requests, as well as from jobs that run on your [stable branches](../../detection/), for example, `main`, `master`, or `develop`.
It is important to upload test results from CI runs on [**stable branches**](../../detection/), such as `main`, `master`, or `develop`. This will give you a stronger signal about the health of your code and tests.
Trunk can also detect test flakes on PR and merge branches. To best detect flaky tests, it is recommended to upload test results from stable, PR, and merge branch CI runs.
[Learn more about detection](../../detection/)
### Add Uploader to Testing Pipelines
The following is an example of a workflow step to upload test results after your tests run. Note: you must either run `trunk` from the repo root when uploading test results or pass a `--repo-root` argument.
To find out how to produce the report files the uploader needs, see the instructions for your test framework in the [Test Frameworks](/flaky-tests/get-started/frameworks) docs.
```yaml XML theme={null}
trigger:
- main
pool:
vmImage: ubuntu-latest
steps:
# ... Omitted steps
- script: |
curl -fL --retry 3 "https://github.com/trunk-io/analytics-cli/releases/latest/download/trunk-analytics-cli-x86_64-unknown-linux.tar.gz" | tar -xz
chmod +x trunk-analytics-cli
./trunk-analytics-cli upload --junit-paths "" \
--org-url-slug $(TRUNK_ORG_URL_SLUG) \
--token $(TRUNK_API_TOKEN)
condition: always() # this should always run
displayName: Upload test results to Trunk.io
```
```yaml Bazel theme={null}
trigger:
- main
pool:
vmImage: ubuntu-latest
steps:
# ... Omitted steps
- script: |
curl -fL --retry 3 "https://github.com/trunk-io/analytics-cli/releases/latest/download/trunk-analytics-cli-x86_64-unknown-linux.tar.gz" | tar -xz
chmod +x trunk-analytics-cli
./trunk-analytics-cli upload --bazel-bep-path \
--org-url-slug $(TRUNK_ORG_URL_SLUG) \
--token $(TRUNK_API_TOKEN)
condition: always() # this should always run
displayName: Upload test results to Trunk.io
```
```yaml XCode theme={null}
trigger:
- main
pool:
vmImage: ubuntu-latest
steps:
# ... Omitted steps
- script: |
curl -fL --retry 3 "https://github.com/trunk-io/analytics-cli/releases/latest/download/trunk-analytics-cli-x86_64-unknown-linux.tar.gz" | tar -xz
chmod +x trunk-analytics-cli
./trunk-analytics-cli upload --xcresult-path \
--org-url-slug $(TRUNK_ORG_URL_SLUG) \
--token $(TRUNK_API_TOKEN)
condition: always() # this should always run
displayName: Upload test results to Trunk.io
```
```yaml RSpec plugin theme={null}
trigger:
- main
pool:
vmImage: ubuntu-latest
steps:
# ... Omitted steps
- script: |
TRUNK_ORG_URL_SLUG=$(TRUNK_ORG_URL_SLUG) \
TRUNK_API_TOKEN=$(TRUNK_API_TOKEN) \
bundle exec rspec
displayName: Run RSpec tests and upload results to Trunk.io
```
The examples above use the Linux x64 binary. If your CI runs on a different platform, see the [Trunk Analytics CLI](../../reference/cli-reference#manual-download) page for all available platform downloads.
See the [uploader.md](../../reference/cli-reference.md) for all available command line arguments and usage.
### Stale files
Ensure you report every test run in CI and **clean up stale files** produced by your test framework. If you're reusing test runners and using a glob like `**/junit.xml` to upload tests, stale files not cleaned up will be included in the current test run, throwing off detection of flakiness. You should clean up all your results files after every upload step.
[Learn more about cleaning up artifacts in Azure DevOps Pipelines](https://learn.microsoft.com/en-us/azure/devops/pipelines/repos/pipeline-options-for-git?view=azure-devops\&tabs=yaml#clean-the-local-repo-on-the-agent)
## Validate Your Uploads
Once your pipeline has run on a stable branch, navigate to [app.trunk.io](https://app.trunk.io) and confirm Trunk received your results.
* The **Uploads** tab lists every report Trunk has ingested, with status and any warnings (missing file paths, malformed XML, and so on).
* The **Tests** tab shows individual test cases once an upload has been processed.
If a recent run isn't showing up, check your CI logs for upload errors and confirm your `TRUNK_API_TOKEN` and `TRUNK_ORG_URL_SLUG` secrets are set on the project running the pipeline.
# BitBucket Pipelines
Source: https://docs.trunk.io/flaky-tests/get-started/ci-providers/bitbucket-pipelines
Upload test results from Bitbucket Pipelines to Trunk for flaky test detection.
Trunk Flaky Tests integrates with your CI by adding a step in your BitBucket Pipelines to upload tests with the [Trunk Analytics CLI](../../reference/cli-reference).
**Not using GitHub for source control?**
Flaky Test support for source control providers like GitLab and BitBucket is still experimental. If you're using a source control provider other than GitHub, [**contact us**](mailto:support@trunk.io) **to get started**.
Before you start on these steps, see the [Test Frameworks](../frameworks/) docs for instructions on producing a Trunk-compatible output for your test framework.
## Setup steps
Work through the steps below in order. Once you've finished the last one, you're set up — navigate to [app.trunk.io](https://app.trunk.io) to see your results.
Get your Trunk organization slug and token} />
Set your slug and token as a variable in CI} />
Configure your CI to upload to Trunk} />
Validate your uploads in Trunk} />
## Trunk Organization Slug and Token
Before setting up uploads to Trunk, you must sign in to [app.trunk.io](https://app.trunk.io/login?intent=flaky%20tests) and obtain your Trunk organization slug and token.
### Trunk Slug
You can find your organization slug under **Settings** → **Organization** → **General**. You'll save this as a variable in CI in a later step.
### Trunk Token
You can find your token under **Settings** → **Organization** → **General**, in the **API** section. Since this is a secret, do not leak it publicly. Ensure you get your *organization token*, not your project/repo token.
## Add the Trunk Token as a Secret
Store the Trunk slug and API token obtained in the previous step in your BitBucket as a new variable named `TRUNK_ORG_URL_SLUG` and `TRUNK_API_TOKEN` respectively.
## Upload to Trunk
Add an `after-script` step after running tests in each of your CI jobs that run tests. This should be minimally all jobs that run on pull requests, as well as from jobs that run on your [stable branches](../../detection/), for example, `main`, `master`, or `develop`.
It is important to upload test results from CI runs on [**stable branches**](../../detection/), such as `main`, `master`, or `develop`. This will give you a stronger signal about the health of your code and tests.
Trunk can also detect test flakes on PR and merge branches. To best detect flaky tests, it is recommended to upload test results from stable, PR, and merge branch CI runs.
[Learn more about detection](../../detection/)
### Add Uploader to Testing Pipelines
The following is an example of a workflow step to upload test results after your tests run. Note: you must either run `trunk` from the repo root when uploading test results or pass a `--repo-root` argument.
To find out how to produce the JUnit XML files the uploader needs, see the instructions for your test framework in the [Test Frameworks](/flaky-tests/get-started/frameworks) docs.
```yaml XML theme={null}
image:
pipelines:
default:
- step:
# ... omitted setup and build steps
- step:
name: Run Tests and Upload Results
script:
-
after-script:
# trunk upload runs even if the test script fails
- |
curl -fL --retry 3 "https://github.com/trunk-io/analytics-cli/releases/latest/download/trunk-analytics-cli-x86_64-unknown-linux.tar.gz" | tar -xz
chmod +x trunk-analytics-cli
./trunk-analytics-cli upload --junit-paths "**/junit.xml" \
--org-url-slug $TRUNK_ORG_URL_SLUG \
--token $TRUNK_API_TOKEN
```
```yaml Bazel theme={null}
image:
pipelines:
default:
- step:
# ... omitted setup and build steps
- step:
name: Run Tests and Upload Results
script:
-
after-script:
# trunk upload runs even if the test script fails
- |
curl -fL --retry 3 "https://github.com/trunk-io/analytics-cli/releases/latest/download/trunk-analytics-cli-x86_64-unknown-linux.tar.gz" | tar -xz
chmod +x trunk-analytics-cli
./trunk-analytics-cli upload --bazel-bep-path \
--org-url-slug $TRUNK_ORG_URL_SLUG \
--token $TRUNK_API_TOKEN
```
```yaml XCode theme={null}
image:
pipelines:
default:
- step:
# ... omitted setup and build steps
- step:
name: Run Tests and Upload Results
script:
-
after-script:
# trunk upload runs even if the test script fails
- |
curl -fL --retry 3 "https://github.com/trunk-io/analytics-cli/releases/latest/download/trunk-analytics-cli-x86_64-unknown-linux.tar.gz" | tar -xz
chmod +x trunk-analytics-cli
./trunk-analytics-cli upload --xcresult-path \
--org-url-slug $TRUNK_ORG_URL_SLUG \
--token $TRUNK_API_TOKEN
```
```yaml RSpec plugin theme={null}
image:
pipelines:
default:
- step:
# ... omitted setup and build steps
- step:
name: Run Tests and Upload Results
script:
- |
TRUNK_ORG_URL_SLUG=$TRUNK_ORG_URL_SLUG \
TRUNK_API_TOKEN=$TRUNK_API_TOKEN \
bundle exec rspec
```
The examples above use the Linux x64 binary. If your CI runs on a different platform, see the [Trunk Analytics CLI](../../reference/cli-reference#manual-download) page for all available platform downloads.
See the [uploader.md](../../reference/cli-reference.md) for all available command line arguments and usage.
### Stale files
Ensure you report every test run in CI and **clean up stale files** produced by your test framework. If you're reusing test runners and using a glob like `**/junit.xml` to upload tests, stale files not cleaned up will be included in the current test run, throwing off detection of flakiness. You should clean up all your results files after every upload step.
You can do this by omitting the `artifacts` definitions in the test steps of your configuration. [Learn more about artifacts in BitBucket Pipelines](https://support.atlassian.com/bitbucket-cloud/docs/use-artifacts-in-steps/).
## Validate Your Uploads
Once your pipeline has run on a stable branch, navigate to [app.trunk.io](https://app.trunk.io) and confirm Trunk received your results.
* The **Uploads** tab lists every report Trunk has ingested, with status and any warnings (missing file paths, malformed XML, and so on).
* The **Tests** tab shows individual test cases once an upload has been processed.
If a recent run isn't showing up, check your CI logs for upload errors and confirm your `TRUNK_API_TOKEN` and `TRUNK_ORG_URL_SLUG` secrets are set on the project running the pipeline.
# Buildkite
Source: https://docs.trunk.io/flaky-tests/get-started/ci-providers/buildkite
Configure Buildkite jobs to upload test results to Trunk Flaky Tests
Trunk Flaky Tests integrates with your CI by adding a step in your Buildkite Pipelines to upload tests with the [Trunk Analytics CLI](../../reference/cli-reference).
**Not using GitHub for source control?**
Flaky Test support for source control providers like GitLab and BitBucket is still experimental. If you're using a source control provider other than GitHub, [**contact us**](mailto:support@trunk.io) **to get started**.
Before you start on these steps, see the [Test Frameworks](../frameworks/) docs for instructions on producing a Trunk-compatible output for your test framework.
## Setup steps
Work through the steps below in order. Once you've finished the last one, you're set up — navigate to [app.trunk.io](https://app.trunk.io) to see your results.
Get your Trunk organization slug and token} />
Set your slug and token as a variable in CI} />
Configure your CI to upload to Trunk} />
Validate your uploads in Trunk} />
## Trunk Organization Slug and Token
Before setting up uploads to Trunk, you must sign in to [app.trunk.io](https://app.trunk.io/login?intent=flaky%20tests) and obtain your Trunk organization slug and token.
### Trunk Slug
You can find your organization slug under **Settings** → **Organization** → **General**. You'll save this as a variable in CI in a later step.
### Trunk Token
You can find your token under **Settings** → **Organization** → **General**, in the **API** section. Since this is a secret, do not leak it publicly. Ensure you get your *organization token*, not your project/repo token.
## Add the Trunk Token as a Secret
Store the Trunk slug and API token obtained in the previous step in your as a new [Buildkite CI secret](https://buildkite.com/docs/pipelines/security/secrets/managing) named `TRUNK_ORG_URL_SLUG` and `TRUNK_API_TOKEN` respectively.
## Upload to Trunk
Add an `Upload Test Results` step after running tests in each of your CI jobs that run tests. This should be minimally all jobs that run on pull requests, as well as from jobs that run on your [stable branches](../../detection/), for example, `main`, `master`, or `develop`.
It is important to upload test results from CI runs on [**stable branches**](../../detection/), such as `main`, `master`, or `develop`. This will give you a stronger signal about the health of your code and tests.
Trunk can also detect test flakes on PR and merge branches. To best detect flaky tests, it is recommended to upload test results from stable, PR, and merge branch CI runs.
[Learn more about detection](../../detection/)
### Example Buildkite Pipeline
The following is an example of a Buildkite step to upload test results after your tests run. Note: you must either run `trunk` from the repo root when uploading test results or pass a `--repo-root` argument.
To find out how to produce the report files the uploader needs, see the instructions for your test framework in the [frameworks](../frameworks/) docs.
```yaml XML theme={null}
steps:
- label: Run Tests
command: ...
key: tests
- label: Upload Test Results to Trunk.io
commands:
- curl -fL --retry 3 "https://github.com/trunk-io/analytics-cli/releases/latest/download/trunk-analytics-cli-x86_64-unknown-linux.tar.gz" | tar -xz && chmod +x trunk-analytics-cli
- ./trunk-analytics-cli upload --junit-paths "" --org-url-slug --token $TRUNK_API_TOKEN
key: upload
depends_on:
- tests
```
```yaml Bazel theme={null}
steps:
- label: Run Tests
command: ...
key: tests
- label: Upload Test Results to Trunk.io
commands:
- curl -fL --retry 3 "https://github.com/trunk-io/analytics-cli/releases/latest/download/trunk-analytics-cli-x86_64-unknown-linux.tar.gz" | tar -xz && chmod +x trunk-analytics-cli
- ./trunk-analytics-cli upload --bazel-bep-path --org-url-slug --token $TRUNK_API_TOKEN
key: upload
depends_on:
- tests
```
```yaml XCode theme={null}
steps:
- label: Run Tests
command: ...
key: tests
- label: Upload Test Results to Trunk.io
commands:
- curl -fL --retry 3 "https://github.com/trunk-io/analytics-cli/releases/latest/download/trunk-analytics-cli-x86_64-unknown-linux.tar.gz" | tar -xz && chmod +x trunk-analytics-cli
- ./trunk-analytics-cli upload --xcresult-path --org-url-slug --token $TRUNK_API_TOKEN
key: upload
depends_on:
- tests
```
```yaml RSpec plugin theme={null}
steps:
- label: Run Tests and Upload Results to Trunk.io
command: TRUNK_ORG_URL_SLUG=$TRUNK_ORG_URL_SLUG TRUNK_API_TOKEN=$TRUNK_API_TOKEN bundle exec rspec
key: tests
```
The examples above use the Linux x64 binary. If your CI runs on a different platform, see the [Trunk Analytics CLI](../../reference/cli-reference#manual-download) page for all available platform downloads.
See the [uploader.md](../../reference/cli-reference.md) for all available command line arguments and usage.
### Stale files
Ensure you report every test run in CI and **clean up stale files** produced by your test framework. If you're reusing test runners and using a glob like `**/junit.xml` to upload tests, stale files not cleaned up will be included in the current test run, throwing off detection of flakiness. You should clean up all your results files after every upload step.
## Validate Your Uploads
Once your pipeline has run on a stable branch, navigate to [app.trunk.io](https://app.trunk.io) and confirm Trunk received your results.
* The **Uploads** tab lists every report Trunk has ingested, with status and any warnings (missing file paths, malformed XML, and so on).
* The **Tests** tab shows individual test cases once an upload has been processed.
If a recent run isn't showing up, check your CI logs for upload errors and confirm your `TRUNK_API_TOKEN` and `TRUNK_ORG_URL_SLUG` secrets are set on the project running the pipeline.
# CircleCI
Source: https://docs.trunk.io/flaky-tests/get-started/ci-providers/circleci
Configure CircleCI jobs to upload test results to Trunk Flaky Tests
Trunk Flaky Tests integrates with your CI by adding a step in your CircleCI Pipelines to upload tests with the [Trunk Analytics CLI](../../reference/cli-reference).
**Not using GitHub for source control?**
Flaky Test support for source control providers like GitLab and BitBucket is still experimental. If you're using a source control provider other than GitHub, [**contact us**](mailto:support@trunk.io) **to get started**.
Before you start on these steps, see the [Test Frameworks](../frameworks/) docs for instructions on producing a Trunk-compatible output for your test framework.
## Setup steps
Work through the steps below in order. Once you've finished the last one, you're set up — navigate to [app.trunk.io](https://app.trunk.io) to see your results.
Get your Trunk organization slug and token} />
Set your slug and token as a variable in CI} />
Configure your CI to upload to Trunk} />
Validate your uploads in Trunk} />
## Trunk Organization Slug and Token
Before setting up uploads to Trunk, you must sign in to [app.trunk.io](https://app.trunk.io/login?intent=flaky%20tests) and obtain your Trunk organization slug and token.
### Trunk Slug
You can find your organization slug under **Settings** → **Organization** → **General**. You'll save this as a variable in CI in a later step.
### Trunk Token
You can find your token under **Settings** → **Organization** → **General**, in the **API** section. Since this is a secret, do not leak it publicly. Ensure you get your *organization token*, not your project/repo token.
## Add the Trunk Token as a Secret
Store your Trunk slug and API token in your CircleCI project settings under **Environment Variables** as new variables named `TRUNK_ORG_URL_SLUG` and `TRUNK_API_TOKEN` respectively.
## Upload to Trunk
Add an `Upload Test Results` step after running tests in each of your CI jobs that run tests. This should be minimally all jobs that run on pull requests, as well as from jobs that run on your main or [stable branches](../../detection/), for example, `main`, `master`, or `develop`.
The Trunk Analytics CLI automatically detects PR context from CircleCI environment variables, including the pull request number. No additional configuration is needed to associate test uploads with the correct PR in Trunk.
It is important to upload test results from CI runs on [**stable branches**](../../detection/), such as `main`, `master`, or `develop`. This will give you a stronger signal about the health of your code and tests.
Trunk can also detect test flakes on PR and merge branches. To best detect flaky tests, it is recommended to upload test results from stable, PR, and merge branch CI runs.
[Learn more about detection](../../detection/)
### Example CircleCI workflow
The following is an example of a workflow step to upload test results after your tests run. Note: you must either run `trunk` from the repo root when uploading test results or pass a `--repo-root` argument.
To find out how to produce the report files the uploader needs, see the instructions for your test framework in the [Test Frameworks](/flaky-tests/get-started/frameworks) docs.
```yaml XML theme={null}
jobs:
test-node:
# Install node dependencies and run tests
executor: node/default
steps:
- run:
name: Run Tests
command: ...
- run:
name: Upload Test Results to Trunk.io
command: |
curl -fL --retry 3 "https://github.com/trunk-io/analytics-cli/releases/latest/download/trunk-analytics-cli-x86_64-unknown-linux.tar.gz" | tar -xz && chmod +x trunk-analytics-cli
./trunk-analytics-cli upload --junit-paths "**/junit.xml" --org-url-slug --token ${TRUNK_API_TOKEN}
```
```yaml Bazel theme={null}
jobs:
test-node:
# Install node dependencies and run tests
executor: node/default
steps:
- run:
name: Run Tests
command: ...
- run:
name: Upload Test Results to Trunk.io
command: |
curl -fL --retry 3 "https://github.com/trunk-io/analytics-cli/releases/latest/download/trunk-analytics-cli-x86_64-unknown-linux.tar.gz" | tar -xz && chmod +x trunk-analytics-cli
./trunk-analytics-cli upload --bazel-bep-path --org-url-slug --token ${TRUNK_API_TOKEN}
```
```yaml XCode theme={null}
jobs:
test-node:
# Install node dependencies and run tests
executor: node/default
steps:
- run:
name: Run Tests
command: ...
- run:
name: Upload Test Results to Trunk.io
command: |
curl -fL --retry 3 "https://github.com/trunk-io/analytics-cli/releases/latest/download/trunk-analytics-cli-x86_64-unknown-linux.tar.gz" | tar -xz && chmod +x trunk-analytics-cli
./trunk-analytics-cli upload --xcresult-path --org-url-slug --token ${TRUNK_API_TOKEN}
```
```yaml RSpec plugin theme={null}
jobs:
test-node:
# Install node dependencies and run tests
executor: node/default
steps:
- run:
name: Run Tests and Upload Results to Trunk.io
command: TRUNK_ORG_URL_SLUG=${TRUNK_ORG_URL_SLUG} TRUNK_API_TOKEN=${TRUNK_API_TOKEN} bundle exec rspec
```
The examples above use the Linux x64 binary. If your CI runs on a different platform, see the [Trunk Analytics CLI](../../reference/cli-reference#manual-download) page for all available platform downloads.
See the [Uploader CLI Reference](../../reference/cli-reference) for all available command line arguments and usage.
### Stale files
Ensure you report every test run in CI and **clean up stale files** produced by your test framework. If you're reusing test runners and using a glob like `**/junit.xml` to upload tests, stale files not cleaned up will be included in the current test run, throwing off detection of flakiness. You should clean up all your results files after every upload step.
## Validate Your Uploads
Once your pipeline has run on a stable branch, navigate to [app.trunk.io](https://app.trunk.io) and confirm Trunk received your results.
* The **Uploads** tab lists every report Trunk has ingested, with status and any warnings (missing file paths, malformed XML, and so on).
* The **Tests** tab shows individual test cases once an upload has been processed.
If a recent run isn't showing up, check your CI logs for upload errors and confirm your `TRUNK_API_TOKEN` and `TRUNK_ORG_URL_SLUG` secrets are set on the project running the pipeline.
# Drone CI
Source: https://docs.trunk.io/flaky-tests/get-started/ci-providers/droneci
Configure Flaky Tests using Drone CI
Trunk Flaky Tests integrates with your CI by adding a step in your Drone CI Pipelines to upload tests with the [Trunk Analytics CLI](../../reference/cli-reference).
**Not using GitHub for source control?**
Flaky Test support for source control providers like GitLab and BitBucket is still experimental. If you're using a source control provider other than GitHub, [**contact us**](mailto:support@trunk.io) **to get started**.
Before you start on these steps, see the [Test Frameworks](../frameworks/) docs for instructions on producing a Trunk-compatible output for your test framework.
## Setup steps
Work through the steps below in order. Once you've finished the last one, you're set up — navigate to [app.trunk.io](https://app.trunk.io) to see your results.
Get your Trunk organization slug and token} />
Set your slug and token as a variable in CI} />
Configure your CI to upload to Trunk} />
Validate your uploads in Trunk} />
## Trunk Organization Slug and Token
Before setting up uploads to Trunk, you must sign in to [app.trunk.io](https://app.trunk.io/login?intent=flaky%20tests) and obtain your Trunk organization slug and token.
### Trunk Slug
You can find your organization slug under **Settings** → **Organization** → **General**. You'll save this as a variable in CI in a later step.
### Trunk Token
You can find your token under **Settings** → **Organization** → **General**, in the **API** section. Since this is a secret, do not leak it publicly. Ensure you get your *organization token*, not your project/repo token.
## Add the Trunk Token as a Secret
Store your Trunk slug and API token in your Drone CI project settings as new variables named `TRUNK_ORG_URL_SLUG` and `TRUNK_API_TOKEN` respectively.
## Upload to Trunk
Add an upload step after running tests in each of your CI jobs that run tests. This should be minimally all jobs that run on pull requests, as well as from jobs that run on your [stable branches](../../detection/), for example, `main`, `master`, or `develop`.
It is important to upload test results from CI runs on [**stable branches**](../../detection/), such as `main`, `master`, or `develop`. This will give you a stronger signal about the health of your code and tests.
Trunk can also detect test flakes on PR and merge branches. To best detect flaky tests, it is recommended to upload test results from stable, PR, and merge branch CI runs.
[Learn more about detection](../../detection/)
### Add Uploader to Testing Pipelines
The following is an example of a workflow step to upload test results after your tests run. Note: you must either run `trunk` from the repo root when uploading test results or pass a `--repo-root` argument.
To find out how to produce the report files the uploader needs, see the instructions for your test framework in the [Test Frameworks](/flaky-tests/get-started/frameworks) docs.
```yaml XML theme={null}
kind: pipeline
type: docker
name: test
steps:
- name: Run Tests
commands: ...
- name: Upload Test Results to Trunk.io
environment:
TRUNK_ORG_URL_SLUG:
from_secret: TRUNK_ORG_URL_SLUG
TRUNK_API_TOKEN:
from_secret: TRUNK_API_TOKEN
commands:
- curl -fL --retry 3 "https://github.com/trunk-io/analytics-cli/releases/latest/download/trunk-analytics-cli-x86_64-unknown-linux.tar.gz" | tar -xz && chmod +x trunk-analytics-cli
- ./trunk-analytics-cli upload --junit-paths --org-url-slug --token $TRUNK_API_TOKEN
```
```yaml Bazel theme={null}
kind: pipeline
type: docker
name: test
steps:
- name: Run Tests
commands: ...
- name: Upload Test Results to Trunk.io
environment:
TRUNK_ORG_URL_SLUG:
from_secret: TRUNK_ORG_URL_SLUG
TRUNK_API_TOKEN:
from_secret: TRUNK_API_TOKEN
commands:
- curl -fL --retry 3 "https://github.com/trunk-io/analytics-cli/releases/latest/download/trunk-analytics-cli-x86_64-unknown-linux.tar.gz" | tar -xz && chmod +x trunk-analytics-cli
- ./trunk-analytics-cli upload --bazel-bep-path --org-url-slug --token $TRUNK_API_TOKEN
```
```yaml XCode theme={null}
kind: pipeline
type: docker
name: test
steps:
- name: Run Tests
commands: ...
- name: Upload Test Results to Trunk.io
environment:
TRUNK_ORG_URL_SLUG:
from_secret: TRUNK_ORG_URL_SLUG
TRUNK_API_TOKEN:
from_secret: TRUNK_API_TOKEN
commands:
- curl -fL --retry 3 "https://github.com/trunk-io/analytics-cli/releases/latest/download/trunk-analytics-cli-x86_64-unknown-linux.tar.gz" | tar -xz && chmod +x trunk-analytics-cli
- ./trunk-analytics-cli upload --xcresult-path --org-url-slug --token $TRUNK_API_TOKEN
```
```yaml RSpec plugin theme={null}
kind: pipeline
type: docker
name: test
steps:
- name: Run Tests and Upload Results to Trunk.io
environment:
TRUNK_ORG_URL_SLUG:
from_secret: TRUNK_ORG_URL_SLUG
TRUNK_API_TOKEN:
from_secret: TRUNK_API_TOKEN
commands:
- TRUNK_ORG_URL_SLUG=$TRUNK_ORG_URL_SLUG TRUNK_API_TOKEN=$TRUNK_API_TOKEN bundle exec rspec
```
The examples above use the Linux x64 binary. If your CI runs on a different platform, see the [Trunk Analytics CLI](../../reference/cli-reference#manual-download) page for all available platform downloads.
See the [uploader.md](../../reference/cli-reference.md) for all available command line arguments and usage.
### Stale files
Ensure you report every test run in CI and **clean up stale files** produced by your test framework. If you're reusing test runners and using a glob like `**/junit.xml` to upload tests, stale files not cleaned up will be included in the current test run, throwing off detection of flakiness. You should clean up all your results files after every upload step.
## Validate Your Uploads
Once your pipeline has run on a stable branch, navigate to [app.trunk.io](https://app.trunk.io) and confirm Trunk received your results.
* The **Uploads** tab lists every report Trunk has ingested, with status and any warnings (missing file paths, malformed XML, and so on).
* The **Tests** tab shows individual test cases once an upload has been processed.
If a recent run isn't showing up, check your CI logs for upload errors and confirm your `TRUNK_API_TOKEN` and `TRUNK_ORG_URL_SLUG` secrets are set on the project running the pipeline.
# GitHub Actions
Source: https://docs.trunk.io/flaky-tests/get-started/ci-providers/github-actions
Configure Flaky Tests detection using a GitHub Action
Trunk Flaky Tests integrates with your CI by adding a step in your GitHub Action workflow to upload tests with the [Trunk Analytics CLI](../../reference/cli-reference).
Before you start these steps, see the [Test Frameworks](../frameworks/) docs for instructions on producing Trunk-compatible reports for your test framework.
## Setup steps
Work through the steps below in order. Once you've finished the last one, you're set up — navigate to [app.trunk.io](https://app.trunk.io) to see your results.
Get your Trunk organization slug and token} />
Set your slug and token as secrets in GitHub Actions} />
Configure GitHub Actions to upload to Trunk} />
Validate your uploads in Trunk} />
## Trunk Organization Slug and Token
Before setting up uploads to Trunk, you must sign in to [app.trunk.io](https://app.trunk.io/login?intent=flaky%20tests) and obtain your Trunk organization slug and token.
### Trunk Slug
You can find your organization slug under **Settings** → **Organization** → **General**. You'll save this as a variable in CI in a later step.
### Trunk Token
You can find your token under **Settings** → **Organization** → **General**, in the **API** section. Since this is a secret, do not leak it publicly. Ensure you get your *organization token*, not your project/repo token.
## Add Your Trunk Token and Organization Slug as Secrets
Store the Trunk slug and API token obtained in the previous step in your repo as [GitHub secrets](https://docs.github.com/en/actions/security-guides/using-secrets-in-github-actions) named `TRUNK_ORG_URL_SLUG` and `TRUNK_API_TOKEN` respectively.
## Upload to Trunk
Add an `Upload Test Results` step after running tests in each of your CI jobs that run tests. This should minimally include all jobs that run on pull requests, as well as jobs that run on your main or [stable branches](../../detection/), for example, `main`, `master`, or `develop`.
It is important to upload test results from CI runs on [**stable branches**](../../detection/), such as `main`, `master`, or `develop`. This will give you a stronger signal about the health of your code and tests.
Trunk can also detect test flakes on PR and merge branches. To best detect flaky tests, it is recommended to upload test results from stable, PR, and merge branch CI runs.
[Learn more about detection](../../detection/)
### Example GitHub Actions Workflow
The following is an example of a GitHub Actions workflow step to upload test results after your tests using Trunk's [**Analytics Uploader Action**](https://github.com/trunk-io/analytics-uploader).
To find out how to produce the report files the uploader needs, see the instructions for your test framework in the [**Test Frameworks**](../frameworks/) docs.
```yaml JUnit XML theme={null}
jobs:
test:
name: Upload Tests
runs-on: ubuntu-latest
steps:
- name: Run Tests
run: ...
- name: Upload Test Results to Trunk.io
if: ${{ !cancelled() }} # Upload the results even if the tests fail
continue-on-error: true # don't fail this job if the upload fails
uses: trunk-io/analytics-uploader@v2
with:
junit-paths: **/junit.xml
org-slug:
token: ${{ secrets.TRUNK_API_TOKEN }}
```
```yaml XCResult Path theme={null}
jobs:
test:
name: Upload Tests
runs-on: ubuntu-latest
steps:
- name: Run Tests
run: ...
- name: Upload Test Results to Trunk.io
if: ${{ !cancelled() }} # Upload the results even if the tests fail
continue-on-error: true # don't fail this job if the upload fails
uses: trunk-io/analytics-uploader@v2
with:
xcresult-path: ./test-results.xcresult
org-slug:
token: ${{ secrets.TRUNK_API_TOKEN }}
```
```yaml Bazel BEP JSON theme={null}
jobs:
test:
name: Upload Tests
runs-on: ubuntu-latest
steps:
- name: Run Tests
run: ...
- name: Upload Test Results to Trunk.io
if: ${{ !cancelled() }} # Upload the results even if the tests fail
continue-on-error: true # don't fail this job if the upload fails
uses: trunk-io/analytics-uploader@v2
with:
bazel-bep-path: ./build_events.json
org-slug:
token: ${{ secrets.TRUNK_API_TOKEN }}
```
```yaml RSpec plugin theme={null}
jobs:
test:
name: Run and Upload Tests
runs-on: ubuntu-latest
steps:
- name: Run Tests and Upload Results to Trunk.io
run: TRUNK_ORG_URL_SLUG=${{ secrets.TRUNK_ORG_URL_SLUG }} TRUNK_API_TOKEN=${{ secrets.TRUNK_API_TOKEN }} bundle exec rspec
```
See the [GitHub Actions Reference page](https://github.com/trunk-io/analytics-uploader) for all available CLI arguments and usage.
### Enable quarantining
You can quarantine flaky tests by wrapping the test command or as a follow-up step.
Using the Trunk Analytics Uploader Action in your GitHub Actions Workflow files, may need modifications to your workflow files to support quarantining.
If you upload your test results as a second step after you run your tests, **you need to add** `continue-on-error: true` **on your test step so your CI** job will continue even on failures.
Here's an example file.
```yaml highlight={12,13} theme={null}
name: Run Tests And Upload Results
on:
workflow_dispatch:
jobs:
upload-test-results:
runs-on: ubuntu-latest
timeout-minutes: 60
steps:
- name: Run Tests
id: unit_tests
shell: bash
run: # command to run tests goes here
continue-on-error: true # allow CI job to continue to upload step on errors
- name: Upload test results
if: always()
uses: trunk-io/analytics-uploader@v2
with:
junit-paths:
org-slug: my-trunk-org-slug
token: ${{ secrets.TRUNK_API_TOKEN }}
```
If you want to run the test command and upload in a single step, the test command must be **run via the Analytics Uploader** through the `run: ` parameter.
This will override the response code of the test command. Make sure to set `continue-on-error: false` so un-quarantined tests are blocking.
```yaml highlight={16} theme={null}
name: Run Tests And Upload Results
on:
workflow_dispatch:
jobs:
upload-test-results:
runs-on: ubuntu-latest
timeout-minutes: 60
steps:
- name: Checkout
uses: actions/checkout@v3
- name: Run tests and upload results
uses: trunk-io/analytics-uploader@v2
with:
junit-paths:
run: # command to run tests goes here
org-slug: my-trunk-org-slug
token: ${{ secrets.TRUNK_API_TOKEN }}
```
**Using Flaky Tests as a separate step**
If you upload your test results as a second step after you run your tests, you need to make sure your test step **continues on errors** so the upload step that's run after can quarantine failed tests.
When quarantining is enabled, the `trunk-analytics-cli upload` command will **return an error** if there are unquarantined failures and return a status code 0 if all tests are quarantined.
```sh theme={null}
|| true # doesn't fail job on failure
|
./trunk-analytics-cli upload \
--org-url-slug $TRUNK_ORG_URL_SLUG \
--token $TRUNK_API_TOKEN \
--junit-paths $JUNIT_PATH
```
**Using Flaky Tests as a single step**
You can also wrap the test command with the Trunk Analytics CLI. When wrapping the command with the Trunk Analytics CLI, if there are unquarantined tests, the command will return an error. If there are no unquarantined tests, the command will return a status code `0`.
```bash theme={null}
./trunk-analytics-cli test \
--org-url-slug \
--token $TRUNK_API_TOKEN \
--junit-paths $JUNIT_PATH \
--allow-empty-test-results \
```
### Stale files
Ensure you report every test run in CI and **clean up stale files** produced by your test framework. If you're reusing test runners and using a glob like `**/junit.xml` to upload tests, stale files not cleaned up will be included in the current test run, throwing off detection of flakiness. You should clean up all your results files after every upload step.
## Validate Your Uploads
Once your workflow has run on a stable branch, navigate to [app.trunk.io](https://app.trunk.io) and confirm Trunk received your results.
* The **Uploads** tab lists every report Trunk has ingested, with status and any warnings (missing file paths, malformed XML, and so on).
* The **Tests** tab shows individual test cases once an upload has been processed.
If a recent run isn't showing up, check the action logs for upload errors and confirm your `TRUNK_API_TOKEN` and `TRUNK_ORG_URL_SLUG` secrets are set on the repo running the workflow.
## Getting Direct Links to Job Logs
**Direct Links to Job Logs is an optional configuration, and relies on a** [**third-party actions dependency**](https://github.com/marketplace/actions/get-action-job-id)**.**
By default, Trunk Flaky Tests links to your overall workflow run when you click "Logs" on a test failure. However, GitHub Actions makes it difficult to get a direct link to the specific job where the test ran.
If you want **direct links to individual job logs** instead of the workflow run, you can manually set the `JOB_URL` environment variable using a third-party action to extract the job ID.
### Setup
1. **Add the job ID extraction step** to your workflow using a community action:
```yaml highlight={9-16} theme={null}
jobs:
run_tests:
runs-on: ubuntu-latest
name: Run Tests # This name is important - use it in the next step
steps:
- name: Checkout
uses: actions/checkout@v3
# Extract the job ID
- name: Get Job ID
id: get-job-id
uses: ayachensiyuan/get-action-job-id@v1.6
env:
GITHUB_TOKEN: ${{ secrets.GITHUB_TOKEN }}
with:
job-name: Run Tests # Must match the job 'name' above
```
2. **Pass the job URL** when uploading test results:
```yaml highlight={13-14} theme={null}
- name: Run Tests
id: unit_tests
run:
continue-on-error: true
- name: Upload test results
if: always()
uses: trunk-io/analytics-uploader@v2
with:
junit-paths:
org-slug: my-trunk-org-slug
token: ${{ secrets.TRUNK_API_TOKEN }}
env:
JOB_URL: https://github.com/${{ github.repository }}/actions/runs/${{ github.run_id }}/job/${{ steps.get-job-id.outputs.jobId }}
```
### Complete Example
Here's a full workflow example with direct job linking:
```yaml theme={null}
name: Run Tests And Upload Results
on:
push:
pull_request:
jobs:
test-suite:
runs-on: ubuntu-latest
name: Test Suite
steps:
- name: Checkout
uses: actions/checkout@v3
- name: Get Job ID
id: get-job-id
uses: ayachensiyuan/get-action-job-id@v1.6
env:
GITHUB_TOKEN: ${{ secrets.GITHUB_TOKEN }}
with:
job-name: Test Suite
- name: Run Tests
run: npm test
continue-on-error: true
- name: Upload test results
if: always()
uses: trunk-io/analytics-uploader@v2
with:
junit-paths: junit.xml
org-slug: my-trunk-org-slug
token: ${{ secrets.TRUNK_API_TOKEN }}
env:
JOB_URL: https://github.com/${{ github.repository }}/actions/runs/${{ github.run_id }}/job/${{ steps.get-job-id.outputs.jobId }}
```
### How It Works
* The `ayachensiyuan/get-action-job-id` [action](https://github.com/marketplace/actions/get-action-job-id) extracts the GitHub Actions job ID
* We construct the full job URL using: `https://github.com/{repo}/actions/runs/{run_id}/job/{job_id}`
* This URL is passed to Trunk via the `JOB_URL` environment variable
* When you click "Logs" on a test failure in Trunk, you'll go directly to that job's logs instead of the workflow overview
### Notes
* The `job-name` parameter must **exactly match** your job's `name` field
* The `GITHUB_TOKEN` must have appropriate permissions to read workflow job information
* If the job ID extraction fails, Trunk will fall back to linking to the workflow run
# GitLab
Source: https://docs.trunk.io/flaky-tests/get-started/ci-providers/gitlab
Configure Flaky Tests using GitLab CI
Trunk Flaky Tests integrates with your CI by adding a step in your GitLab CI/CD pipelines to upload tests with the [Trunk Analytics CLI](../../reference/cli-reference).
**Not using GitHub for source control?**
Flaky Test support for source control providers like GitLab and BitBucket is still experimental. If you're using a source control provider other than GitHub, [**contact us**](mailto:support@trunk.io) **to get started**.
Before you start on these steps, see the [Test Frameworks](../frameworks/) docs for instructions on producing a Trunk-compatible output for your test framework.
## Setup steps
Work through the steps below in order. Once you've finished the last one, you're set up — navigate to [app.trunk.io](https://app.trunk.io) to see your results.
Get your Trunk organization slug and token} />
Set your slug and token as a variable in CI} />
Configure your CI to upload to Trunk} />
Validate your uploads in Trunk} />
## Trunk Organization Slug and Token
Before setting up uploads to Trunk, you must sign in to [app.trunk.io](https://app.trunk.io/login?intent=flaky%20tests) and obtain your Trunk organization slug and token.
### Trunk Slug
You can find your organization slug under **Settings** → **Organization** → **General**. You'll save this as a variable in CI in a later step.
### Trunk Token
You can find your token under **Settings** → **Organization** → **General**, in the **API** section. Since this is a secret, do not leak it publicly. Ensure you get your *organization token*, not your project/repo token.
## Add the Trunk Token as a Secret
Store the Trunk slug and API token obtained in the previous step in your GitLab CI/CD pipelines as new [GitLab Variables](https://docs.gitlab.com/ee/ci/variables/index.html#for-a-project) named `TRUNK_ORG_URL_SLUG` and `TRUNK_API_TOKEN` respectively.
## Upload to Trunk
Add an `upload_test_results` step after running tests in each of your CI jobs that run tests. This should be minimally all jobs that run on pull requests, as well as from jobs that run on your main or [stable branches](../../detection/), for example, `main`, `master`, or `develop`.
It is important to upload test results from CI runs on [**stable branches**](../../detection/), such as `main`, `master`, or `develop`. This will give you a stronger signal about the health of your code and tests.
Trunk can also detect test flakes on PR and merge branches. To best detect flaky tests, it is recommended to upload test results from stable, PR, and merge branch CI runs.
[Learn more about detection](../../detection/)
### Example GitLab Pipeline
The following is an example of a GitLab pipeline step to upload test results after your tests run. Note: you must either run `trunk` from the repo root when uploading test results or pass a `--repo-root` argument.
To find out how to produce the report files the uploader needs, see the instructions for your test framework in the [frameworks](../frameworks/) docs.
```yaml XML theme={null}
image: node:latest
stages: # List of stages for jobs, and their order of execution
- test
- flaky-tests
unit_test_job: # This job runs the tests
stage: test
script: ...
upload_test_results: # This job uploads tests results run in the last stage to Trunk.io
stage: flaky-tests
script:
- curl -fL --retry 3 "https://github.com/trunk-io/analytics-cli/releases/latest/download/trunk-analytics-cli-x86_64-unknown-linux.tar.gz" | tar -xz && chmod +x trunk-analytics-cli
- ./trunk-analytics-cli upload --junit-paths "" --org-url-slug --token $TRUNK_API_TOKEN
```
```yaml Bazel theme={null}
image: node:latest
stages: # List of stages for jobs, and their order of execution
- test
- flaky-tests
unit_test_job: # This job runs the tests
stage: test
script: ...
upload_test_results: # This job uploads tests results run in the last stage to Trunk.io
stage: flaky-tests
script:
- curl -fL --retry 3 "https://github.com/trunk-io/analytics-cli/releases/latest/download/trunk-analytics-cli-x86_64-unknown-linux.tar.gz" | tar -xz && chmod +x trunk-analytics-cli
- ./trunk-analytics-cli upload --bazel-bep-path --org-url-slug --token $TRUNK_API_TOKEN
```
```yaml XCode theme={null}
image: node:latest
stages: # List of stages for jobs, and their order of execution
- test
- flaky-tests
unit_test_job: # This job runs the tests
stage: test
script: ...
upload_test_results: # This job uploads tests results run in the last stage to Trunk.io
stage: flaky-tests
script:
- curl -fL --retry 3 "https://github.com/trunk-io/analytics-cli/releases/latest/download/trunk-analytics-cli-x86_64-unknown-linux.tar.gz" | tar -xz && chmod +x trunk-analytics-cli
- ./trunk-analytics-cli upload --xcresult-path --org-url-slug --token $TRUNK_API_TOKEN
```
```yaml RSpec plugin theme={null}
image: node:latest
stages: # List of stages for jobs, and their order of execution
- test
unit_test_job: # This job runs the tests and uploads the results to Trunk.io
stage: test
script:
- TRUNK_ORG_URL_SLUG=$TRUNK_ORG_URL_SLUG TRUNK_API_TOKEN=$TRUNK_API_TOKEN bundle exec rspec
```
The examples above use the Linux x64 binary. If your CI runs on a different platform, see the [Trunk Analytics CLI](../../reference/cli-reference#manual-download) page for all available platform downloads.
See the [uploader.md](../../reference/cli-reference.md) for all available command line arguments and usage.
### Stale files
Ensure you report every test run in CI and **clean up stale files** produced by your test framework. If you're reusing test runners and using a glob like `**/junit.xml` to upload tests, stale files not cleaned up will be included in the current test run, throwing off detection of flakiness. You should clean up all your results files after every upload step.
## Validate Your Uploads
Once your pipeline has run on a stable branch, navigate to [app.trunk.io](https://app.trunk.io) and confirm Trunk received your results.
* The **Uploads** tab lists every report Trunk has ingested, with status and any warnings (missing file paths, malformed XML, and so on).
* The **Tests** tab shows individual test cases once an upload has been processed.
If a recent run isn't showing up, check your CI logs for upload errors and confirm your `TRUNK_API_TOKEN` and `TRUNK_ORG_URL_SLUG` secrets are set on the project running the pipeline.
# Google Cloud Build
Source: https://docs.trunk.io/flaky-tests/get-started/ci-providers/google-cloud-build
Configure Google Cloud Build to upload test results to Trunk Flaky Tests
Trunk Flaky Tests integrates with your CI by adding a step in your Google Cloud Build configuration to upload tests with the [Trunk Analytics CLI](../../reference/cli-reference).
**Not using GitHub for source control?**
Flaky Test support for source control providers like GitLab and BitBucket is still experimental. If you're using a source control provider other than GitHub, [**contact us**](mailto:support@trunk.io) **to get started**.
Before you start on these steps, see the [Test Frameworks](../frameworks/) docs for instructions on producing a Trunk-compatible output for your test framework.
## Setup steps
Work through the steps below in order. Once you've finished the last one, you're set up — navigate to [app.trunk.io](https://app.trunk.io) to see your results.
Get your Trunk organization slug and token} />
Store your token in GCP Secret Manager} />
Connect your GitHub repos to Cloud Build} />
Create Cloud Build triggers for PR and push events} />
Configure your cloudbuild.yaml to upload to Trunk} />
Validate your uploads in Trunk} />
## Trunk Organization Slug and Token
Before setting up uploads to Trunk, you must sign in to [app.trunk.io](https://app.trunk.io/login?intent=flaky%20tests) and obtain your Trunk organization slug and token.
### Trunk Slug
You can find your organization slug under **Settings** → **Organization** → **General**. You'll save this as a variable in CI in a later step.
### Trunk Token
You can find your token under **Settings** → **Organization** → **General**, in the **API** section. Since this is a secret, do not leak it publicly. Ensure you get your *organization token*, not your project/repo token.
## Store the Trunk Token in GCP Secret Manager
Store your Trunk API token in [GCP Secret Manager](https://console.cloud.google.com/security/secret-manager) so Cloud Build can securely access it during builds.
1. Open **GCP Console** → **Secret Manager**.
2. Click **Create Secret**.
3. Name the secret (for example, `trunk-api-token`) and paste your Trunk organization API token as the value.
4. Click **Create**.
You'll reference this secret in your `cloudbuild.yaml` using the `availableSecrets` and `secretEnv` fields.
## Connect GitHub Repos to Cloud Build
Ensure your GitHub repositories are connected to Cloud Build through the [Cloud Build GitHub App](https://cloud.google.com/build/docs/automating-builds/github/connect-repo-github).
1. Open **GCP Console** → **Cloud Build** → **Repositories**.
2. Connect your GitHub repository using the Cloud Build GitHub App.
## Create Cloud Build Triggers
Create two Cloud Build triggers for each repository you want to upload test results from:
1. Open **GCP Console** → **Cloud Build** → **Triggers**.
2. Create a trigger for **pull request events** — this uploads test results from PR branches.
3. Create a trigger for **push events** to your stable branch (for example, `main`) — this uploads test results from your stable branch.
It is important to upload test results from CI runs on [**stable branches**](../../detection#stable-branches), such as `main`, `master`, or `develop`. This will give you a stronger signal about the health of your code and tests.
Trunk can also detect test flakes on PR and merge branches. To best detect flaky tests, it is recommended to upload test results from stable, PR, and merge branch CI runs.
[Learn more about detection](../../detection)
## Upload to Trunk
Add an upload step in your `cloudbuild.yaml` that runs after your test steps. The Trunk CLI automatically detects Google Cloud Build when the `TRIGGER_NAME` environment variable is set.
Google Cloud Build does not automatically provide environment variables to build steps. You must explicitly pass the required substitution variables in your `cloudbuild.yaml` using the `env` field. Without these variables, the CLI cannot detect your CI platform or link uploads to the correct branches and pull requests.
### Required Environment Variables
The following environment variables must be passed to the upload step:
| Variable | Description |
| -------------- | -------------------------------------------------------------------- |
| `TRIGGER_NAME` | Name of the Cloud Build trigger (used for CI platform detection) |
| `PROJECT_ID` | GCP project ID (used to construct the CI job link) |
| `BUILD_ID` | Unique ID of the Cloud Build run (used to construct the CI job link) |
| `BRANCH_NAME` | Git branch being built (used for push/stable branch uploads) |
| `_HEAD_BRANCH` | Head branch for PR-triggered builds |
| `_PR_NUMBER` | Pull request number for PR-triggered builds |
### Example `cloudbuild.yaml`
The following is an example of a `cloudbuild.yaml` configuration that runs tests and uploads results to Trunk. Note: you must either run `trunk` from the repo root when uploading test results or pass a `--repo-root` argument.
To find out how to produce the report files the uploader needs, see the instructions for your test framework in the [Test Frameworks](../frameworks/) docs.
```yaml XML theme={null}
steps:
- name: gcr.io/cloud-builders/npm
id: run-tests
script: |
#!/bin/bash
set -euo pipefail
npm install
npm test
timeout: 600s
allowExitCodes: [0, 1]
- name: gcr.io/cloud-builders/gcloud
id: upload-test-results
script: |
#!/bin/bash
set -euo pipefail
curl -fL --retry 3 "https://github.com/trunk-io/analytics-cli/releases/latest/download/trunk-analytics-cli-x86_64-unknown-linux.tar.gz" | tar -xz && chmod +x trunk-analytics-cli
./trunk-analytics-cli upload \
--junit-paths "" \
--org-url-slug \
--token "${TRUNK_API_TOKEN}"
waitFor:
- run-tests
timeout: 300s
env:
- "PROJECT_ID=${PROJECT_ID}"
- "BUILD_ID=${BUILD_ID}"
- "TRIGGER_NAME=${TRIGGER_NAME}"
- "BRANCH_NAME=${BRANCH_NAME}"
- "_HEAD_BRANCH=${_HEAD_BRANCH}"
- "_PR_NUMBER=${_PR_NUMBER}"
secretEnv: ["TRUNK_API_TOKEN"]
options:
logging: CLOUD_LOGGING_ONLY
timeout: 1200s
availableSecrets:
secretManager:
- versionName: projects/${PROJECT_ID}/secrets//versions/latest
env: TRUNK_API_TOKEN
```
```yaml Bazel theme={null}
steps:
- name: gcr.io/cloud-builders/bazel
id: run-tests
args: ['test', '//...', '--build_event_json_file=bep.json']
timeout: 600s
allowExitCodes: [0, 1]
- name: gcr.io/cloud-builders/gcloud
id: upload-test-results
script: |
#!/bin/bash
set -euo pipefail
curl -fL --retry 3 "https://github.com/trunk-io/analytics-cli/releases/latest/download/trunk-analytics-cli-x86_64-unknown-linux.tar.gz" | tar -xz && chmod +x trunk-analytics-cli
./trunk-analytics-cli upload \
--bazel-bep-path bep.json \
--org-url-slug \
--token "${TRUNK_API_TOKEN}"
waitFor:
- run-tests
timeout: 300s
env:
- "PROJECT_ID=${PROJECT_ID}"
- "BUILD_ID=${BUILD_ID}"
- "TRIGGER_NAME=${TRIGGER_NAME}"
- "BRANCH_NAME=${BRANCH_NAME}"
- "_HEAD_BRANCH=${_HEAD_BRANCH}"
- "_PR_NUMBER=${_PR_NUMBER}"
secretEnv: ["TRUNK_API_TOKEN"]
options:
logging: CLOUD_LOGGING_ONLY
timeout: 1200s
availableSecrets:
secretManager:
- versionName: projects/${PROJECT_ID}/secrets//versions/latest
env: TRUNK_API_TOKEN
```
The examples above use the Linux x64 binary. If your CI runs on a different platform, see the [Trunk Analytics CLI](../../reference/cli-reference#manual-download) page for all available platform downloads.
**Important:** Set `allowExitCodes: [0, 1]` on your test step so the upload step runs even when tests fail. Without this, Cloud Build stops the pipeline on test failures and your results won't be uploaded.
Replace the following placeholders in the example:
| Placeholder | Description |
| ---------------------- | ------------------------------------------------------------------------------------ |
| `` | Glob pattern matching your JUnit XML test report files (for example, `**/junit.xml`) |
| `` | Your Trunk organization slug |
| `` | The name of the secret you created in GCP Secret Manager |
See the [Trunk Analytics CLI](../../reference/cli-reference.md) for all available command line arguments and usage.
### Stale files
Ensure you report every test run in CI and **clean up stale files** produced by your test framework. If you're reusing test runners and using a glob like `**/junit.xml` to upload tests, stale files not cleaned up will be included in the current test run, throwing off detection of flakiness. You should clean up all your results files after every upload step.
## Validate Your Uploads
Once your pipeline has run on a stable branch, navigate to [app.trunk.io](https://app.trunk.io) and confirm Trunk received your results.
* The **Uploads** tab lists every report Trunk has ingested, with status and any warnings (missing file paths, malformed XML, and so on).
* The **Tests** tab shows individual test cases once an upload has been processed.
If a recent run isn't showing up, check your CI logs for upload errors and confirm your `TRUNK_API_TOKEN` and `TRUNK_ORG_URL_SLUG` secrets are set on the project running the pipeline.
# CI Providers
Source: https://docs.trunk.io/flaky-tests/get-started/ci-providers/index
You can easily integrate Flaky Tests from any CI Provider
Trunk Flaky Tests integrates with your CI by adding a `Upload Test Results` step in each of your testing CI jobs via the [Trunk Analytics CLI](../../reference/cli-reference). See the [Test Frameworks](../frameworks/) docs for instructions on producing test reports for your test runner, which Trunk can ingest.
**Not using GitHub for source control?**
Flaky Test support for source control providers like GitLab and BitBucket is still experimental. If you're using a source control provider other than GitHub, [**contact us**](mailto:support@trunk.io) **to get started**.
## Quickstart
# Jenkins
Source: https://docs.trunk.io/flaky-tests/get-started/ci-providers/jenkins
Configure Flaky Tests using Jenkins
Trunk Flaky Tests integrates with your CI by adding a step in your Jenkins Pipelines to upload tests with the [Trunk Analytics CLI](../../reference/cli-reference).
**Not using GitHub for source control?**
Flaky Test support for source control providers like GitLab and BitBucket is still experimental. If you're using a source control provider other than GitHub, [**contact us**](mailto:support@trunk.io) **to get started**.
Before you start on these steps, see the [Test Frameworks](../frameworks/) docs for instructions on producing a Trunk-compatible output for your test framework.
## Setup steps
Work through the steps below in order. Once you've finished the last one, you're set up — navigate to [app.trunk.io](https://app.trunk.io) to see your results.
Get your Trunk organization slug and token} />
Set your slug and token as a variable in CI} />
Configure your CI to upload to Trunk} />
Validate your uploads in Trunk} />
## Trunk Organization Slug and Token
Before setting up uploads to Trunk, you must sign in to [app.trunk.io](https://app.trunk.io/login?intent=flaky%20tests) and obtain your Trunk organization slug and token.
### Trunk Slug
You can find your organization slug under **Settings** → **Organization** → **General**. You'll save this as a variable in CI in a later step.
### Trunk Token
You can find your token under **Settings** → **Organization** → **General**, in the **API** section. Since this is a secret, do not leak it publicly. Ensure you get your *organization token*, not your project/repo token.
## Add the Trunk Token as a Secret
Store the Trunk slug and API token obtained in the previous step in your Jenkins as new credentials named `TRUNK_ORG_URL_SLUG` and `TRUNK_API_TOKEN` respectively.
## Upload to Trunk
Add an `Upload Test Results` step after running tests in each of your CI jobs that run tests. This should be minimally all jobs that run on pull requests, as well as from jobs that run on your main or [stable branches](../../detection/), for example, `main`, `master`, or `develop`.
It is important to upload test results from CI runs on [**stable branches**](../../detection/), such as `main`, `master`, or `develop`. This will give you a stronger signal about the health of your code and tests.
Trunk can also detect test flakes on PR and merge branches. To best detect flaky tests, it is recommended to upload test results from stable, PR, and merge branch CI runs.
[Learn more about detection](../../detection/)
### Example Jenkins Pipeline
The following is an example of a Jenkins pipeline step to upload test results after your tests run. Note: you must either run `trunk` from the repo root when uploading test results or pass a `--repo-root` argument.
To find out how to produce the report files the uploader needs, see the instructions for your test framework in the [Test Frameworks](../frameworks/) docs
```groovy XML theme={null}
pipeline {
environment {
TRUNK_API_TOKEN = credentials('TRUNK_API_TOKEN')
}
stages {
stage('Run Tests'){
...
}
stage('Upload Test Results'){
sh 'curl -fL --retry 3 "https://github.com/trunk-io/analytics-cli/releases/latest/download/trunk-analytics-cli-x86_64-unknown-linux.tar.gz" | tar -xz && chmod +x trunk-analytics-cli'
sh './trunk-analytics-cli upload --junit-paths "" --org-url-slug --token $TRUNK_API_TOKEN'
}
}
}
```
```yaml Bazel theme={null}
pipeline {
environment {
TRUNK_API_TOKEN = credentials('TRUNK_API_TOKEN')
}
stages {
stage('Run Tests'){
...
}
stage('Upload Test Results'){
sh 'curl -fL --retry 3 "https://github.com/trunk-io/analytics-cli/releases/latest/download/trunk-analytics-cli-x86_64-unknown-linux.tar.gz" | tar -xz && chmod +x trunk-analytics-cli'
sh './trunk-analytics-cli upload --bazel-bep-path --org-url-slug --token $TRUNK_API_TOKEN'
}
}
}
```
```yaml XCode theme={null}
pipeline {
environment {
TRUNK_API_TOKEN = credentials('TRUNK_API_TOKEN')
}
stages {
stage('Run Tests'){
...
}
stage('Upload Test Results'){
sh 'curl -fL --retry 3 "https://github.com/trunk-io/analytics-cli/releases/latest/download/trunk-analytics-cli-x86_64-unknown-linux.tar.gz" | tar -xz && chmod +x trunk-analytics-cli'
sh './trunk-analytics-cli upload --xcresult-path --org-url-slug --token $TRUNK_API_TOKEN'
}
}
}
```
```groovy RSpec plugin theme={null}
pipeline {
environment {
TRUNK_ORG_URL_SLUG = credentials('TRUNK_ORG_URL_SLUG')
TRUNK_API_TOKEN = credentials('TRUNK_API_TOKEN')
}
stages {
stage('Run Tests and Upload Results to Trunk.io'){
sh 'TRUNK_ORG_URL_SLUG=$TRUNK_ORG_URL_SLUG TRUNK_API_TOKEN=$TRUNK_API_TOKEN bundle exec rspec'
}
}
}
```
The examples above use the Linux x64 binary. If your CI runs on a different platform, see the [Trunk Analytics CLI](../../reference/cli-reference#manual-download) page for all available platform downloads.
See the [uploader.md](../../reference/cli-reference.md) for all available command line arguments and usage.
### Stale files
Ensure you report every test run in CI and **clean up stale files** produced by your test framework. If you're reusing test runners and using a glob like `**/junit.xml` to upload tests, stale files not cleaned up will be included in the current test run, throwing off detection of flakiness. You should clean up all your results files after every upload step.
## Validate Your Uploads
Once your pipeline has run on a stable branch, navigate to [app.trunk.io](https://app.trunk.io) and confirm Trunk received your results.
* The **Uploads** tab lists every report Trunk has ingested, with status and any warnings (missing file paths, malformed XML, and so on).
* The **Tests** tab shows individual test cases once an upload has been processed.
If a recent run isn't showing up, check your CI logs for upload errors and confirm your `TRUNK_API_TOKEN` and `TRUNK_ORG_URL_SLUG` secrets are set on the project running the pipeline.
# Other CI Providers
Source: https://docs.trunk.io/flaky-tests/get-started/ci-providers/otherci
Configure Flaky Tests using any CI Provider
Trunk Flaky Tests integrates with your CI provider by adding an upload step in each of your testing CI jobs via the [Trunk Analytics CLI](../../reference/cli-reference).
**Not using GitHub for source control?**
Flaky Test support for source control providers like GitLab and BitBucket is still experimental. If you're using a source control provider other than GitHub, [**contact us**](mailto:support@trunk.io) **to get started**.
Before you start on these steps, see the [Test Frameworks](../frameworks/) docs for instructions on producing JUnit XML output for your test runner, supported by virtually all test frameworks, which is what Trunk ingests.
## Setup steps
Work through the steps below in order. Once you've finished the last one, you're set up — navigate to [app.trunk.io](https://app.trunk.io) to see your results.
Get your Trunk organization slug and token} />
Set your slug and token as a variable in CI} />
Configure your CI to upload to Trunk} />
Validate your uploads in Trunk} />
## Trunk Organization Slug and Token
Before setting up uploads to Trunk, you must sign in to [app.trunk.io](https://app.trunk.io/login?intent=flaky%20tests) and obtain your Trunk organization slug and token.
### Trunk Slug
You can find your organization slug under **Settings** → **Organization** → **General**. You'll save this as a variable in CI in a later step.
### Trunk Token
You can find your token under **Settings** → **Organization** → **General**, in the **API** section. Since this is a secret, do not leak it publicly. Ensure you get your *organization token*, not your project/repo token.
## Add the Trunk Token as a Secret
Store the Trunk slug and API token obtained in the previous step in your CI provider as a secret, environment variable, or an equivalent concept and name them `TRUNK_ORG_URL_SLUG` and `TRUNK_API_TOKEN` respectively.
## Upload to Trunk
Add an `Upload Test Results` step after running tests in each of your CI jobs that run tests. This should be minimally all jobs that run on pull requests, as well as from jobs that run on your main or [stable branches](../../detection/), for example,`main`, `master`, or `develop`.
It is important to upload test results from CI runs on [**stable branches**](../../detection/), such as `main`, `master`, or `develop`. This will give you a stronger signal about the health of your code and tests.
Trunk can also detect test flakes on PR and merge branches. To best detect flaky tests, it is recommended to upload test results from stable, PR, and merge branch CI runs.
[Learn more about detection](../../detection/)
### Example Upload Script
The following is an example of a script to upload test results after your tests run. Note: you must either run `trunk` from the repo root when uploading test results or pass a `--repo-root` argument.
To find out how to produce the report files the uploader needs, see the instructions for your test framework in the [frameworks](../frameworks/) docs.
You can install the Trunk Analytics CLI locally like this:
```bash Linux (x64) theme={null}
SKU="trunk-analytics-cli-x86_64-unknown-linux.tar.gz"
curl -fL --retry 3 \
"https://github.com/trunk-io/analytics-cli/releases/latest/download/${SKU}" \
| tar -xz
chmod +x trunk-analytics-cli
```
```bash Linux (arm64) theme={null}
SKU="trunk-analytics-cli-aarch64-unknown-linux.tar.gz"
curl -fL --retry 3 \
"https://github.com/trunk-io/analytics-cli/releases/latest/download/${SKU}" \
| tar -xz
chmod +x trunk-analytics-cli
```
```bash macOS (arm64) theme={null}
SKU="trunk-analytics-cli-aarch64-apple-darwin.tar.gz"
curl -fL --retry 3 \
"https://github.com/trunk-io/analytics-cli/releases/latest/download/${SKU}" \
| tar -xz
chmod +x trunk-analytics-cli
```
```bash macOS (x64) theme={null}
SKU="trunk-analytics-cli-x86_64-apple-darwin.tar.gz"
curl -fL --retry 3 \
"https://github.com/trunk-io/analytics-cli/releases/latest/download/${SKU}" \
| tar -xz
chmod +x trunk-analytics-cli
```
Then, you can validate the results using the `trunk-analytics-cli validate` command like this:
```bash theme={null}
./trunk-analytics-cli validate --junit-paths
```
See the [uploader.md](../../reference/cli-reference.md) for all available command line arguments and usage.
### Environment Variables
Set these environment variables before running `trunk-analytics-cli upload` on unsupported CI systems:
**Config Requirement:** `CUSTOM` must be set to `true` for environment variables to take effect and override the auto-detection of CI.
All other variables are optional but recommended.
| Variable | Description | Example |
| ---------------- | ---------------------------------------------------------------------------------------------------------------- | ------------------------------------- |
| `CUSTOM` | Set to `true` to indicate this CI system is not one of our supported providers | `CUSTOM=true` |
| `JOB_URL` | Direct link to the CI job/build page. This is the link users will click when viewing test failure logs in Trunk. | `https://ci.example.com/builds/12345` |
| `JOB_NAME` | Name of the CI job or test suite | `unit-tests` |
| `AUTHOR_EMAIL` | Email address of the commit author | `dev@example.com` |
| `AUTHOR_NAME` | Full name of the commit author | `Jane Developer` |
| `COMMIT_BRANCH` | Git branch being tested | `main` |
| `COMMIT_MESSAGE` | Commit message for the tested commit | `Fix authentication bug` |
| `PR_NUMBER` | Pull request number (if applicable) | `123` |
| `PR_TITLE` | Pull request title (if applicable) | `Add new feature` |
### About JOB\_URL
The `JOB_URL` variable controls where the "Logs" link in Trunk Flaky Tests points to. When users click "Logs" on a test failure, they'll be taken to this URL to view the complete CI job output.
**Best practice:** Provide the most specific link possible:
* Direct link to the specific job/build where the test ran
* Link that shows the full logs and test output
* **Avoid** dashboard or workflow overview links (less helpful for debugging)
**For GitHub Actions users:** While GitHub Actions is auto-detected, you can override the default workflow URL with a direct job URL. See [GitHub Actions - Getting Direct Links to Job Logs](./github-actions#getting-direct-links-to-job-logs) for instructions.
### Stale files
Ensure you report every test run in CI and **clean up stale files** produced by your test framework. If you're reusing test runners and using a glob like `**/junit.xml` to upload tests, stale files not cleaned up will be included in the current test run, throwing off detection of flakiness. You should clean up all your results files after every upload step.
## Validate Your Uploads
Once your pipeline has run on a stable branch, navigate to [app.trunk.io](https://app.trunk.io) and confirm Trunk received your results.
* The **Uploads** tab lists every report Trunk has ingested, with status and any warnings (missing file paths, malformed XML, and so on).
* The **Tests** tab shows individual test cases once an upload has been processed.
If a recent run isn't showing up, check your CI logs for upload errors and confirm your `TRUNK_API_TOKEN` and `TRUNK_ORG_URL_SLUG` secrets are set on the project running the pipeline.
# Semaphore CI
Source: https://docs.trunk.io/flaky-tests/get-started/ci-providers/semaphoreci
Configure Flaky Tests using Semaphore CI
Trunk Flaky Tests integrates with your CI by adding a step in your Semaphore CI Pipeline to upload tests with the [Trunk Analytics CLI](../../reference/cli-reference).
**Not using GitHub for source control?**
Flaky Test support for source control providers like GitLab and BitBucket is still experimental. If you're using a source control provider other than GitHub, [**contact us**](mailto:support@trunk.io) **to get started**.
Before you start on these steps, see the [Test Frameworks](../frameworks/) docs for instructions on producing a Trunk-compatible output for your test framework.
## Setup steps
Work through the steps below in order. Once you've finished the last one, you're set up — navigate to [app.trunk.io](https://app.trunk.io) to see your results.
Get your Trunk organization slug and token} />
Set your slug and token as a variable in CI} />
Configure your CI to upload to Trunk} />
Validate your uploads in Trunk} />
## Trunk Organization Slug and Token
Before setting up uploads to Trunk, you must sign in to [app.trunk.io](https://app.trunk.io/login?intent=flaky%20tests) and obtain your Trunk organization slug and token.
### Trunk Slug
You can find your organization slug under **Settings** → **Organization** → **General**. You'll save this as a variable in CI in a later step.
### Trunk Token
You can find your token under **Settings** → **Organization** → **General**, in the **API** section. Since this is a secret, do not leak it publicly. Ensure you get your *organization token*, not your project/repo token.
## Add the Trunk Token as a Secret
Store the Trunk slug and API token obtained in the previous step in your Semaphore CI Pipelines as new secrets named `TRUNK_ORG_URL_SLUG` and `TRUNK_API_TOKEN` respectively.
## Upload to Trunk
Add an upload step after running tests in each of your CI jobs that run tests. This should be minimally all jobs that run on pull requests, as well as from jobs that run on your main or [stable branches](../../detection/), for example, `main`, `master`, or `develop`.
It is important to upload test results from CI runs on [**stable branches**](../../detection/), such as `main`, `master`, or `develop`. This will give you a stronger signal about the health of your code and tests.
Trunk can also detect test flakes on PR and merge branches. To best detect flaky tests, it is recommended to upload test results from stable, PR, and merge branch CI runs.
[Learn more about detection](../../detection/)
### Example Semaphore CI Workflow
The following is an example of a Semaphore CI workflow step to upload test results after your tests run. Note: you must either run `trunk` from the repo root when uploading test results or pass a `--repo-root` argument.
To find out how to produce the report files the uploader needs, see the instructions for your test framework in the [Test Frameworks](/flaky-tests/get-started/frameworks) docs.
```yaml XML theme={null}
version: v1.0
name: Semaphore JavaScript Example Pipeline
blocks:
- name: Tests
task:
secrets:
- name: TRUNK_API_TOKEN
env_vars:
- name: NODE_ENV
value: test
- name: CI
value: "true"
prologue:
commands:
- checkout
- nvm use
- node --version
- npm --version
jobs:
- name: Run Tests
commands: ...
epilogue:
always:
commands:
# Upload results to trunk.io
- curl -fL --retry 3 "https://github.com/trunk-io/analytics-cli/releases/latest/download/trunk-analytics-cli-x86_64-unknown-linux.tar.gz" | tar -xz && chmod +x trunk-analytics-cli
- ./trunk-analytics-cli upload --junit-paths "" --org-url-slug --token ${TRUNK_API_TOKEN}
```
```yaml Bazel theme={null}
version: v1.0
name: Semaphore JavaScript Example Pipeline
blocks:
- name: Tests
task:
secrets:
- name: TRUNK_API_TOKEN
env_vars:
- name: NODE_ENV
value: test
- name: CI
value: "true"
prologue:
commands:
- checkout
- nvm use
- node --version
- npm --version
jobs:
- name: Run Tests
commands: ...
epilogue:
always:
commands:
# Upload results to trunk.io
- curl -fL --retry 3 "https://github.com/trunk-io/analytics-cli/releases/latest/download/trunk-analytics-cli-x86_64-unknown-linux.tar.gz" | tar -xz && chmod +x trunk-analytics-cli
- ./trunk-analytics-cli upload --bazel-bep-path --org-url-slug --token ${TRUNK_API_TOKEN}
```
```yaml XCode theme={null}
version: v1.0
name: Semaphore JavaScript Example Pipeline
blocks:
- name: Tests
task:
secrets:
- name: TRUNK_API_TOKEN
env_vars:
- name: NODE_ENV
value: test
- name: CI
value: "true"
prologue:
commands:
- checkout
- nvm use
- node --version
- npm --version
jobs:
- name: Run Tests
commands: ...
epilogue:
always:
commands:
# Upload results to trunk.io
- curl -fL --retry 3 "https://github.com/trunk-io/analytics-cli/releases/latest/download/trunk-analytics-cli-x86_64-unknown-linux.tar.gz" | tar -xz && chmod +x trunk-analytics-cli
- ./trunk-analytics-cli upload --xcresult-path --org-url-slug --token ${TRUNK_API_TOKEN}
```
```RSpec plugin theme={null}
version: v1.0
name: Semaphore JavaScript Example Pipeline
blocks:
- name: Tests
task:
secrets:
- name: TRUNK_API_TOKEN
- name: TRUNK_ORG_URL_SLUG
env_vars:
- name: NODE_ENV
value: test
- name: CI
value: "true"
prologue:
commands:
- checkout
- nvm use
- node --version
- npm --version
jobs:
- name: Run Tests
commands:
- TRUNK_ORG_URL_SLUG=${TRUNK_ORG_URL_SLUG} TRUNK_API_TOKEN=${TRUNK_API_TOKEN} bundle exec rspec
```
The examples above use the Linux x64 binary. If your CI runs on a different platform, see the [Trunk Analytics CLI](../../reference/cli-reference#manual-download) page for all available platform downloads.
See the [uploader.md](../../reference/cli-reference.md) for all available command line arguments and usage.
### Stale files
Ensure you report every test run in CI and **clean up stale files** produced by your test framework. If you're reusing test runners and using a glob like `**/junit.xml` to upload tests, stale files not cleaned up will be included in the current test run, throwing off detection of flakiness. You should clean up all your results files after every upload step.
## Validate Your Uploads
Once your pipeline has run on a stable branch, navigate to [app.trunk.io](https://app.trunk.io) and confirm Trunk received your results.
* The **Uploads** tab lists every report Trunk has ingested, with status and any warnings (missing file paths, malformed XML, and so on).
* The **Tests** tab shows individual test cases once an upload has been processed.
If a recent run isn't showing up, check your CI logs for upload errors and confirm your `TRUNK_API_TOKEN` and `TRUNK_ORG_URL_SLUG` secrets are set on the project running the pipeline.
# Travis CI
Source: https://docs.trunk.io/flaky-tests/get-started/ci-providers/travisci
Configure Flaky Tests using Travis CI
Trunk Flaky Tests integrates with your CI by adding a step in your Travis CI Pipelines to upload tests with the [Trunk Analytics CLI](../../reference/cli-reference).
**Not using GitHub for source control?**
Flaky Test support for source control providers like GitLab and BitBucket is still experimental. If you're using a source control provider other than GitHub, [**contact us**](mailto:support@trunk.io) **to get started**.
Before you start on these steps, see the [Test Frameworks](../frameworks/) docs for instructions on producing a Trunk-compatible output for your test framework.
## Setup steps
Work through the steps below in order. Once you've finished the last one, you're set up — navigate to [app.trunk.io](https://app.trunk.io) to see your results.
Get your Trunk organization slug and token} />
Set your slug and token as a variable in CI} />
Configure your CI to upload to Trunk} />
Validate your uploads in Trunk} />
## Trunk Organization Slug and Token
Before setting up uploads to Trunk, you must sign in to [app.trunk.io](https://app.trunk.io/login?intent=flaky%20tests) and obtain your Trunk organization slug and token.
### Trunk Slug
You can find your organization slug under **Settings** → **Organization** → **General**. You'll save this as a variable in CI in a later step.
### Trunk Token
You can find your token under **Settings** → **Organization** → **General**, in the **API** section. Since this is a secret, do not leak it publicly. Ensure you get your *organization token*, not your project/repo token.
## Add the Trunk Token as a Secret
Store the Trunk slug and API token obtained in the previous step as new secrets named `TRUNK_ORG_URL_SLUG` and `TRUNK_API_TOKEN` respectively.
## Upload to Trunk
Add a script step after running tests in each of your CI jobs that run tests. This should be run on pull requests, as well as from jobs that run on your main or [stable branches](../../detection/), for example, `main`, `master`, or `develop`.
It is important to upload test results from CI runs on [**stable branches**](../../detection/), such as `main`, `master`, or `develop`. This will give you a stronger signal about the health of your code and tests.
Trunk can also detect test flakes on PR and merge branches. To best detect flaky tests, it is recommended to upload test results from stable, PR, and merge branch CI runs.
[Learn more about detection](../../detection/)
### Example Travis CI Workflow
The following is an example of a Travis CI workflow step to upload test results after your tests run. Note: you must either run `trunk` from the repo root when uploading test results or pass a `--repo-root` argument.
To find out how to produce the report files the uploader needs, see the instructions for your test framework in the [Test Frameworks](/flaky-tests/get-started/frameworks) docs.
Note that TravisCI requires a recent version of Linux to use the current NodeJS runtimes. You may need to set the `dist` to `jammy` or later. See this [forum note](https://travis-ci.community/t/node-lib-x86-64-linux-gnu-libm-so-6-version-glibc-2-27-not-found-required-by-node/13655/2) for more details.
```yaml XML theme={null}
language: node_js
dist: jammy
node_js:
- 20
script:
- curl -fL --retry 3 "https://github.com/trunk-io/analytics-cli/releases/latest/download/trunk-analytics-cli-x86_64-unknown-linux.tar.gz" | tar -xz && chmod +x trunk-analytics-cli
- ./trunk-analytics-cli upload --junit-paths "" --org-url-slug --token $TRUNK_API_TOKEN
```
```yaml Bazel theme={null}
language: node_js
dist: jammy
node_js:
- 20
script:
- curl -fL --retry 3 "https://github.com/trunk-io/analytics-cli/releases/latest/download/trunk-analytics-cli-x86_64-unknown-linux.tar.gz" | tar -xz && chmod +x trunk-analytics-cli
- ./trunk-analytics-cli upload --bazel-bep-path --org-url-slug --token $TRUNK_API_TOKEN
```
```yaml XCode theme={null}
language: node_js
dist: jammy
node_js:
- 20
script:
- curl -fL --retry 3 "https://github.com/trunk-io/analytics-cli/releases/latest/download/trunk-analytics-cli-x86_64-unknown-linux.tar.gz" | tar -xz && chmod +x trunk-analytics-cli
- ./trunk-analytics-cli upload --xcresult-path --org-url-slug --token $TRUNK_API_TOKEN
```
```yaml RSpec plugin theme={null}
language: node_js
dist: jammy
node_js:
- 20
script:
- TRUNK_ORG_URL_SLUG=$TRUNK_ORG_URL_SLUG TRUNK_API_TOKEN=$TRUNK_API_TOKEN bundle exec rspec
```
The examples above use the Linux x64 binary. If your CI runs on a different platform, see the [Trunk Analytics CLI](../../reference/cli-reference#manual-download) page for all available platform downloads.
See the [uploader.md](../../reference/cli-reference.md) for all available command line arguments and usage.
### Stale files
Ensure you report every test run in CI and **clean up stale files** produced by your test framework. If you're reusing test runners and using a glob like `**/junit.xml` to upload tests, stale files not cleaned up will be included in the current test run, throwing off detection of flakiness. You should clean up all your results files after every upload step.
## Validate Your Uploads
Once your pipeline has run on a stable branch, navigate to [app.trunk.io](https://app.trunk.io) and confirm Trunk received your results.
* The **Uploads** tab lists every report Trunk has ingested, with status and any warnings (missing file paths, malformed XML, and so on).
* The **Tests** tab shows individual test cases once an upload has been processed.
If a recent run isn't showing up, check your CI logs for upload errors and confirm your `TRUNK_API_TOKEN` and `TRUNK_ORG_URL_SLUG` secrets are set on the project running the pipeline.
# Android
Source: https://docs.trunk.io/flaky-tests/get-started/frameworks/android
A guide for generating Trunk-compatible test reports for Android projects
You can automatically [detect and manage flaky tests](../../detection/) in your Android projects by integrating with Trunk. This document explains how to configure Android to output JUnit XML reports that can be uploaded to Trunk for analysis.
## Setup steps
Work through the steps below in order. Once you've finished the last one, you'll be ready to move on to [configure uploads in CI](../ci-providers/).
Generate a compatible test report} />
Configure the report file path or glob} />
Disable retries for better detection accuracy} />
Test uploads locally} />
## Generating reports
Android tests run with Gradle, typically using `./gradlew test` in CI. This will generate JUnit XML output by default, which you can further configure in your `build.gradle.kts` or `build.gradle`.
### Report file path
By default, Android projects will produce a directory with JUnit XML reports under `./app/build/test-results`.
You can customize the report output location in your `build.gradle.kts` or `build.gradle`, for example, writing the reports to `./app/junit-reports`.
```groovy Groovy theme={null}
android {
testOptions {
unitTests {
all {
reports {
junitXml {
outputLocation = file("./junit-reports")
}
}
}
}
}
}
```
```kotlin Kotlin theme={null}
android {
testOptions {
unitTests {
all {
reports {
junitXml.outputLocation.set(file("./junit-reports"))
}
}
}
}
}
```
When you configure your CI provider to upload reports in later steps, you will be uploading the reports using a glob such as `./junit-reports/*.xml`.
### Disable Retries
You need to disable automatic retries if you previously enabled them. Retries compromise the accurate detection of flaky tests. You should disable retries for accurate detection and use the [Quarantining](../../quarantining/) feature to stop flaky tests from failing your CI jobs.
If you've enabled retries using a plugin like the [test-retry-gradle-plugin](https://github.com/gradle/test-retry-gradle-plugin), disable it when running tests for Trunk Flaky Tests.
## Try It Locally
### The Validate Command
You can validate your test reports using the [Trunk Analytics CLI](../../reference/cli-reference). If you don't have it installed already, you can install and run the `validate` command like this:
```bash Linux (x64) theme={null}
SKU="trunk-analytics-cli-x86_64-unknown-linux.tar.gz"
curl -fL --retry 3 \
"https://github.com/trunk-io/analytics-cli/releases/latest/download/${SKU}" \
| tar -xz
chmod +x trunk-analytics-cli
./trunk-analytics-cli validate --junit-paths "./junit-reports/*.xml"
```
```bash Linux (arm64) theme={null}
SKU="trunk-analytics-cli-aarch64-unknown-linux.tar.gz"
curl -fL --retry 3 \
"https://github.com/trunk-io/analytics-cli/releases/latest/download/${SKU}" \
| tar -xz
chmod +x trunk-analytics-cli
./trunk-analytics-cli validate --junit-paths "./junit-reports/*.xml"
```
```bash macOS (arm64) theme={null}
SKU="trunk-analytics-cli-aarch64-apple-darwin.tar.gz"
curl -fL --retry 3 \
"https://github.com/trunk-io/analytics-cli/releases/latest/download/${SKU}" \
| tar -xz
chmod +x trunk-analytics-cli
./trunk-analytics-cli validate --junit-paths "./junit-reports/*.xml"
```
```bash macOS (x64) theme={null}
SKU="trunk-analytics-cli-x86_64-apple-darwin.tar.gz"
curl -fL --retry 3 \
"https://github.com/trunk-io/analytics-cli/releases/latest/download/${SKU}" \
| tar -xz
chmod +x trunk-analytics-cli
./trunk-analytics-cli validate --junit-paths "./junit-reports/*.xml"
```
**This will not upload anything to Trunk**. To improve detection accuracy, you should **address all errors and warnings** before proceeding to the next steps.
### Test Upload
Before modifying your CI jobs to automatically upload test results to Trunk, try uploading a single test run manually.
You make an upload to Trunk using the following command:
```sh theme={null}
./trunk-analytics-cli upload --junit-paths "./junit-reports/*.xml" \
--org-url-slug \
--token
```
## Next Steps
Configure your CI to upload test runs to Trunk. Find the guides for your CI framework below:
# Bazel
Source: https://docs.trunk.io/flaky-tests/get-started/frameworks/bazel
A guide for generating Trunk-compatible test reports with Bazel
You can automatically [detect and manage flaky tests](../../detection/) in your Bazel projects by integrating with Trunk. This document explains how to configure Bazel to output compatible reports that can be uploaded to Trunk for analysis.
## Setup steps
Work through the steps below in order. Once you've finished the last one, you'll be ready to move on to [configure uploads in CI](../ci-providers/).
Generate a compatible test report} />
Configure the report file path or glob} />
Test uploads locally} />
## Generating Reports
Trunk can parse JSON serialized [Build Event Protocol (BEP) ](https://bazel.build/remote/bep)files to detect flaky tests. You can run tests with Bazel in CI with the `--nobuild_event_json_file_path_conversion` option to produce a serialized BEP file.
### Report File Path
You can specify the path of the generated report through the `build_event_json_file` option:
```sh theme={null}
bazel test \
--nobuild_event_json_file_path_conversion \
--build_event_json_file=build_events.json
```
Trunk can parse the `build_events.json` file to locate your test reports. You will still need to **configure your test runners to output compatible reports**, and you can refer to the guides for [individual test frameworks](./).
Trunk accepts BEP files in both JSON and binary formats. Each output format has its own path-conversion flag, so pick the pair that matches the file you generate:
* JSON: `--build_event_json_file` with `--nobuild_event_json_file_path_conversion`
* Binary protobuf: `--build_event_binary_file` with `--nobuild_event_binary_file_path_conversion`
Pass whichever file you generated to the analytics CLI's `--bazel-bep-path`. The CLI detects the format automatically, so you don't need to tell it which one you used.
## Bazel flags
These Bazel flags affect whether Trunk receives complete test reports. Review them before configuring uploads.
### Build Without the Bytes
If your CI environment is set up to [build without the bytes](https://blog.bazel.build/2023/10/06/bwob-in-bazel-7.html), you will need the following flag to pull the reports from the remote execution engine:
```sh theme={null}
--remote_download_regex='.*/test.xml'
```
### Keep Going After Test Failures
Avoid setting `--test_keep_going=false` (or `--notest_keep_going`) if you intend to quarantine tests. Leave it at its default (`true`).
When `--test_keep_going` is `false`, Bazel stops at the first failing test, so later tests never run and never reach the BEP report. If that first failure is a quarantined test, Trunk sees only an already-quarantined failure and marks the run as passing. The tests that never ran might have failed, and the PR merges anyway.
## Try It Locally
### The Validate Command
```bash Linux (x64) theme={null}
SKU="trunk-analytics-cli-x86_64-unknown-linux.tar.gz"
curl -fL --retry 3 \
"https://github.com/trunk-io/analytics-cli/releases/latest/download/${SKU}" \
| tar -xz
chmod +x trunk-analytics-cli
./trunk-analytics-cli validate --bazel-bep-path=build_events.json
```
```bash Linux (arm64) theme={null}
SKU="trunk-analytics-cli-aarch64-unknown-linux.tar.gz"
curl -fL --retry 3 \
"https://github.com/trunk-io/analytics-cli/releases/latest/download/${SKU}" \
| tar -xz
chmod +x trunk-analytics-cli
./trunk-analytics-cli validate --bazel-bep-path=build_events.json
```
```bash macOS (arm64) theme={null}
SKU="trunk-analytics-cli-aarch64-apple-darwin.tar.gz"
curl -fL --retry 3 \
"https://github.com/trunk-io/analytics-cli/releases/latest/download/${SKU}" \
| tar -xz
chmod +x trunk-analytics-cli
./trunk-analytics-cli validate --bazel-bep-path=build_events.json
```
```bash macOS (x64) theme={null}
SKU="trunk-analytics-cli-x86_64-apple-darwin.tar.gz"
curl -fL --retry 3 \
"https://github.com/trunk-io/analytics-cli/releases/latest/download/${SKU}" \
| tar -xz
chmod +x trunk-analytics-cli
./trunk-analytics-cli validate --bazel-bep-path=build_events.json
```
### Test Upload
Before modifying your CI jobs to automatically upload test results to Trunk, try uploading a single test run manually.
You make an upload to Trunk using the following command:
```sh theme={null}
./trunk-analytics-cli upload --bazel-bep-path=build_events.json \
--org-url-slug \
--token
```
### Codeowners and Bazel Targets
If your test cases don't have file paths that can be matched against your CODEOWNERS file, you can pass `--use-bazel-target-for-codeowners` to fall back to the Bazel target name (e.g. `//path/to:target`) when associating test cases to owners:
```sh theme={null}
./trunk-analytics-cli upload --bazel-bep-path=build_events.json \
--org-url-slug \
--token \
--use-bazel-target-for-codeowners
```
When using the [Analytics Uploader GitHub Action](https://github.com/trunk-io/analytics-uploader), set the `use-bazel-target-for-codeowners: true` input alongside `bazel-bep-path`.
## Next Steps
Configure your CI to upload test runs to Trunk. Find the guides for your CI framework below:
# Behave
Source: https://docs.trunk.io/flaky-tests/get-started/frameworks/behave
A guide for generating Trunk-compatible test reports for Behave
You can automatically [detect and manage flaky tests](../../detection/) in your projects running Behave by integrating with Trunk. This document explains how to configure Behave to output JUnit XML reports that can be uploaded to Trunk for analysis.
## Setup steps
Work through the steps below in order. Once you've finished the last one, you'll be ready to move on to [configure uploads in CI](../ci-providers/).
Generate a compatible test report} />
Configure the report file path or glob} />
Disable retries for better detection accuracy} />
Test uploads locally} />
## Generating Reports
Trunk detects flaky tests by analyzing test results automatically uploaded from your CI jobs. Behave can output JUnit XML reports which are compatible with Trunk. You can do so with the `--junit` option:
```sh theme={null}
behave --junit
```
### Report File Path
You can customize the file path of the reports using the `--junit-directory` option.
```sh theme={null}
behave --junit --junit-directory ./junit-reports
```
Behave outputs multiple XML reports under the JUnit directory. You can locate these when uploading the reports in CI with the `"./junit-reports/*.xml"` glob.
### Disable Retries
You need to disable automatic retries if you previously enabled them. Retries compromise the accurate detection of flaky tests. You should disable retries for accurate detection and use the [Quarantining](../../quarantining/) feature to stop flaky tests from failing your CI jobs.
You must remove the [rerun formatter](https://behave.readthedocs.io/en/latest/formatters/#formatters) from your `behave.ini` file if it is being used to automatically rerun failed tests.
## Try It Locally
### The Validate Command
You can validate your test reports using the [Trunk Analytics CLI](../../reference/cli-reference). If you don't have it installed already, you can install and run the `validate` command like this:
```bash Linux (x64) theme={null}
SKU="trunk-analytics-cli-x86_64-unknown-linux.tar.gz"
curl -fL --retry 3 \
"https://github.com/trunk-io/analytics-cli/releases/latest/download/${SKU}" \
| tar -xz
chmod +x trunk-analytics-cli
./trunk-analytics-cli validate --junit-paths "./junit-reports/*.xml"
```
```bash Linux (arm64) theme={null}
SKU="trunk-analytics-cli-aarch64-unknown-linux.tar.gz"
curl -fL --retry 3 \
"https://github.com/trunk-io/analytics-cli/releases/latest/download/${SKU}" \
| tar -xz
chmod +x trunk-analytics-cli
./trunk-analytics-cli validate --junit-paths "./junit-reports/*.xml"
```
```bash macOS (arm64) theme={null}
SKU="trunk-analytics-cli-aarch64-apple-darwin.tar.gz"
curl -fL --retry 3 \
"https://github.com/trunk-io/analytics-cli/releases/latest/download/${SKU}" \
| tar -xz
chmod +x trunk-analytics-cli
./trunk-analytics-cli validate --junit-paths "./junit-reports/*.xml"
```
```bash macOS (x64) theme={null}
SKU="trunk-analytics-cli-x86_64-apple-darwin.tar.gz"
curl -fL --retry 3 \
"https://github.com/trunk-io/analytics-cli/releases/latest/download/${SKU}" \
| tar -xz
chmod +x trunk-analytics-cli
./trunk-analytics-cli validate --junit-paths "./junit-reports/*.xml"
```
**This will not upload anything to Trunk**. To improve detection accuracy, you should **address all errors and warnings** before proceeding to the next steps.
### Test Upload
Before modifying your CI jobs to automatically upload test results to Trunk, try uploading a single test run manually.
You make an upload to Trunk using the following command:
```sh theme={null}
./trunk-analytics-cli upload --junit-paths "./junit-reports/*.xml" \
--org-url-slug \
--token
```
You can find your Trunk organization slug and token in the settings or by following these [instructions](/flaky-tests/get-started/ci-providers/otherci#id-1.-store-a-trunk_token-secret-in-your-ci-system). After your upload, you can verify that Trunk has received and processed it successfully in the **Uploads** tab. Warnings will be displayed if the report has issues.
![]()
![]() ## Next Steps
Configure your CI to upload test runs to Trunk. Find the guides for your CI framework below:
## Next Steps
Configure your CI to upload test runs to Trunk. Find the guides for your CI framework below:
# Cypress
Source: https://docs.trunk.io/flaky-tests/get-started/frameworks/cypress
A guide for generating Trunk-compatible test reports for Cypress tests
You can automatically [detect and manage flaky tests](../../detection/) in your Cypress projects by integrating with Trunk. This document explains how to configure Cypress to output JUnit XML reports that can be uploaded to Trunk for analysis.
## Setup steps
Work through the steps below in order. Once you've finished the last one, you'll be ready to move on to [configure uploads in CI](../ci-providers/).
Generate a compatible test report} />
Configure the report file path or glob} />
Disable retries for better detection accuracy} />
Test uploads locally} />
## Generating Reports
Cypress has a built-in Mocha JUnit reporter which outputs XML test reports. However, the built-in reporter does not include file paths in test case elements, which means Trunk cannot match tests to code owners or enable file-based filtering in the dashboard.
### Recommended: Use cypress-junit-plugin for file paths
For full functionality including code owner detection and file-based search, use the [`cypress-junit-plugin`](https://github.com/saucelabs/cypress-junit-plugin) reporter. It outputs test cases with the correct nested structure and file path attributes that Trunk expects.
Install the plugin:
```bash theme={null}
npm install --save-dev @saucelabs/cypress-junit-plugin
```
Update your Cypress config:
```javascript title="cypress.config.js" theme={null}
const { defineConfig } = require('cypress')
const { setupJUnitPlugin } = require('@saucelabs/cypress-junit-plugin')
module.exports = defineConfig({
e2e: {
setupNodeEvents(on, config) {
setupJUnitPlugin(on, config, { filename: './junit.xml' })
return config
},
},
})
```
### Alternative: Built-in Mocha reporter
If you don't need file path matching or code owner detection, you can use the built-in reporter. Uploads will still work, but you will see warnings about missing file paths and won't be able to search by file in the dashboard.
```javascript title="cypress.config.js" theme={null}
const { defineConfig } = require('cypress')
module.exports = defineConfig({
reporter: 'junit',
reporterOptions: {
mochaFile: './junit.xml',
toConsole: true,
},
})
```
The built-in Mocha JUnit reporter places the `file` attribute on `` elements but not on individual `` elements. Trunk requires file paths on test cases for code owner matching. If you see warnings like "report has test cases with missing file or filepath", switch to the `cypress-junit-plugin` above.
### Report File Path
The JUnit report location is specified by the `filename` option passed to `setupJUnitPlugin` (or the `mochaFile` property when using the built-in reporter). In the above examples, the file will be at `./junit.xml`.
### Disable Retries
You need to disable automatic retries if you previously enabled them. Retries compromise the accurate detection of flaky tests.
You can disable retries by setting `retries: 0` in your Cypress config file.
```javascript title="cypress.config.js" theme={null}
module.exports = defineConfig({
retries: 0,
})
```
## Try It Locally
### The Validate Command
```bash Linux (x64) theme={null}
SKU="trunk-analytics-cli-x86_64-unknown-linux.tar.gz"
curl -fL --retry 3 \
"https://github.com/trunk-io/analytics-cli/releases/latest/download/${SKU}" \
| tar -xz
chmod +x trunk-analytics-cli
./trunk-analytics-cli validate --junit-paths "./junit.xml"
```
```bash Linux (arm64) theme={null}
SKU="trunk-analytics-cli-aarch64-unknown-linux.tar.gz"
curl -fL --retry 3 \
"https://github.com/trunk-io/analytics-cli/releases/latest/download/${SKU}" \
| tar -xz
chmod +x trunk-analytics-cli
./trunk-analytics-cli validate --junit-paths "./junit.xml"
```
```bash macOS (arm64) theme={null}
SKU="trunk-analytics-cli-aarch64-apple-darwin.tar.gz"
curl -fL --retry 3 \
"https://github.com/trunk-io/analytics-cli/releases/latest/download/${SKU}" \
| tar -xz
chmod +x trunk-analytics-cli
./trunk-analytics-cli validate --junit-paths "./junit.xml"
```
```bash macOS (x64) theme={null}
SKU="trunk-analytics-cli-x86_64-apple-darwin.tar.gz"
curl -fL --retry 3 \
"https://github.com/trunk-io/analytics-cli/releases/latest/download/${SKU}" \
| tar -xz
chmod +x trunk-analytics-cli
./trunk-analytics-cli validate --junit-paths "./junit.xml"
```
### Test Upload
Before modifying your CI jobs to automatically upload test results to Trunk, try uploading a single test run manually.
You make an upload to Trunk using the following command:
```sh theme={null}
./trunk-analytics-cli upload --junit-paths "./junit.xml" \
--org-url-slug \
--token
```
You can find your Trunk organization slug and token in the settings or by following these [instructions](/flaky-tests/get-started/ci-providers/otherci#id-1.-store-a-trunk_token-secret-in-your-ci-system). After your upload, you can verify that Trunk has received and processed it successfully in the **Uploads** tab. Warnings will be displayed if the report has issues.
![]()
![]() ## Next Step
Configure your CI to upload test runs to Trunk. Find the guides for your CI framework below:
## Next Step
Configure your CI to upload test runs to Trunk. Find the guides for your CI framework below:
# Dart Test
Source: https://docs.trunk.io/flaky-tests/get-started/frameworks/dart-test
A guide for generating Trunk-compatible test reports for Dart tests
You can automatically [detect and manage flaky tests](../../detection/) in your Dart projects by integrating with Trunk. This document explains how to configure Dart to output JUnit XML reports that can be uploaded to Trunk for analysis.
## Setup steps
Work through the steps below in order. Once you've finished the last one, you'll be ready to move on to [configure uploads in CI](../ci-providers/).
Generate a compatible test report} />
Configure the report file path or glob} />
Disable retries for better detection accuracy} />
Test uploads locally} />
## Generating Reports
Before you can upload to Trunk, you need to output a Trunk-compatible report. Dart supports JUnit outputs by using the `tojunit` library. You can install the `tojunit` library using the following command:
```sh theme={null}
dart pub global activate junitreport
```
Then, you can convert test reports to a JUnit format by piping it to `tojunit`and piping the output to a file like this:
```sh theme={null}
dart test --reporter json | tojunit > junit.xml
```
### Report File Path
The JUnit report is written to the location specified by the `tojunit >` pipe. In the example above, the test results will be written to `./junit.xml`.
### Disable Retries
You need to disable automatic retries if you previously enabled them. Retries compromise the accurate detection of flaky tests.
Dart provides retries through the [retry class annotations](https://pub.dev/documentation/test/latest/test/Retry-class.html). Disable retry, use Trunk to [detect](../../detection/)[ flaky tests](../../detection/), and use Quarantining to isolate flaky tests dynamically at run time.
## Try It Locally
### The Validate Command
```bash Linux (x64) theme={null}
SKU="trunk-analytics-cli-x86_64-unknown-linux.tar.gz"
curl -fL --retry 3 \
"https://github.com/trunk-io/analytics-cli/releases/latest/download/${SKU}" \
| tar -xz
chmod +x trunk-analytics-cli
./trunk-analytics-cli validate --junit-paths "./junit.xml"
```
```bash Linux (arm64) theme={null}
SKU="trunk-analytics-cli-aarch64-unknown-linux.tar.gz"
curl -fL --retry 3 \
"https://github.com/trunk-io/analytics-cli/releases/latest/download/${SKU}" \
| tar -xz
chmod +x trunk-analytics-cli
./trunk-analytics-cli validate --junit-paths "./junit.xml"
```
```bash macOS (arm64) theme={null}
SKU="trunk-analytics-cli-aarch64-apple-darwin.tar.gz"
curl -fL --retry 3 \
"https://github.com/trunk-io/analytics-cli/releases/latest/download/${SKU}" \
| tar -xz
chmod +x trunk-analytics-cli
./trunk-analytics-cli validate --junit-paths "./junit.xml"
```
```bash macOS (x64) theme={null}
SKU="trunk-analytics-cli-x86_64-apple-darwin.tar.gz"
curl -fL --retry 3 \
"https://github.com/trunk-io/analytics-cli/releases/latest/download/${SKU}" \
| tar -xz
chmod +x trunk-analytics-cli
./trunk-analytics-cli validate --junit-paths "./junit.xml"
```
### Test Upload
Before modifying your CI jobs to automatically upload test results to Trunk, try uploading a single test run manually.
You make an upload to Trunk using the following command:
```sh theme={null}
./trunk-analytics-cli upload --junit-paths "./junit.xml" \
--org-url-slug \
--token
```
## Next Steps
Configure your CI to upload test runs to Trunk. Find the guides for your CI framework below:
# GoogleTest
Source: https://docs.trunk.io/flaky-tests/get-started/frameworks/googletest
A guide for generating Trunk-compatible test reports for GoogleTest
You can automatically [detect and manage flaky tests](../../detection/) in your GoogleTest projects by integrating with Trunk. This document explains how to configure GoogleTest to output JUnit XML reports that can be uploaded to Trunk for analysis.
## Setup steps
Work through the steps below in order. Once you've finished the last one, you'll be ready to move on to [configure uploads in CI](../ci-providers/).
Generate a compatible test report} />
Configure the report file path or glob} />
Disable retries for better detection accuracy} />
Test uploads locally} />
## Generating Reports
Before you can integrate with Trunk, you need to generate a Trunk-compatible report. For GoogleTest, the built in XML reporter will work. You can use the [`--gtest_output=xml`](https://google.github.io/googletest/advanced.html#generating-an-xml-report) argument when you run your built test project:
```shell theme={null}
./build/run_test --gtest_output=xml
```
### Report File Path
By default, the JUnit report will be written to a `test_detail.xml` file.
You can specify a custom directory and filename with:
```bash theme={null}
--gtest_output=xml:
```
For example, the following argument writes a JUnit report to `./junit.xml`:
```bash theme={null}
--gtest_output=xml:junit.xml
```
### Disable Retries
You need to disable automatic retries if you previously enabled them. Retries compromise the accurate detection of flaky tests.
Omit the[ ](https://docs.pytest.org/en/stable/how-to/cache.html)[`--gtest_repeat`](https://google.github.io/googletest/advanced.html#repeating-the-tests) argument if you've previously configured your CI with these options to disable retries.
## Try It Locally
### The Validate Command
```bash Linux (x64) theme={null}
SKU="trunk-analytics-cli-x86_64-unknown-linux.tar.gz"
curl -fL --retry 3 \
"https://github.com/trunk-io/analytics-cli/releases/latest/download/${SKU}" \
| tar -xz
chmod +x trunk-analytics-cli
./trunk-analytics-cli validate --junit-paths "./junit.xml"
```
```bash Linux (arm64) theme={null}
SKU="trunk-analytics-cli-aarch64-unknown-linux.tar.gz"
curl -fL --retry 3 \
"https://github.com/trunk-io/analytics-cli/releases/latest/download/${SKU}" \
| tar -xz
chmod +x trunk-analytics-cli
./trunk-analytics-cli validate --junit-paths "./junit.xml"
```
```bash macOS (arm64) theme={null}
SKU="trunk-analytics-cli-aarch64-apple-darwin.tar.gz"
curl -fL --retry 3 \
"https://github.com/trunk-io/analytics-cli/releases/latest/download/${SKU}" \
| tar -xz
chmod +x trunk-analytics-cli
./trunk-analytics-cli validate --junit-paths "./junit.xml"
```
```bash macOS (x64) theme={null}
SKU="trunk-analytics-cli-x86_64-apple-darwin.tar.gz"
curl -fL --retry 3 \
"https://github.com/trunk-io/analytics-cli/releases/latest/download/${SKU}" \
| tar -xz
chmod +x trunk-analytics-cli
./trunk-analytics-cli validate --junit-paths "./junit.xml"
```
### Test Upload
Before modifying your CI jobs to automatically upload test results to Trunk, try uploading a single test run manually.
You make an upload to Trunk using the following command:
```sh theme={null}
./trunk-analytics-cli upload --junit-paths "./junit.xml" \
--org-url-slug \
--token
```
## Next Steps
Configure your CI to upload test runs to Trunk. Find the guides for your CI framework below:
# Go
Source: https://docs.trunk.io/flaky-tests/get-started/frameworks/gotestsum
A guide for generating Trunk-compatible test reports for Go tests
You can automatically [detect and manage flaky tests](../../detection/) in your Go projects by integrating with Trunk. This document explains how to configure Go to output JUnit XML reports that can be uploaded to Trunk for analysis.
## Why an Extra Step for `go test`?
The standard Go test runner, `go test`, is excellent for executing tests and providing immediate feedback to developers. However, it does not natively produce test reports in the JUnit XML format that Trunk Flaky Tests requires for ingestion and analysis. Therefore, an additional tool is needed to convert the output of `go test` into this compatible format. This intermediate step allows Trunk to accurately process your test results and identify flaky tests.
## Setup steps
Work through the steps below in order. Once you've finished the last one, you'll be ready to move on to [configure uploads in CI](../ci-providers/).
Generate a compatible test report (JUnit XML)} />
Configure the report file path or glob} />
Disable retries for better detection accuracy} />
Test uploads locally} />
## Generating JUnit XML Reports from Go Tests
Before integrating with Trunk, you need to generate a Trunk-compatible report. For Go, `go test` does not output JUnit XML by default, so you must use a tool to format it.
Update your existing `go test` usage to generate json and use [**go-junit-report**](https://github.com/jstemmer/go-junit-report) to convert your standard Go testing output into JUnit XML.
```
go install github.com/jstemmer/go-junit-report/v2@latest
```
Then pipe `go test` into the `go-junit-report`:
```
go test -json 2>&1 | go-junit-report -parser gojson -out junit_report.xml
```
Install gotestsum into your project:\
\
`go install gotest.tools/gotestsum@latest`\
\
Call `gotestsum` to both execute your tests and generate the junit.xml file
```
gotestsum [path-to-tests-to-run] --junitfile ./junit.xml
```
### Report File Path
The tools will write a JUnit test report to the file specified (e.g., `junit.xml` or `junit_report.xml`). You'll need this path when configuring uploads to Trunk.
If a subtest's top-level duration is reported as 0ms, timing-based analysis in the dashboard has less to work with for that case. See [Known limitations](../../dashboard#known-limitations) for the recommended workaround.
#### Disable Retries
Regardless of the tool chosen, you need to disable automatic retries if you previously enabled them. Retries compromise the accurate detection of flaky tests.\
\
If you're using a package like [**retry**](https://pkg.go.dev/github.com/hashicorp/consul/sdk/testutil/retry), disable it to get more accurate results from Trunk.
## Try It Locally
```bash Linux (x64) theme={null}
SKU="trunk-analytics-cli-x86_64-unknown-linux.tar.gz"
curl -fL --retry 3 \
"https://github.com/trunk-io/analytics-cli/releases/latest/download/${SKU}" \
| tar -xz
chmod +x trunk-analytics-cli
./trunk-analytics-cli validate --junit-paths "./junit.xml"
```
```bash Linux (arm64) theme={null}
SKU="trunk-analytics-cli-aarch64-unknown-linux.tar.gz"
curl -fL --retry 3 \
"https://github.com/trunk-io/analytics-cli/releases/latest/download/${SKU}" \
| tar -xz
chmod +x trunk-analytics-cli
./trunk-analytics-cli validate --junit-paths "./junit.xml"
```
```bash macOS (arm64) theme={null}
SKU="trunk-analytics-cli-aarch64-apple-darwin.tar.gz"
curl -fL --retry 3 \
"https://github.com/trunk-io/analytics-cli/releases/latest/download/${SKU}" \
| tar -xz
chmod +x trunk-analytics-cli
./trunk-analytics-cli validate --junit-paths "./junit.xml"
```
```bash macOS (x64) theme={null}
SKU="trunk-analytics-cli-x86_64-apple-darwin.tar.gz"
curl -fL --retry 3 \
"https://github.com/trunk-io/analytics-cli/releases/latest/download/${SKU}" \
| tar -xz
chmod +x trunk-analytics-cli
./trunk-analytics-cli validate --junit-paths "./junit.xml"
```
## Test Upload
Before modifying your CI jobs to automatically upload test results to Trunk, try uploading a single test run manually.
You make an upload to Trunk using the following command:
```sh theme={null}
./trunk-analytics-cli upload --junit-paths "./junit.xml" \
--org-url-slug \
--token
```
You can find your Trunk organization slug and token in the settings or by following these [instructions](/flaky-tests/get-started/ci-providers/otherci#id-1.-store-a-trunk_token-secret-in-your-ci-system). After your upload, you can verify that Trunk has received and processed it successfully in the **Uploads** tab. Warnings will be displayed if the report has issues.
![]()
![]() ## Next Steps
Configure your CI to upload test runs to Trunk. Find the guides for your CI framework below:
## Next Steps
Configure your CI to upload test runs to Trunk. Find the guides for your CI framework below:
# Gradle
Source: https://docs.trunk.io/flaky-tests/get-started/frameworks/gradle
A guide for generating Trunk-compatible test reports for Gradle
You can automatically [detect and manage flaky tests](../../detection/) in your Gradle projects by integrating with Trunk. This document explains how to configure Gradle to output JUnit XML reports that can be uploaded to Trunk for analysis.
## Setup steps
Work through the steps below in order. Once you've finished the last one, you'll be ready to move on to [configure uploads in CI](../ci-providers/).
Generate a compatible test report} />
Configure the report file path or glob} />
Disable retries for better detection accuracy} />
Test uploads locally} />
## Generating Reports
Tests run with Gradle will generate JUnit XML reports by default and are compatible with Trunk. You can further [configure reporting behavior](https://docs.gradle.org/8.10.2/userguide/java_testing.html#test_reporting) in your `build.gradle.kts` or `build.gradle`.
### Report File Path
By default, Android projects will produce a directory with JUnit XML reports under `./app/build/test-results/test`. You can locate these files with the glob `"./app/build/test-results/test/*.xml"`.
If you wish to override the default test result path, you can do so in the `build.gradle.kts` or `build.gradle` files:
```groovy title="build.gradle" theme={null}
java.testResultsDir = layout.buildDirectory.dir("junit-reports")
```
```kotlin title="build.gradle.kts" theme={null}
java.testResultsDir = layout.buildDirectory.dir("junit-reports")
```
This example will write report files to `"./app/build/junit-reports/test/*.xml"`
The `validate` and `upload` commands below use the default path. If you apply this override, point `--junit-paths` at `./app/build/junit-reports/test/*.xml` instead.
### Disable Retries
You need to disable automatic retries if you previously enabled them. Retries compromise the accurate detection of flaky tests. You should disable retries for accurate detection and use the [Quarantining](../../quarantining/) feature to stop flaky tests from failing your CI jobs.
If you've enabled retries using a plugin like the [test-retry-gradle-plugin](https://github.com/gradle/test-retry-gradle-plugin), disable it when running tests for Trunk Flaky Tests.
## Try It Locally
### The Validate Command
You can validate your test reports using the [Trunk Analytics CLI](../../reference/cli-reference). If you don't have it installed already, you can install and run the `validate` command like this:
```bash Linux (x64) theme={null}
SKU="trunk-analytics-cli-x86_64-unknown-linux.tar.gz"
curl -fL --retry 3 \
"https://github.com/trunk-io/analytics-cli/releases/latest/download/${SKU}" \
| tar -xz
chmod +x trunk-analytics-cli
./trunk-analytics-cli validate --junit-paths "./app/build/test-results/test/*.xml"
```
```bash Linux (arm64) theme={null}
SKU="trunk-analytics-cli-aarch64-unknown-linux.tar.gz"
curl -fL --retry 3 \
"https://github.com/trunk-io/analytics-cli/releases/latest/download/${SKU}" \
| tar -xz
chmod +x trunk-analytics-cli
./trunk-analytics-cli validate --junit-paths "./app/build/test-results/test/*.xml"
```
```bash macOS (arm64) theme={null}
SKU="trunk-analytics-cli-aarch64-apple-darwin.tar.gz"
curl -fL --retry 3 \
"https://github.com/trunk-io/analytics-cli/releases/latest/download/${SKU}" \
| tar -xz
chmod +x trunk-analytics-cli
./trunk-analytics-cli validate --junit-paths "./app/build/test-results/test/*.xml"
```
```bash macOS (x64) theme={null}
SKU="trunk-analytics-cli-x86_64-apple-darwin.tar.gz"
curl -fL --retry 3 \
"https://github.com/trunk-io/analytics-cli/releases/latest/download/${SKU}" \
| tar -xz
chmod +x trunk-analytics-cli
./trunk-analytics-cli validate --junit-paths "./app/build/test-results/test/*.xml"
```
**This will not upload anything to Trunk**. To improve detection accuracy, you should **address all errors and warnings** before proceeding to the next steps.
### Test Upload
Before modifying your CI jobs to automatically upload test results to Trunk, try uploading a single test run manually.
You make an upload to Trunk using the following command:
```sh theme={null}
./trunk-analytics-cli upload --junit-paths "./app/build/test-results/test/*.xml" \
--org-url-slug \
--token
```
You can find your Trunk organization slug and token in the settings or by following these [instructions](/flaky-tests/get-started/ci-providers/otherci#id-1.-store-a-trunk_token-secret-in-your-ci-system). After your upload, you can verify that Trunk has received and processed it successfully in the **Uploads** tab. Warnings will be displayed if the report has issues.
![]()
![]() ## Next Steps
Configure your CI to upload test runs to Trunk. Find the guides for your CI framework below:
## Next Steps
Configure your CI to upload test runs to Trunk. Find the guides for your CI framework below:
# Test frameworks
Source: https://docs.trunk.io/flaky-tests/get-started/frameworks/index
Guides for generating Trunk-compatible test results from various test frameworks
Trunk Flaky Tests uses test results uploaded from your CI jobs to detect flaky tests.
Follow one of the guides below to configure your test framework to output compatible test reports and integrate with Trunk.
# Jasmine
Source: https://docs.trunk.io/flaky-tests/get-started/frameworks/jasmine
A guide for generating Trunk-compatible test reports for Jasmine tests
You can automatically [detect and manage flaky tests](../../detection/) in your Jasmine projects by integrating with Trunk. This document explains how to configure Jasmine to output JUnit XML reports that can be uploaded to Trunk for analysis.
## Setup steps
Work through the steps below in order. Once you've finished the last one, you'll be ready to move on to [configure uploads in CI](../ci-providers/).
Generate a compatible test report} />
Configure the report file path or glob} />
Disable retries for better detection accuracy} />
Test uploads locally} />
## Generating Reports
Before integrating with Trunk, you need to generate Trunk-compatible reports. For Jasmine, the easiest approach is to generate XML reports.
First, install the [`jasmine-reporters`](https://www.npmjs.com/package/jasmine-reporters) package:
```shell theme={null}
npm install --save-dev jasmine-reporters
```
### In-Browser tests
When used for in-browser tests, the reporters are registered on a `jasmineReporters` object in the global scope (i.e. `window.jasmineReporters`). You can register it like this in your Jasmine config under `/spec/support/jasmine.mjs`:
```javascript title="/spec/support/jasmine.mjs" theme={null}
import jasmineReporters from 'jasmine-reporters';
var junitReporter = new jasmineReporters.JUnitXmlReporter({
savePath: "test-reports",
consolidateAll: false
});
jasmine.getEnv().addReporter(junitReporter);
```
### NodeJS
In Node.js, `jasmine-reporters` exports an object with all the reporters. You can register it like this in your Jasmine config under `/spec/support/jasmine.mjs`:
```javascript theme={null}
var reporters = require('jasmine-reporters');
var junitReporter = new reporters.JUnitXmlReporter({
savePath: "test-reports",
consolidateAll: false
});
jasmine.getEnv().addReporter(junitReporter)
```
### Report File Path
Jasmine will generate an XML report at the location specified by the `savePath` property. In the examples above, the XML report can be located with the glob `test-reports/*.xml`.
### Disable Retries
You need to disable automatic retries if you previously enabled them. Retries compromise the accurate detection of flaky tests.
If you're using a package like [protractor-flake](https://www.npmjs.com/package/protractor-flake), disable it to get more accurate results from Trunk. Instead, you can mitigate flaky tests using the [Quarantining](../../quarantining/) feature in Trunk.
## Try It Locally
### The Validate Command
You can validate your test reports using the [Trunk Analytics CLI](../../reference/cli-reference). If you don't have it installed already, you can install and run the `validate` command like this:
```bash Linux (x64) theme={null}
SKU="trunk-analytics-cli-x86_64-unknown-linux.tar.gz"
curl -fL --retry 3 \
"https://github.com/trunk-io/analytics-cli/releases/latest/download/${SKU}" \
| tar -xz
chmod +x trunk-analytics-cli
./trunk-analytics-cli validate --junit-paths "./test-reports/*.xml"
```
```bash Linux (arm64) theme={null}
SKU="trunk-analytics-cli-aarch64-unknown-linux.tar.gz"
curl -fL --retry 3 \
"https://github.com/trunk-io/analytics-cli/releases/latest/download/${SKU}" \
| tar -xz
chmod +x trunk-analytics-cli
./trunk-analytics-cli validate --junit-paths "./test-reports/*.xml"
```
```bash macOS (arm64) theme={null}
SKU="trunk-analytics-cli-aarch64-apple-darwin.tar.gz"
curl -fL --retry 3 \
"https://github.com/trunk-io/analytics-cli/releases/latest/download/${SKU}" \
| tar -xz
chmod +x trunk-analytics-cli
./trunk-analytics-cli validate --junit-paths "./test-reports/*.xml"
```
```bash macOS (x64) theme={null}
SKU="trunk-analytics-cli-x86_64-apple-darwin.tar.gz"
curl -fL --retry 3 \
"https://github.com/trunk-io/analytics-cli/releases/latest/download/${SKU}" \
| tar -xz
chmod +x trunk-analytics-cli
./trunk-analytics-cli validate --junit-paths "./test-reports/*.xml"
```
**This will not upload anything to Trunk**. To improve detection accuracy, you should **address all errors and warnings** before proceeding to the next steps.
### Test Upload
Before modifying your CI jobs to automatically upload test results to Trunk, try uploading a single test run manually.
You make an upload to Trunk using the following command:
```sh theme={null}
./trunk-analytics-cli upload --junit-paths "./test-reports/*.xml" \
--org-url-slug \
--token
```
You can find your Trunk organization slug and token in the settings or by following these [instructions](/flaky-tests/get-started/ci-providers/otherci#id-1.-store-a-trunk_token-secret-in-your-ci-system). After your upload, you can verify that Trunk has received and processed it successfully in the **Uploads** tab. Warnings will be displayed if the report has issues.
![]()
![]() ## Next Steps
Configure your CI to upload test runs to Trunk. Find the guides for your CI framework below:
## Next Steps
Configure your CI to upload test runs to Trunk. Find the guides for your CI framework below:
# Jest
Source: https://docs.trunk.io/flaky-tests/get-started/frameworks/jest
A guide for generating Trunk-compatible test reports for Jest tests
You can automatically [detect and manage flaky tests](../../detection/) in your Jest projects by integrating with Trunk. This document explains how to configure Jest to output JUnit XML reports that can be uploaded to Trunk for analysis.
## Setup steps
Work through the steps below in order. Once you've finished the last one, you'll be ready to move on to [configure uploads in CI](../ci-providers/).
Generate a compatible test report} />
Configure the report file path or glob} />
Disable retries for better detection accuracy} />
Test uploads locally} />
## Generating Reports
Trunk detects flaky tests by analyzing test results automatically uploaded from your CI jobs. You can do this by generating XML reports from your test runs.
To generate a Trunk-compatible XML report, install the `jest-junit` package:
```bash theme={null}
npm install --save-dev jest-junit
```
Update your Jest config to add `jest-junit` as a reporter:
```json title="jest.config.json" theme={null}
{
"reporters": [
[
"jest-junit",
{
"outputDirectory": "./",
"outputName": "junit.xml",
"addFileAttribute": "true",
"reportTestSuiteErrors": "true"
}
]
]
}
```
### Report File Path
The `outputDirectory` and `outputName` options specify the path of the XML report. You'll need this path later when configuring automatic uploads to Trunk.
### Using `filePathPrefix`
In a monorepo with `pnpm` workspaces (or similar), Jest runs from within the package directory, so the file paths it records in the XML report are relative to that package — not to the repository root. For example, a test at `packages/my-package/src/__tests__/foo.test.js` would be recorded as `src/__tests__/foo.test.js`.
This causes codeowners matching to fail because Trunk compares test file paths against the codeowners file at the repo root, which uses full repo-relative paths.
To fix this, set the `filePathPrefix` option to the path of the package within the repo:
```json title="jest.config.json" theme={null}
{
"reporters": [
[
"jest-junit",
{
"outputDirectory": "./",
"outputName": "junit.xml",
"addFileAttribute": "true",
"reportTestSuiteErrors": "true",
"filePathPrefix": "packages/my-package"
}
]
]
}
```
With `filePathPrefix` set, `jest-junit` will prepend the given path to every file path in the XML output, producing repo-root-relative paths that Trunk can correctly match against your codeowners file.
### Disable Retries
You need to disable automatic retries if you previously enabled them. Retries compromise the accurate detection of flaky tests. You should disable retries for accurate detection and use the [Quarantining](../../quarantining/) feature to stop flaky tests from failing your CI jobs.
If you have retries configured using the [jest.retryTimes method](https://jestjs.io/docs/jest-object#jestretrytimesnumretries-options), disable them for more accurate results.
## Try It Locally
### The Validate Command
```bash Linux (x64) theme={null}
SKU="trunk-analytics-cli-x86_64-unknown-linux.tar.gz"
curl -fL --retry 3 \
"https://github.com/trunk-io/analytics-cli/releases/latest/download/${SKU}" \
| tar -xz
chmod +x trunk-analytics-cli
./trunk-analytics-cli validate --junit-paths "./junit.xml"
```
```bash Linux (arm64) theme={null}
SKU="trunk-analytics-cli-aarch64-unknown-linux.tar.gz"
curl -fL --retry 3 \
"https://github.com/trunk-io/analytics-cli/releases/latest/download/${SKU}" \
| tar -xz
chmod +x trunk-analytics-cli
./trunk-analytics-cli validate --junit-paths "./junit.xml"
```
```bash macOS (arm64) theme={null}
SKU="trunk-analytics-cli-aarch64-apple-darwin.tar.gz"
curl -fL --retry 3 \
"https://github.com/trunk-io/analytics-cli/releases/latest/download/${SKU}" \
| tar -xz
chmod +x trunk-analytics-cli
./trunk-analytics-cli validate --junit-paths "./junit.xml"
```
```bash macOS (x64) theme={null}
SKU="trunk-analytics-cli-x86_64-apple-darwin.tar.gz"
curl -fL --retry 3 \
"https://github.com/trunk-io/analytics-cli/releases/latest/download/${SKU}" \
| tar -xz
chmod +x trunk-analytics-cli
./trunk-analytics-cli validate --junit-paths "./junit.xml"
```
### Test Upload
Before modifying your CI jobs to automatically upload test results to Trunk, try uploading a single test run manually.
You make an upload to Trunk using the following command:
```sh theme={null}
./trunk-analytics-cli upload --junit-paths "./junit.xml" \
--org-url-slug \
--token
```
You can find your Trunk organization slug and token in the settings or by following these [instructions](/flaky-tests/get-started/ci-providers/otherci#id-1.-store-a-trunk_token-secret-in-your-ci-system). After your upload, you can verify that Trunk has received and processed it successfully in the **Uploads** tab. Warnings will be displayed if the report has issues.
![]()
![]() ## Next Steps
Configure your CI to upload test runs to Trunk. Find the guides for your CI framework below:
## Next Steps
Configure your CI to upload test runs to Trunk. Find the guides for your CI framework below:
# Karma
Source: https://docs.trunk.io/flaky-tests/get-started/frameworks/karma
A guide for generating Trunk-compatible test reports for Karma tests
You can automatically [detect and manage flaky tests](../../detection/) in your Karma projects by integrating with Trunk. This document explains how to configure Karma to output JUnit XML reports that can be uploaded to Trunk for analysis.
## Setup steps
Work through the steps below in order. Once you've finished the last one, you'll be ready to move on to [configure uploads in CI](../ci-providers/).
Generate a compatible test report} />
Configure the report file path or glob} />
Disable retries for better detection accuracy} />
Test uploads locally} />
## Generating Reports
Trunk detects flaky tests by analyzing test results automatically uploaded from your CI jobs. You can do this by generating XML reports from your test runs.
To generate a Trunk-compatible XML report, install the `karma-junit-reporter` package:
```shell theme={null}
npm install --save-dev karma-junit-reporter
```
Add the `junit` reporter to your karma config file:
```javascript title="karma.conf.js" theme={null}
module.exports = function(config) {
config.set(
{
reporters: ['junit'],
junitReporter: {
outputDir: 'test-reports',
}
}
)
}
```
### Report File Path
The `outputDir` specifies the location of the JUnit test report. In the example above, the JUnit would be at `./test-reports/{$browserName}.xml`. You can locate the reports during uploads with the glob `./test-reports/*.xml`.
### Disable Retries
You need to disable automatic retries if you previously enabled them. Retries compromise the accurate detection of flaky tests.
Karma doesn't support retries out of the box, but if you implemented retries, remember to disable them.
## Try It Locally
### The Validate Command
You can validate your test reports using the [Trunk Analytics CLI](../../reference/cli-reference). If you don't have it installed already, you can install and run the `validate` command like this:
```bash Linux (x64) theme={null}
SKU="trunk-analytics-cli-x86_64-unknown-linux.tar.gz"
curl -fL --retry 3 \
"https://github.com/trunk-io/analytics-cli/releases/latest/download/${SKU}" \
| tar -xz
chmod +x trunk-analytics-cli
./trunk-analytics-cli validate --junit-paths "./test-reports/*.xml"
```
```bash Linux (arm64) theme={null}
SKU="trunk-analytics-cli-aarch64-unknown-linux.tar.gz"
curl -fL --retry 3 \
"https://github.com/trunk-io/analytics-cli/releases/latest/download/${SKU}" \
| tar -xz
chmod +x trunk-analytics-cli
./trunk-analytics-cli validate --junit-paths "./test-reports/*.xml"
```
```bash macOS (arm64) theme={null}
SKU="trunk-analytics-cli-aarch64-apple-darwin.tar.gz"
curl -fL --retry 3 \
"https://github.com/trunk-io/analytics-cli/releases/latest/download/${SKU}" \
| tar -xz
chmod +x trunk-analytics-cli
./trunk-analytics-cli validate --junit-paths "./test-reports/*.xml"
```
```bash macOS (x64) theme={null}
SKU="trunk-analytics-cli-x86_64-apple-darwin.tar.gz"
curl -fL --retry 3 \
"https://github.com/trunk-io/analytics-cli/releases/latest/download/${SKU}" \
| tar -xz
chmod +x trunk-analytics-cli
./trunk-analytics-cli validate --junit-paths "./test-reports/*.xml"
```
**This will not upload anything to Trunk**. To improve detection accuracy, you should **address all errors and warnings** before proceeding to the next steps.
### Test Upload
Before modifying your CI jobs to automatically upload test results to Trunk, try uploading a single test run manually.
You make an upload to Trunk using the following command:
```sh theme={null}
./trunk-analytics-cli upload --junit-paths "./test-reports/*.xml" \
--org-url-slug \
--token
```
You can find your Trunk organization slug and token in the settings or by following these [instructions](/flaky-tests/get-started/ci-providers/otherci#id-1.-store-a-trunk_token-secret-in-your-ci-system). After your upload, you can verify that Trunk has received and processed it successfully in the **Uploads** tab. Warnings will be displayed if the report has issues.
![]()
![]() ## Next Steps
Configure your CI to upload test runs to Trunk. Find the guides for your CI framework below:
## Next Steps
Configure your CI to upload test runs to Trunk. Find the guides for your CI framework below:
# Kotest
Source: https://docs.trunk.io/flaky-tests/get-started/frameworks/kotest
A guide for generating Trunk-compatible test reports for Kotest
You can automatically [detect and manage flaky tests](../../detection/) in your Kotest projects by integrating with Trunk. This document explains how to configure Kotest to output JUnit XML reports that can be uploaded to Trunk for analysis.
## Setup steps
Work through the steps below in order. Once you've finished the last one, you'll be ready to move on to [configure uploads in CI](../ci-providers/).
Generate a compatible test report} />
Configure the report file path or glob} />
Disable retries for better detection accuracy} />
Test uploads locally} />
## Generating Reports
Steps for generating JUnit XML reports for Kotest depend on the build system you use for your project:
Tests run with Gradle will generate Trunk-compatible JUnit XML reports by default. You can further [configure reporting behavior](https://docs.gradle.org/8.10.2/userguide/java_testing.html#test_reporting) in your `build.gradle.kts` or `build.gradle`.
Kotest projects using Maven require the following to be added to a project's `pom.xml` so JUnit XML reports can be generated:
* the `maven-surefire-plugin` must be added to the `plugins` section of `pom.xml`
```xml title="pom.xml" theme={null}
org.apache.maven.plugins
maven-surefire-plugin
3.2.2
```
* the `kotest-extensions-junitxml` must be added to the `dependencies` section of `pom.xml`
```xml title="pom.xml" theme={null}
io.kotest
kotest-extensions-junitxml-jvm
5.9.0
test
```
### Report File Path
You can configure the path for generated JUnit XML files:
By default, Kotlin projects will produce a directory with JUnit XML reports under `./app/build/test-results/test`. You can locate these files with the glob `"./app/build/test-results/test/*.xml"`.
If you wish to override the default test result path, you can do so in the `build.gradle.kts` or `build.gradle` files:
```kotlin title="build.gradle.kts (Kotlin) or build.gradle (Groovy)" theme={null}
java.testResultsDir = layout.buildDirectory.dir("junit-reports")
```
You can change the report file path by configuring the `reportsDirectory` in your `maven-surefire-plugin` in your `pom.xml` file:
```xml title="pom.xml" theme={null}
org.apache.maven.plugins
maven-surefire-plugin
3.2.2
${project.build.directory}/junit/
```
The example above will output JUnit XML reports that can be located with the `/target/junit/*.xml` glob.
### Disable Retries
You need to disable automatic retries if you previously enabled them. Retries compromise the accurate detection of flaky tests. You should disable retries for accurate detection and use the [Quarantining](../../quarantining/) feature to stop flaky tests from failing your CI jobs.
If you've enabled retries using a plugin like the [test-retry-gradle-plugin](https://github.com/gradle/test-retry-gradle-plugin), disable it when running tests for Trunk Flaky Tests.
Maven uses the `maven-surefire-plugin` to run tests, which allows you to control the test retry behavior. You can disable retries by specifying 0 retries:
```
mvn -Dsurefire.rerunFailingTestsCount=0 test
```
## Try It Locally
### The Validate Command
You can validate your test reports using the [Trunk Analytics CLI](../../reference/cli-reference). If you don't have it installed already, you can install and run the `validate` command like this:
The `validate` and `upload` examples below use the **Gradle default** output path. Point `--junit-paths` at the glob that matches your build:
* **Gradle** (default): `./app/build/test-results/test/*.xml`
* **Gradle** with the `testResultsDir` override shown above: `./app/build/junit-reports/test/*.xml`
* **Maven**: `./target/junit/*.xml`
```bash Linux (x64) theme={null}
SKU="trunk-analytics-cli-x86_64-unknown-linux.tar.gz"
curl -fL --retry 3 \
"https://github.com/trunk-io/analytics-cli/releases/latest/download/${SKU}" \
| tar -xz
chmod +x trunk-analytics-cli
./trunk-analytics-cli validate --junit-paths "./app/build/test-results/test/*.xml"
```
```bash Linux (arm64) theme={null}
SKU="trunk-analytics-cli-aarch64-unknown-linux.tar.gz"
curl -fL --retry 3 \
"https://github.com/trunk-io/analytics-cli/releases/latest/download/${SKU}" \
| tar -xz
chmod +x trunk-analytics-cli
./trunk-analytics-cli validate --junit-paths "./app/build/test-results/test/*.xml"
```
```bash macOS (arm64) theme={null}
SKU="trunk-analytics-cli-aarch64-apple-darwin.tar.gz"
curl -fL --retry 3 \
"https://github.com/trunk-io/analytics-cli/releases/latest/download/${SKU}" \
| tar -xz
chmod +x trunk-analytics-cli
./trunk-analytics-cli validate --junit-paths "./app/build/test-results/test/*.xml"
```
```bash macOS (x64) theme={null}
SKU="trunk-analytics-cli-x86_64-apple-darwin.tar.gz"
curl -fL --retry 3 \
"https://github.com/trunk-io/analytics-cli/releases/latest/download/${SKU}" \
| tar -xz
chmod +x trunk-analytics-cli
./trunk-analytics-cli validate --junit-paths "./app/build/test-results/test/*.xml"
```
Make sure to specify the path to your JUnit XML test reports.
**This will not upload anything to Trunk**. To improve detection accuracy, you should **address all errors and warnings** before proceeding to the next steps.
### Test Upload
Before modifying your CI jobs to automatically upload test results to Trunk, try uploading a single test run manually.
You make an upload to Trunk using the following command:
```sh theme={null}
./trunk-analytics-cli upload --junit-paths "./app/build/test-results/test/*.xml" \
--org-url-slug \
--token
```
You can find your Trunk organization slug and token in the settings or by following these [instructions](/flaky-tests/get-started/ci-providers/otherci#id-1.-store-a-trunk_token-secret-in-your-ci-system). After your upload, you can verify that Trunk has received and processed it successfully in the **Uploads** tab. Warnings will be displayed if the report has issues.
![]()
![]() ## Next Steps
Configure your CI to upload test runs to Trunk. Find the guides for your CI framework below:
## Next Steps
Configure your CI to upload test runs to Trunk. Find the guides for your CI framework below:
# Maven
Source: https://docs.trunk.io/flaky-tests/get-started/frameworks/maven
A guide for generating Trunk-compatible test reports for Maven
You can automatically [detect and manage flaky tests](../../detection/) in your Maven projects by integrating with Trunk. This document explains how to configure Maven to output JUnit XML reports that can be uploaded to Trunk for analysis.
## Setup steps
Work through the steps below in order. Once you've finished the last one, you'll be ready to move on to [configure uploads in CI](../ci-providers/).
Generate a compatible test report} />
Configure the report file path or glob} />
Disable retries for better detection accuracy} />
Test uploads locally} />
## Generating Reports
Maven uses the `maven-surefire-plugin` by default to output JUnit XML reports, which is Trunk compatible. You can configure the plugin in your project's `pom.xml`.
### Report File Path
You can change the report file path by configuring the `maven-surefire-plugin` plugin in your `pom.xml` file:
```xml title="pom.xml" theme={null}
org.apache.maven.plugins
maven-surefire-plugin
3.2.2
${project.build.directory}/junit/
```
The example above will output JUnit XML reports that can be located with the `./target/junit/*.xml` glob.
### Using Kotlin and Kotest
If you have a Kotlin project and are using the Kotest test framework, you also need to include `kotest-extensions-junitxml` in your project's `pom.xml`. This allows Kotest to generate JUnit XML reports.
```xml title="pom.xml" theme={null}
io.kotest
kotest-extensions-junitxml-jvm
5.9.0
test
```
### Disable Retries
You need to disable automatic retries if you previously enabled them. Retries compromise the accurate detection of flaky tests. You should disable retries for accurate detection and use the [Quarantining](../../quarantining/) feature to stop flaky tests from failing your CI jobs.
Maven uses the `maven-surefire-plugin` to run tests, which allows you to control the test retry behavior. You can disable retries by specifying 0 retries:
```
mvn -Dsurefire.rerunFailingTestsCount=0 test
```
## Try It Locally
### The Validate Command
You can validate your test reports using the [Trunk Analytics CLI](../../reference/cli-reference). If you don't have it installed already, you can install and run the `validate` command like this:
```bash Linux (x64) theme={null}
SKU="trunk-analytics-cli-x86_64-unknown-linux.tar.gz"
curl -fL --retry 3 \
"https://github.com/trunk-io/analytics-cli/releases/latest/download/${SKU}" \
| tar -xz
chmod +x trunk-analytics-cli
./trunk-analytics-cli validate --junit-paths "./target/junit/*.xml"
```
```bash Linux (arm64) theme={null}
SKU="trunk-analytics-cli-aarch64-unknown-linux.tar.gz"
curl -fL --retry 3 \
"https://github.com/trunk-io/analytics-cli/releases/latest/download/${SKU}" \
| tar -xz
chmod +x trunk-analytics-cli
./trunk-analytics-cli validate --junit-paths "./target/junit/*.xml"
```
```bash macOS (arm64) theme={null}
SKU="trunk-analytics-cli-aarch64-apple-darwin.tar.gz"
curl -fL --retry 3 \
"https://github.com/trunk-io/analytics-cli/releases/latest/download/${SKU}" \
| tar -xz
chmod +x trunk-analytics-cli
./trunk-analytics-cli validate --junit-paths "./target/junit/*.xml"
```
```bash macOS (x64) theme={null}
SKU="trunk-analytics-cli-x86_64-apple-darwin.tar.gz"
curl -fL --retry 3 \
"https://github.com/trunk-io/analytics-cli/releases/latest/download/${SKU}" \
| tar -xz
chmod +x trunk-analytics-cli
./trunk-analytics-cli validate --junit-paths "./target/junit/*.xml"
```
**This will not upload anything to Trunk**. To improve detection accuracy, you should **address all errors and warnings** before proceeding to the next steps.
### Test Upload
Before modifying your CI jobs to automatically upload test results to Trunk, try uploading a single test run manually.
You make an upload to Trunk using the following command:
```sh theme={null}
./trunk-analytics-cli upload --junit-paths "./target/junit/*.xml" \
--org-url-slug \
--token
```
You can find your Trunk organization slug and token in the settings or by following these [instructions](/flaky-tests/get-started/ci-providers/otherci#id-1.-store-a-trunk_token-secret-in-your-ci-system). After your upload, you can verify that Trunk has received and processed it successfully in the **Uploads** tab. Warnings will be displayed if the report has issues.
![]()
![]() ## Next Steps
Configure your CI to upload test runs to Trunk. Find the guides for your CI framework below:
## Next Steps
Configure your CI to upload test runs to Trunk. Find the guides for your CI framework below:
# minitest
Source: https://docs.trunk.io/flaky-tests/get-started/frameworks/minitest
A guide for generating Trunk-compatible test reports for minitest
You can automatically [detect and manage flaky tests](../../detection/) in your minitest projects by integrating with Trunk. This document explains how to configure minitest to output JUnit XML reports that can be uploaded to Trunk for analysis.
## Setup steps
Work through the steps below in order. Once you've finished the last one, you'll be ready to move on to [configure uploads in CI](../ci-providers/).
Generate a compatible test report} />
Configure the report file path or glob} />
Disable retries for better detection accuracy} />
Test uploads locally} />
## Generating Reports
Trunk detects flaky tests by analyzing test results automatically uploaded from your CI jobs. You can do this by generating Trunk-compatible XML reports from your test runs.
To generate XML reports, install the `minitest-reporters` gem:
```shell theme={null}
gem install minitest-reporters
```
Configure the `JUnitReporter` reporter in your `test_helper.rb` file:
```ruby title="test_helper.rb" theme={null}
require "minitest/reporters"
Minitest::Reporters.use! Minitest::Reporters::JUnitReporter.new
```
### Report File Path
You can specify a file path for your minitest results with the `MINITEST_REPORTERS_REPORTS_DIR` environment variable:
```sh theme={null}
MINITEST_REPORTERS_REPORTS_DIR="./results" ruby -Ilib:test
```
This will automatically write all test results to JUnit XML files in the `results` directory.
### Disable Retries
You need to disable automatic retries if you previously enabled them. Retries compromise the accurate detection of flaky tests.
Minitest doesn't support retries out of the box, but if you implemented retries or imported a package, remember to disable them.
## Try It Locally
### The Validate Command
You can validate your test reports using the [Trunk Analytics CLI](../../reference/cli-reference). If you don't have it installed already, you can install and run the `validate` command like this:
```bash Linux (x64) theme={null}
SKU="trunk-analytics-cli-x86_64-unknown-linux.tar.gz"
curl -fL --retry 3 \
"https://github.com/trunk-io/analytics-cli/releases/latest/download/${SKU}" \
| tar -xz
chmod +x trunk-analytics-cli
./trunk-analytics-cli validate --junit-paths "./results/*.xml"
```
```bash Linux (arm64) theme={null}
SKU="trunk-analytics-cli-aarch64-unknown-linux.tar.gz"
curl -fL --retry 3 \
"https://github.com/trunk-io/analytics-cli/releases/latest/download/${SKU}" \
| tar -xz
chmod +x trunk-analytics-cli
./trunk-analytics-cli validate --junit-paths "./results/*.xml"
```
```bash macOS (arm64) theme={null}
SKU="trunk-analytics-cli-aarch64-apple-darwin.tar.gz"
curl -fL --retry 3 \
"https://github.com/trunk-io/analytics-cli/releases/latest/download/${SKU}" \
| tar -xz
chmod +x trunk-analytics-cli
./trunk-analytics-cli validate --junit-paths "./results/*.xml"
```
```bash macOS (x64) theme={null}
SKU="trunk-analytics-cli-x86_64-apple-darwin.tar.gz"
curl -fL --retry 3 \
"https://github.com/trunk-io/analytics-cli/releases/latest/download/${SKU}" \
| tar -xz
chmod +x trunk-analytics-cli
./trunk-analytics-cli validate --junit-paths "./results/*.xml"
```
**This will not upload anything to Trunk**. To improve detection accuracy, you should **address all errors and warnings** before proceeding to the next steps.
### Test Upload
Before modifying your CI jobs to automatically upload test results to Trunk, try uploading a single test run manually.
You make an upload to Trunk using the following command:
```sh theme={null}
./trunk-analytics-cli upload --junit-paths "./results/*.xml" \
--org-url-slug \
--token
```
You can find your Trunk organization slug and token in the settings or by following these [instructions](/flaky-tests/get-started/ci-providers/otherci#id-1.-store-a-trunk_token-secret-in-your-ci-system). After your upload, you can verify that Trunk has received and processed it successfully in the **Uploads** tab. Warnings will be displayed if the report has issues.
![]()
![]() ## Next Steps
Configure your CI to upload test runs to Trunk. Find the guides for your CI framework below:
## Next Steps
Configure your CI to upload test runs to Trunk. Find the guides for your CI framework below:
# Mocha
Source: https://docs.trunk.io/flaky-tests/get-started/frameworks/mocha
A guide for generating Trunk-compatible test reports for Mocha
You can automatically [detect and manage flaky tests](../../detection/) in your Mocha projects by integrating with Trunk. This document explains how to configure Mocha to output JUnit XML reports that can be uploaded to Trunk for analysis.
## Setup steps
Work through the steps below in order. Once you've finished the last one, you'll be ready to move on to [configure uploads in CI](../ci-providers/).
Generate a compatible test report} />
Configure the report file path or glob} />
Disable retries for better detection accuracy} />
Test uploads locally} />
## Generating Reports
Before integrating with Trunk, you need to generate Trunk-compatible reports. For Mocha, the easiest approach is to generate XML reports.
First, install the `mocha-junit-reporter` package:
```shell theme={null}
npm install --save-dev mocha-junit-reporter
```
You can then generate reports when you run your tests by providing the `--reporter` and `--reporter-options` options when you run your tests:
```sh theme={null}
mocha --reporter mocha-junit-reporter --reporter-options mochaFile=./junit.xml
```
You can configure your Mocha runner to use the reporter programmatically as well:
```javascript theme={null}
var mocha = new Mocha({
reporter: 'mocha-junit-reporter',
reporterOptions: {
mochaFile: './junit.xml'
}
});
```
### Report File Path
The resulting JUnit XML file will be written to the location specified by the `mochaFile` property in `reporterOptions`. In the examples above, the results would be at `./junit.xml`.
### Disable Retries
You need to disable automatic retries if you previously enabled them. Retries compromise the accurate detection of flaky tests.
You can disable retry by omitting the `--retries` CLI option and [removing retries for individual tests](https://mochajs.org/#retry-tests).
## Try It Locally
### The Validate Command
You can validate your test reports using the [Trunk Analytics CLI](../../reference/cli-reference). If you don't have it installed already, you can install and run the `validate` command like this:
```bash Linux (x64) theme={null}
SKU="trunk-analytics-cli-x86_64-unknown-linux.tar.gz"
curl -fL --retry 3 \
"https://github.com/trunk-io/analytics-cli/releases/latest/download/${SKU}" \
| tar -xz
chmod +x trunk-analytics-cli
./trunk-analytics-cli validate --junit-paths "./junit.xml"
```
```bash Linux (arm64) theme={null}
SKU="trunk-analytics-cli-aarch64-unknown-linux.tar.gz"
curl -fL --retry 3 \
"https://github.com/trunk-io/analytics-cli/releases/latest/download/${SKU}" \
| tar -xz
chmod +x trunk-analytics-cli
./trunk-analytics-cli validate --junit-paths "./junit.xml"
```
```bash macOS (arm64) theme={null}
SKU="trunk-analytics-cli-aarch64-apple-darwin.tar.gz"
curl -fL --retry 3 \
"https://github.com/trunk-io/analytics-cli/releases/latest/download/${SKU}" \
| tar -xz
chmod +x trunk-analytics-cli
./trunk-analytics-cli validate --junit-paths "./junit.xml"
```
```bash macOS (x64) theme={null}
SKU="trunk-analytics-cli-x86_64-apple-darwin.tar.gz"
curl -fL --retry 3 \
"https://github.com/trunk-io/analytics-cli/releases/latest/download/${SKU}" \
| tar -xz
chmod +x trunk-analytics-cli
./trunk-analytics-cli validate --junit-paths "./junit.xml"
```
**This will not upload anything to Trunk**. To improve detection accuracy, you should **address all errors and warnings** before proceeding to the next steps.
### Test Upload
Before modifying your CI jobs to automatically upload test results to Trunk, try uploading a single test run manually.
You make an upload to Trunk using the following command:
```sh theme={null}
./trunk-analytics-cli upload --junit-paths "./junit.xml" \
--org-url-slug \
--token
```
You can find your Trunk organization slug and token in the settings or by following these [instructions](/flaky-tests/get-started/ci-providers/otherci#id-1.-store-a-trunk_token-secret-in-your-ci-system). After your upload, you can verify that Trunk has received and processed it successfully in the **Uploads** tab. Warnings will be displayed if the report has issues.
![]()
![]() ## Next Steps
Configure your CI to upload test runs to Trunk. Find the guides for your CI framework below:
## Next Steps
Configure your CI to upload test runs to Trunk. Find the guides for your CI framework below:
# Nightwatch
Source: https://docs.trunk.io/flaky-tests/get-started/frameworks/nightwatch
A guide for generating Trunk-compatible test reports for Nightwatch
You can automatically [detect and manage flaky tests](../../detection/) in your Nightwatch projects by integrating with Trunk. This document explains how to configure Nightwatch to output JUnit XML reports that can be uploaded to Trunk for analysis.
## Setup steps
Work through the steps below in order. Once you've finished the last one, you'll be ready to move on to [configure uploads in CI](../ci-providers/).
Generate a compatible test report} />
Configure the report file path or glob} />
Disable retries for better detection accuracy} />
Test uploads locally} />
## Generating Reports
Nightwatch will automatically report test results in multiple formats. You can configure the output location by updating the `nightwatch.conf.cjs` config file.
```javascript theme={null}
module.exports = {
output_folder: 'test-reports',
...
}
```
You can also specify output at runtime with the command line option `--output `:
```sh theme={null}
nightwatch --output ./test-reports
```
### Report File Path
Nightwatch outputs multiple reports for each test suite under the specified output folder.
If you configured your output folder to be under `./test-reports`, the JUnit XML files will be found under `./test-reports/**`. You can upload multiple JUnit reports by using a glob like `./test-reports/**/*.xml`.
**Duplicate Uploads**
When using globs, it's important to clean up old test reports between test runs. If your glob path contains old JUnit files, uploading old test results can cause tests to be mislabeled.
### Disable Retries
You need to disable automatic retries if you previously enabled them. Retries compromise the accurate detection of flaky tests.
Nightwatch doesn't implement any form of automatic retry for failed or flaky tests by default. If you have a custom implementation of retries, remember to disable them.
## Try It Locally
### The Validate Command
You can validate your test reports using the [Trunk Analytics CLI](../../reference/cli-reference). If you don't have it installed already, you can install and run the `validate` command like this:
```bash Linux (x64) theme={null}
SKU="trunk-analytics-cli-x86_64-unknown-linux.tar.gz"
curl -fL --retry 3 \
"https://github.com/trunk-io/analytics-cli/releases/latest/download/${SKU}" \
| tar -xz
chmod +x trunk-analytics-cli
./trunk-analytics-cli validate --junit-paths "./test-reports/**/*.xml"
```
```bash Linux (arm64) theme={null}
SKU="trunk-analytics-cli-aarch64-unknown-linux.tar.gz"
curl -fL --retry 3 \
"https://github.com/trunk-io/analytics-cli/releases/latest/download/${SKU}" \
| tar -xz
chmod +x trunk-analytics-cli
./trunk-analytics-cli validate --junit-paths "./test-reports/**/*.xml"
```
```bash macOS (arm64) theme={null}
SKU="trunk-analytics-cli-aarch64-apple-darwin.tar.gz"
curl -fL --retry 3 \
"https://github.com/trunk-io/analytics-cli/releases/latest/download/${SKU}" \
| tar -xz
chmod +x trunk-analytics-cli
./trunk-analytics-cli validate --junit-paths "./test-reports/**/*.xml"
```
```bash macOS (x64) theme={null}
SKU="trunk-analytics-cli-x86_64-apple-darwin.tar.gz"
curl -fL --retry 3 \
"https://github.com/trunk-io/analytics-cli/releases/latest/download/${SKU}" \
| tar -xz
chmod +x trunk-analytics-cli
./trunk-analytics-cli validate --junit-paths "./test-reports/**/*.xml"
```
**This will not upload anything to Trunk**. To improve detection accuracy, you should **address all errors and warnings** before proceeding to the next steps.
### Test Upload
Before modifying your CI jobs to automatically upload test results to Trunk, try uploading a single test run manually.
You make an upload to Trunk using the following command:
```sh theme={null}
./trunk-analytics-cli upload --junit-paths "./test-reports/**/*.xml" \
--org-url-slug \
--token
```
You can find your Trunk organization slug and token in the settings or by following these [instructions](/flaky-tests/get-started/ci-providers/otherci#id-1.-store-a-trunk_token-secret-in-your-ci-system). After your upload, you can verify that Trunk has received and processed it successfully in the **Uploads** tab. Warnings will be displayed if the report has issues.
![]()
![]() ## Next Steps
Configure your CI to upload test runs to Trunk. Find the guides for your CI framework below:
## Next Steps
Configure your CI to upload test runs to Trunk. Find the guides for your CI framework below:
# NUnit
Source: https://docs.trunk.io/flaky-tests/get-started/frameworks/nunit
A guide for generating Trunk-compatible test reports for NUnit
You can automatically [detect and manage flaky tests](../../detection/) in your NUnit projects by integrating with Trunk. This document explains how to configure NUnit to output JUnit XML reports that can be uploaded to Trunk for analysis.
## Setup steps
Work through the steps below in order. Once you've finished the last one, you'll be ready to move on to [configure uploads in CI](../ci-providers/).
Generate a compatible test report} />
Configure the report file path or glob} />
Disable retries for better detection accuracy} />
Test uploads locally} />
## Generating Reports
Trunk detects flaky tests by analyzing test results automatically uploaded from your CI jobs. You can do this by generating Trunk-compatible XML reports from your test runs.
You can do this in dotnet with the NUnit's built-in JUnit reporter:
```sh theme={null}
dotnet test -o build -- NUnit.TestOutputXml="junit"
```
### Report File Path
.NET will output each build to the path specified by `-o ` and test results under a sub-folder of `/test-reports`, specified by the `-- NUnit.TestOutputXml=""` option.
In the example command from the [Generating Reports step](./nunit#generating-reports), the XMLs will be located under `./build/test-reports/junit/*.xml`. This is also the glob you'll use to locate the results when uploading test results.
### Disable Retries
You need to disable automatic retries if you previously included them. Retries compromise the accurate detection of flaky tests.
Omit `[Retry(n)]` from tests to disable retries.
## Try It Locally
### The Validate Command
You can validate your test reports using the [Trunk Analytics CLI](../../reference/cli-reference). If you don't have it installed already, you can install and run the `validate` command like this:
```bash Linux (x64) theme={null}
SKU="trunk-analytics-cli-x86_64-unknown-linux.tar.gz"
curl -fL --retry 3 \
"https://github.com/trunk-io/analytics-cli/releases/latest/download/${SKU}" \
| tar -xz
chmod +x trunk-analytics-cli
./trunk-analytics-cli validate --junit-paths "./build/test-reports/junit/*.xml"
```
```bash Linux (arm64) theme={null}
SKU="trunk-analytics-cli-aarch64-unknown-linux.tar.gz"
curl -fL --retry 3 \
"https://github.com/trunk-io/analytics-cli/releases/latest/download/${SKU}" \
| tar -xz
chmod +x trunk-analytics-cli
./trunk-analytics-cli validate --junit-paths "./build/test-reports/junit/*.xml"
```
```bash macOS (arm64) theme={null}
SKU="trunk-analytics-cli-aarch64-apple-darwin.tar.gz"
curl -fL --retry 3 \
"https://github.com/trunk-io/analytics-cli/releases/latest/download/${SKU}" \
| tar -xz
chmod +x trunk-analytics-cli
./trunk-analytics-cli validate --junit-paths "./build/test-reports/junit/*.xml"
```
```bash macOS (x64) theme={null}
SKU="trunk-analytics-cli-x86_64-apple-darwin.tar.gz"
curl -fL --retry 3 \
"https://github.com/trunk-io/analytics-cli/releases/latest/download/${SKU}" \
| tar -xz
chmod +x trunk-analytics-cli
./trunk-analytics-cli validate --junit-paths "./build/test-reports/junit/*.xml"
```
**This will not upload anything to Trunk**. To improve detection accuracy, you should **address all errors and warnings** before proceeding to the next steps.
### Test Upload
Before modifying your CI jobs to automatically upload test results to Trunk, try uploading a single test run manually.
You make an upload to Trunk using the following command:
```sh theme={null}
./trunk-analytics-cli upload --junit-paths "./build/test-reports/junit/*.xml" \
--org-url-slug \
--token
```
You can find your Trunk organization slug and token in the settings or by following these [instructions](/flaky-tests/get-started/ci-providers/otherci#id-1.-store-a-trunk_token-secret-in-your-ci-system). After your upload, you can verify that Trunk has received and processed it successfully in the **Uploads** tab. Warnings will be displayed if the report has issues.
![]()
![]() ## Next Steps
Configure your CI to upload test runs to Trunk. Find the guides for your CI framework below:
## Next Steps
Configure your CI to upload test runs to Trunk. Find the guides for your CI framework below:
# Other Test Frameworks
Source: https://docs.trunk.io/flaky-tests/get-started/frameworks/other-test-frameworks
A guide for generating Trunk-compatible test reports with other test frameworks
Trunk Flaky Tests is designed to be test framework agnostic. If you don't see a guide for your test framework, you can still use Flaky Tests. To use Flaky Tests, you will need to report test results in a format that Trunk understands and upload them to Trunk in CI. This guide will explain how to integrate your test framework with Trunk.
## 1. Generate JUnit
Trunk detects flaky tests by analyzing each test case's results over time. Trunk currently supports the JUnit XML and XCResult report formats. You will need to configure your test runner to report in one of these formats using a plugin or your own test result reporter.
Make sure your test reports accurately report the file name, test name, and stack trace of each test result. Make sure the test names are not randomized. These details help Trunk better detect and display your test cases' health status.
## 2. Output Location
You'll need to validate and upload the generated JUnit files to Trunk later during the setup process. Make sure the reports are generated with a **consistent name** and aren't **cached or committed** to Git.
## 3. Validate Your Reports
Since you'll be generating JUnit reports using a new plugin or custom reporter, you should use the Trunk Analytics CLI to validate your results and fix any warnings or errors.
You can install the Trunk Analytics CLI locally like this:
```bash Linux (x64) theme={null}
SKU="trunk-analytics-cli-x86_64-unknown-linux.tar.gz"
curl -fL --retry 3 \
"https://github.com/trunk-io/analytics-cli/releases/latest/download/${SKU}" \
| tar -xz
chmod +x trunk-analytics-cli
```
```bash Linux (arm64) theme={null}
SKU="trunk-analytics-cli-aarch64-unknown-linux.tar.gz"
curl -fL --retry 3 \
"https://github.com/trunk-io/analytics-cli/releases/latest/download/${SKU}" \
| tar -xz
chmod +x trunk-analytics-cli
```
```bash macOS (arm64) theme={null}
SKU="trunk-analytics-cli-aarch64-apple-darwin.tar.gz"
curl -fL --retry 3 \
"https://github.com/trunk-io/analytics-cli/releases/latest/download/${SKU}" \
| tar -xz
chmod +x trunk-analytics-cli
```
```bash macOS (x64) theme={null}
SKU="trunk-analytics-cli-x86_64-apple-darwin.tar.gz"
curl -fL --retry 3 \
"https://github.com/trunk-io/analytics-cli/releases/latest/download/${SKU}" \
| tar -xz
chmod +x trunk-analytics-cli
```
Then, you can validate the results using the `trunk-analytics-cli validate` command like this:
```bash theme={null}
./trunk-analytics-cli validate --junit-paths
```
## Next Step
You'll need to upload the JUnit reports generated by your CI jobs to Trunk so Trunk can [detect flaky tests](../../detection/) and [report them to the dashboard](../../dashboard). See [CI Providers](../ci-providers/) for a guide on how to upload test results to Trunk.
# Pest
Source: https://docs.trunk.io/flaky-tests/get-started/frameworks/pest
A guide for generating Trunk-compatible test reports for Pest
You can automatically [detect and manage flaky tests](../../detection/) in your PHP projects by integrating with Trunk. This document explains how to configure Pest to output JUnit XML reports that can be uploaded to Trunk for analysis.
## Setup steps
Work through the steps below in order. Once you've finished the last one, you'll be ready to move on to [configure uploads in CI](../ci-providers/).
Generate a compatible test report} />
Configure the report file path or glob} />
Disable retries for better detection accuracy} />
Test uploads locally} />
## Generating Reports
Trunk detects flaky tests by analyzing test results automatically uploaded from your CI jobs. You can do this by generating Trunk-compatible XML reports from your test runs.
To generate XML reports, append `--log-junit junit.xml` to your `pest` test command:
```bash theme={null}
pest --log-junit junit.xml
```
### Report File Path
The JUnit report is written to the location specified by `--log-junit`. In the example above, the test results will be written to `./junit.xml`.
### Disable Retries
You need to disable automatic retries if you previously enabled them. Retries compromise the accurate detection of flaky tests.
Pest doesn't support retries out of the box, but if you implemented retries, remember to disable them.
## Try It Locally
### The Validate Command
You can validate your test reports using the [Trunk Analytics CLI](../../reference/cli-reference). If you don't have it installed already, you can install and run the `validate` command like this:
```bash Linux (x64) theme={null}
SKU="trunk-analytics-cli-x86_64-unknown-linux.tar.gz"
curl -fL --retry 3 \
"https://github.com/trunk-io/analytics-cli/releases/latest/download/${SKU}" \
| tar -xz
chmod +x trunk-analytics-cli
./trunk-analytics-cli validate --junit-paths "./junit.xml"
```
```bash Linux (arm64) theme={null}
SKU="trunk-analytics-cli-aarch64-unknown-linux.tar.gz"
curl -fL --retry 3 \
"https://github.com/trunk-io/analytics-cli/releases/latest/download/${SKU}" \
| tar -xz
chmod +x trunk-analytics-cli
./trunk-analytics-cli validate --junit-paths "./junit.xml"
```
```bash macOS (arm64) theme={null}
SKU="trunk-analytics-cli-aarch64-apple-darwin.tar.gz"
curl -fL --retry 3 \
"https://github.com/trunk-io/analytics-cli/releases/latest/download/${SKU}" \
| tar -xz
chmod +x trunk-analytics-cli
./trunk-analytics-cli validate --junit-paths "./junit.xml"
```
```bash macOS (x64) theme={null}
SKU="trunk-analytics-cli-x86_64-apple-darwin.tar.gz"
curl -fL --retry 3 \
"https://github.com/trunk-io/analytics-cli/releases/latest/download/${SKU}" \
| tar -xz
chmod +x trunk-analytics-cli
./trunk-analytics-cli validate --junit-paths "./junit.xml"
```
**This will not upload anything to Trunk**. To improve detection accuracy, you should **address all errors and warnings** before proceeding to the next steps.
### Test Upload
Before modifying your CI jobs to automatically upload test results to Trunk, try uploading a single test run manually.
You make an upload to Trunk using the following command:
```sh theme={null}
./trunk-analytics-cli upload --junit-paths "./junit.xml" \
--org-url-slug \
--token
```
You can find your Trunk organization slug and token in the settings or by following these [instructions](/flaky-tests/get-started/ci-providers/otherci#id-1.-store-a-trunk_token-secret-in-your-ci-system). After your upload, you can verify that Trunk has received and processed it successfully in the **Uploads** tab. Warnings will be displayed if the report has issues.
![]()
![]() ## Next Steps
Configure your CI to upload test runs to Trunk. Find the guides for your CI framework below:
## Next Steps
Configure your CI to upload test runs to Trunk. Find the guides for your CI framework below:
# PHPUnit
Source: https://docs.trunk.io/flaky-tests/get-started/frameworks/phpunit
A guide for generating Trunk-compatible test reports for PHPUnit
You can automatically [detect and manage flaky tests](../../detection/) in your PHP projects by integrating with Trunk. This document explains how to configure PHPUnit to output JUnit XML reports that can be uploaded to Trunk for analysis.
## Setup steps
Work through the steps below in order. Once you've finished the last one, you'll be ready to move on to [configure uploads in CI](../ci-providers/).
Generate a compatible test report} />
Configure the report file path or glob} />
Disable retries for better detection accuracy} />
Test uploads locally} />
## Generating Reports
Trunk detects flaky tests by analyzing test results automatically uploaded from your CI jobs. You can do this by generating Trunk-compatible XML reports from your test runs.
To generate XML reports, append `--log-junit junit.xml` to your `phpunit` test command:
```bash theme={null}
phpunit ./tests --log-junit junit.xml
```
### Report File Path
The JUnit report is written to the location specified by `--log-junit`. In the example above, the test results will be written to `./junit.xml`.
### Disable Retries
You need to disable automatic retries if you previously enabled them. Retries compromise the accurate detection of flaky tests.
PHPUnit doesn't support retries out of the box, but if you implemented retries, remember to disable them.
## Try It Locally
### The Validate Command
You can validate your test reports using the [Trunk Analytics CLI](../../reference/cli-reference). If you don't have it installed already, you can install and run the `validate` command like this:
```bash Linux (x64) theme={null}
SKU="trunk-analytics-cli-x86_64-unknown-linux.tar.gz"
curl -fL --retry 3 \
"https://github.com/trunk-io/analytics-cli/releases/latest/download/${SKU}" \
| tar -xz
chmod +x trunk-analytics-cli
./trunk-analytics-cli validate --junit-paths "./junit.xml"
```
```bash Linux (arm64) theme={null}
SKU="trunk-analytics-cli-aarch64-unknown-linux.tar.gz"
curl -fL --retry 3 \
"https://github.com/trunk-io/analytics-cli/releases/latest/download/${SKU}" \
| tar -xz
chmod +x trunk-analytics-cli
./trunk-analytics-cli validate --junit-paths "./junit.xml"
```
```bash macOS (arm64) theme={null}
SKU="trunk-analytics-cli-aarch64-apple-darwin.tar.gz"
curl -fL --retry 3 \
"https://github.com/trunk-io/analytics-cli/releases/latest/download/${SKU}" \
| tar -xz
chmod +x trunk-analytics-cli
./trunk-analytics-cli validate --junit-paths "./junit.xml"
```
```bash macOS (x64) theme={null}
SKU="trunk-analytics-cli-x86_64-apple-darwin.tar.gz"
curl -fL --retry 3 \
"https://github.com/trunk-io/analytics-cli/releases/latest/download/${SKU}" \
| tar -xz
chmod +x trunk-analytics-cli
./trunk-analytics-cli validate --junit-paths "./junit.xml"
```
**This will not upload anything to Trunk**. To improve detection accuracy, you should **address all errors and warnings** before proceeding to the next steps.
### Test Upload
Before modifying your CI jobs to automatically upload test results to Trunk, try uploading a single test run manually.
You make an upload to Trunk using the following command:
```sh theme={null}
./trunk-analytics-cli upload --junit-paths "./junit.xml" \
--org-url-slug \
--token
```
You can find your Trunk organization slug and token in the settings or by following these [instructions](/flaky-tests/get-started/ci-providers/otherci#id-1.-store-a-trunk_token-secret-in-your-ci-system). After your upload, you can verify that Trunk has received and processed it successfully in the **Uploads** tab. Warnings will be displayed if the report has issues.
![]()
![]() ## Next Steps
Configure your CI to upload test runs to Trunk. Find the guides for your CI framework below:
## Next Steps
Configure your CI to upload test runs to Trunk. Find the guides for your CI framework below:
# Playwright
Source: https://docs.trunk.io/flaky-tests/get-started/frameworks/playwright
A guide for generating Trunk-compatible test reports for Playwright
You can automatically [detect and manage flaky tests](../../detection/) in your Playwright projects by integrating with Trunk. This document explains how to configure Playwright to output JUnit XML reports that can be uploaded to Trunk for analysis.
## Setup steps
Work through the steps below in order. Once you've finished the last one, you'll be ready to move on to [configure uploads in CI](../ci-providers/).
Generate a compatible test report} />
Configure the report file path or glob} />
Disable retries for better detection accuracy} />
Test uploads locally} />
## Generating Reports
Playwright has multiple built-in reporters, including JUnit XML which Trunk can ingest. To get XML reports, add the following to your Playwright config:
```typescript title="playwright.config.ts" theme={null}
import { defineConfig } from '@playwright/test';
export default defineConfig({
reporter: [
['junit', { outputFile: 'junit.xml' }]
],
});
```
Alternatively, you can specify reporting behavior inline in your CI:
```sh theme={null}
npx playwright test --reporter=junit
```
### Report File Path
You can specify the report's output location with the `PLAYWRIGHT_JUNIT_OUTPUT_FILE` environment variable:
```sh theme={null}
export PLAYWRIGHT_JUNIT_OUTPUT_FILE=junit.xml
```
You can also specify the report's location in your `playwright.config.ts` file:
```typescript theme={null}
export default defineConfig({
reporter: [
['junit', { outputFile: 'junit.xml' }]
],
});
```
### Disable Retries
You need to disable automatic retries if you previously enabled them. Retries compromise the accurate detection of flaky tests. You should disable retries for accurate detection and use the [Quarantining](../../quarantining/) feature to stop flaky tests from failing your CI jobs.
You can disable retries in Playwright by omitting the `--retries` command line option and [removing retries in your `playwright.config.ts` file](https://playwright.dev/docs/test-retries#retries).
## Try It Locally
### The Validate Command
You can validate your test reports using the [Trunk Analytics CLI](../../reference/cli-reference). If you don't have it installed already, you can install and run the `validate` command like this:
```bash Linux (x64) theme={null}
SKU="trunk-analytics-cli-x86_64-unknown-linux.tar.gz"
curl -fL --retry 3 \
"https://github.com/trunk-io/analytics-cli/releases/latest/download/${SKU}" \
| tar -xz
chmod +x trunk-analytics-cli
./trunk-analytics-cli validate --junit-paths "./junit.xml"
```
```bash Linux (arm64) theme={null}
SKU="trunk-analytics-cli-aarch64-unknown-linux.tar.gz"
curl -fL --retry 3 \
"https://github.com/trunk-io/analytics-cli/releases/latest/download/${SKU}" \
| tar -xz
chmod +x trunk-analytics-cli
./trunk-analytics-cli validate --junit-paths "./junit.xml"
```
```bash macOS (arm64) theme={null}
SKU="trunk-analytics-cli-aarch64-apple-darwin.tar.gz"
curl -fL --retry 3 \
"https://github.com/trunk-io/analytics-cli/releases/latest/download/${SKU}" \
| tar -xz
chmod +x trunk-analytics-cli
./trunk-analytics-cli validate --junit-paths "./junit.xml"
```
```bash macOS (x64) theme={null}
SKU="trunk-analytics-cli-x86_64-apple-darwin.tar.gz"
curl -fL --retry 3 \
"https://github.com/trunk-io/analytics-cli/releases/latest/download/${SKU}" \
| tar -xz
chmod +x trunk-analytics-cli
./trunk-analytics-cli validate --junit-paths "./junit.xml"
```
**This will not upload anything to Trunk**. To improve detection accuracy, you should **address all errors and warnings** before proceeding to the next steps.
### Test Upload
Before modifying your CI jobs to automatically upload test results to Trunk, try uploading a single test run manually.
You make an upload to Trunk using the following command:
```sh theme={null}
./trunk-analytics-cli upload --junit-paths "./junit.xml" \
--org-url-slug \
--token
```
You can find your Trunk organization slug and token in the settings or by following these [instructions](/flaky-tests/get-started/ci-providers/otherci#id-1.-store-a-trunk_token-secret-in-your-ci-system). After your upload, you can verify that Trunk has received and processed it successfully in the **Uploads** tab. Warnings will be displayed if the report has issues.
![]()
![]() ## Next Step
Configure your CI to upload test runs to Trunk. Find the guides for your CI framework below:
## Next Step
Configure your CI to upload test runs to Trunk. Find the guides for your CI framework below:
# Pytest
Source: https://docs.trunk.io/flaky-tests/get-started/frameworks/pytest
A guide for generating Trunk-compatible test reports for Pytest
You can automatically [detect and manage flaky tests](../../detection/) in your Pytest projects by integrating with Trunk. This document explains how to configure Pytest to output JUnit XML reports that can be uploaded to Trunk for analysis.
## Setup steps
Work through the steps below in order. Once you've finished the last one, you'll be ready to move on to [configure uploads in CI](../ci-providers/).
Generate a compatible test report} />
Configure the report file path or glob} />
Disable retries for better detection accuracy} />
Test uploads locally} />
## Generating Reports
Trunk detects flaky tests by analyzing test results automatically uploaded from your CI jobs. You can do this by generating JUnit XML reports from your test runs.
In your CI job, update your `pytest` command to include the `--junit-xml` and `junit_family=xunit1` arguments to generate XML reports:
```shell theme={null}
pytest --junit-xml=junit.xml -o junit_family=xunit1
```
The `junit_family=xunit1` is necessary so that the generated XML report includes file paths for each test case. File paths for test cases are used for features that use code owners like the [Jira integration](../../management/ticketing/jira-integration) and [webhooks](../../webhooks/).
### Report File Path
The `--junit-xml` argument specifies the path of the JUnit report. You'll need this path later when configuring automatic uploads to Trunk.
### Disable Retries
You need to disable automatic retries if you previously enabled them. Retries compromise the accurate detection of flaky tests. You should disable retries for accurate detection and use the [Quarantining](../../quarantining/) feature to stop flaky tests from failing your CI jobs.
Omit the [`--lf` or `--ff` options](https://docs.pytest.org/en/stable/how-to/cache.html) if you've previously configured your CI with these options to disable retries.
## Try It Locally
You can validate your test reports using the [Trunk Analytics CLI](../../reference/cli-reference). If you don't have it installed already, you can install and run the `validate` command like this:
```bash Linux (x64) theme={null}
SKU="trunk-analytics-cli-x86_64-unknown-linux.tar.gz"
curl -fL --retry 3 \
"https://github.com/trunk-io/analytics-cli/releases/latest/download/${SKU}" \
| tar -xz
chmod +x trunk-analytics-cli
./trunk-analytics-cli validate --junit-paths "./junit.xml"
```
```bash Linux (arm64) theme={null}
SKU="trunk-analytics-cli-aarch64-unknown-linux.tar.gz"
curl -fL --retry 3 \
"https://github.com/trunk-io/analytics-cli/releases/latest/download/${SKU}" \
| tar -xz
chmod +x trunk-analytics-cli
./trunk-analytics-cli validate --junit-paths "./junit.xml"
```
```bash macOS (arm64) theme={null}
SKU="trunk-analytics-cli-aarch64-apple-darwin.tar.gz"
curl -fL --retry 3 \
"https://github.com/trunk-io/analytics-cli/releases/latest/download/${SKU}" \
| tar -xz
chmod +x trunk-analytics-cli
./trunk-analytics-cli validate --junit-paths "./junit.xml"
```
```bash macOS (x64) theme={null}
SKU="trunk-analytics-cli-x86_64-apple-darwin.tar.gz"
curl -fL --retry 3 \
"https://github.com/trunk-io/analytics-cli/releases/latest/download/${SKU}" \
| tar -xz
chmod +x trunk-analytics-cli
./trunk-analytics-cli validate --junit-paths "./junit.xml"
```
**This will not upload anything to Trunk**. To improve detection accuracy, you should **address all errors and warnings** before proceeding to the next steps.
### Test Upload
Before modifying your CI jobs to automatically upload test results to Trunk, try uploading a single test run manually.
You make an upload to Trunk using the following command:
```sh theme={null}
./trunk-analytics-cli upload --junit-paths "./junit.xml" \
--org-url-slug \
--token
```
You can find your Trunk organization slug and token in the settings or by following these [instructions](/flaky-tests/get-started/ci-providers/otherci#id-1.-store-a-trunk_token-secret-in-your-ci-system). After your upload, you can verify that Trunk has received and processed it successfully in the **Uploads** tab. Warnings will be displayed if the report has issues.
![]()
![]() ## Next Steps
Configure your CI to upload test runs to Trunk. Find the guides for your CI framework below:
## Next Steps
Configure your CI to upload test runs to Trunk. Find the guides for your CI framework below:
# Robot Framework
Source: https://docs.trunk.io/flaky-tests/get-started/frameworks/robot-framework
A guide for generating Trunk-compatible test reports for Robot Framework
You can automatically [detect and manage flaky tests](../../detection/) in your projects running tests with Robot by integrating with Trunk. This document explains how to configure Robot to output JUnit XML reports that can be uploaded to Trunk for analysis.
## Setup steps
Work through the steps below in order. Once you've finished the last one, you'll be ready to move on to [configure uploads in CI](../ci-providers/).
Generate a compatible test report} />
Configure the report file path or glob} />
Disable retries for better detection accuracy} />
Test uploads locally} />
## Generating Reports
Trunk detects flaky tests by analyzing test results automatically uploaded from your CI jobs. You can do this by generating Trunk-compatible XML reports from your test runs.
To output compatible reports, add the `--xunit` argument to your `robot` command:
```shell theme={null}
robot --xunit=junit.xml TestSuite.robot
```
### Report File Path
The JUnit report will be written to the location specified by the `--xunit` argument. In the example above, it would be at `./junit.xml`.
### Disable Retries
You need to disable automatic retries if you previously enabled them. Retries compromise the accurate detection of flaky tests. You should disable them and prefer using the [Quarantine](../../quarantining/) feature to mitigate the negative impact of Flaky Tests.
Omit the [`--rerunfailed`](https://docs.robotframework.org/docs/flaky_tests#re-execute-failed-tests-and-merge-results) flag and remove any [RetryFailed Listeners](https://docs.robotframework.org/docs/flaky_tests#retryfailed-listener) previously configured to run as part of your CI pipeline to disable retries.
## Try It Locally
### The Validate Command
You can validate your test reports using the [Trunk Analytics CLI](../../reference/cli-reference). If you don't have it installed already, you can install and run the `validate` command like this:
```bash Linux (x64) theme={null}
SKU="trunk-analytics-cli-x86_64-unknown-linux.tar.gz"
curl -fL --retry 3 \
"https://github.com/trunk-io/analytics-cli/releases/latest/download/${SKU}" \
| tar -xz
chmod +x trunk-analytics-cli
./trunk-analytics-cli validate --junit-paths "./junit.xml"
```
```bash Linux (arm64) theme={null}
SKU="trunk-analytics-cli-aarch64-unknown-linux.tar.gz"
curl -fL --retry 3 \
"https://github.com/trunk-io/analytics-cli/releases/latest/download/${SKU}" \
| tar -xz
chmod +x trunk-analytics-cli
./trunk-analytics-cli validate --junit-paths "./junit.xml"
```
```bash macOS (arm64) theme={null}
SKU="trunk-analytics-cli-aarch64-apple-darwin.tar.gz"
curl -fL --retry 3 \
"https://github.com/trunk-io/analytics-cli/releases/latest/download/${SKU}" \
| tar -xz
chmod +x trunk-analytics-cli
./trunk-analytics-cli validate --junit-paths "./junit.xml"
```
```bash macOS (x64) theme={null}
SKU="trunk-analytics-cli-x86_64-apple-darwin.tar.gz"
curl -fL --retry 3 \
"https://github.com/trunk-io/analytics-cli/releases/latest/download/${SKU}" \
| tar -xz
chmod +x trunk-analytics-cli
./trunk-analytics-cli validate --junit-paths "./junit.xml"
```
**This will not upload anything to Trunk**. To improve detection accuracy, you should **address all errors and warnings** before proceeding to the next steps.
### Test Upload
Before modifying your CI jobs to automatically upload test results to Trunk, try uploading a single test run manually.
You make an upload to Trunk using the following command:
```sh theme={null}
./trunk-analytics-cli upload --junit-paths "./junit.xml" \
--org-url-slug \
--token
```
You can find your Trunk organization slug and token in the settings or by following these [instructions](/flaky-tests/get-started/ci-providers/otherci#id-1.-store-a-trunk_token-secret-in-your-ci-system). After your upload, you can verify that Trunk has received and processed it successfully in the **Uploads** tab. Warnings will be displayed if the report has issues.
![]()
![]() ## Next Steps
Configure your CI to upload test runs to Trunk. Find the guides for your CI framework below:
## Next Steps
Configure your CI to upload test runs to Trunk. Find the guides for your CI framework below:
# RSpec
Source: https://docs.trunk.io/flaky-tests/get-started/frameworks/rspec/index
A guide for generating Trunk-compatible test reports for RSpec using Trunk's RSpec plugin
You can automatically [detect and manage flaky tests](../../../detection/) in your projects running RSpec by integrating with Trunk. This document explains how to use Trunk's RSpec plugin to upload test results to Trunk.
## Setup steps
Work through the steps below in order. Once you've finished the last one, you'll be ready to move on to [configure uploads in CI](../../ci-providers/).
Set up and install Trunk's RSpec plugin} />
Disable retries for better detection accuracy} />
Test uploads locally} />
Using the plugin is the best way to accurately detect flaky RSpec tests.
You can also [manually generate and upload](./manual-uploads) test results in RSpec, however, **manual RSpec uploads are not recommended.**
## Installing the plugin
Trunk detects flaky tests by analyzing test results automatically uploaded from your CI jobs. You can do this for your Rspec tests using Trunk's RSpec plugin.
To install the plugin in your project, add the `rspec_trunk_flaky_tests` gem to your `Gemfile`:
```shell title="Gemfile" theme={null}
gem "rspec_trunk_flaky_tests"
```
Install the plugin:
```sh theme={null}
bundle install
```
Then, load the plugin in `spec_helper.rb`:
```shell title="spec/spec_helper.rb" theme={null}
require "trunk_spec_helper"
```
### Disable Retries
You need to disable automatic retries if you previously enabled them. Retries compromise the accurate detection of flaky tests.
If you have a step in CI to rerun failed tests with the `--only-failures` option, or you're using a package like [rspec-retry](https://github.com/NoRedInk/rspec-retry), remember to disable them.
### Versions and Updating the Plugin
You can find the Gem for `rspec_trunk_flaky_tests` [here](https://rubygems.org/gems/rspec_trunk_flaky_tests), along with its version history. This plugin is periodically updated with improved support and bug fixes. If you're encountering something unexpected, first try:
```
bundle update rspec_trunk_flaky_tests
```
If a failing test raises `RSpec::Core::MultipleExceptionError`, only one of the captured exceptions appears in the failure detail view today. See [Known limitations](../../../dashboard#known-limitations) for the current status and workaround.
### Environment Variables
These optional environment variables can be set in your project to change the behavior of the RSpec plugin.
### Repository metadata variables:
| Argument | Description |
| ------------------------------ | ----------------------------------------------------------------------------------------- |
| `TRUNK_REPO_ROOT` | Path to repository root |
| `TRUNK_REPO_URL` | Repository URL (e.g., [https://github.com/org/repo.git](https://github.com/org/repo.git)) |
| `TRUNK_REPO_HEAD_SHA` | HEAD commit SHA |
| `TRUNK_REPO_HEAD_BRANCH` | HEAD branch name |
| `TRUNK_REPO_HEAD_COMMIT_EPOCH` | HEAD commit timestamp (seconds since epoch) |
| `TRUNK_REPO_HEAD_AUTHOR_NAME` | HEAD commit author name |
### Configuration variables:
| Argument | Description |
| --------------------------------- | --------------------------------------------------------- |
| `TRUNK_CODEOWNERS_PATH` | Path to CODEOWNERS file |
| `TRUNK_VARIANT` | Variant name for test results (e.g., 'linux', 'pr-123') |
| `TRUNK_DISABLE_QUARANTINING` | Set to 'true' to disable quarantining |
| `TRUNK_ALLOW_EMPTY_TEST_RESULTS` | Set to 'true' to allow empty results |
| `TRUNK_DRY_RUN` | Set to 'true' to save bundle locally instead of uploading |
| `TRUNK_USE_UNCLONED_REPO` | Set to 'true' for uncloned repo mode |
| `TRUNK_LOCAL_UPLOAD_DIR` | Directory to save test results locally (disables upload) |
| `DISABLE_RSPEC_TRUNK_FLAKY_TESTS` | Set to 'true' to completely disable Trunk |
## Try It Locally
### Test Upload
Before modifying your CI jobs to automatically upload test results to Trunk, try uploading a single test run manually.
You make an upload to Trunk using the following command:
```sh theme={null}
TRUNK_ORG_URL_SLUG= \
TRUNK_API_TOKEN= \
bundle exec rspec
```
You can find your Trunk organization URL slug and token in the **Settings** or by following these [instructions](/flaky-tests/get-started/ci-providers/otherci#id-1.-store-a-trunk_token-secret-in-your-ci-system).
After your upload, you can verify that Trunk has received and processed it successfully in the **Uploads** tab. Warnings will be displayed if the test report uploaded by the plugin has issues.
![]()
![]()
You do not need to download the `trunk-analytics-cli` when using the Trunk RSpec plugin. Uploads are handled for you as long as you have set `TRUNK_ORG_URL_SLUG` and `TRUNK_API_TOKEN`.
## Next Steps
Configure your CI to upload test runs to Trunk. Find the guides for your CI framework below:
# RSpec (Manual Uploads)
Source: https://docs.trunk.io/flaky-tests/get-started/frameworks/rspec/manual-uploads
A guide for generating Trunk-compatible test reports for RSpec without using Trunk's RSpec plugin
You can automatically [detect and manage flaky tests](../../../detection/) in your projects running RSpec by integrating with Trunk. This document explains how to configure RSpec to output JUnit XML reports that can be uploaded to Trunk for analysis.
We highly recommend using [Trunk's RSpec plugin](./) to upload test results for the best accuracy when detecting flaky tests.
## Setup steps
Work through the steps below in order. Once you've finished the last one, you'll be ready to move on to [configure uploads in CI](../../ci-providers/).
Generate a compatible test report} />
Configure the report file path or glob} />
Disable retries for better detection accuracy} />
Test uploads locally} />
## Generating Reports
Trunk detects flaky tests by analyzing test results automatically uploaded from your CI jobs. You can do this for your Rspec tests by generating JUnit XML reports from your test runs.
To generate Trunk-compatible reports, install the `rspec_junit_formatter`:
```shell theme={null}
gem install rspec_junit_formatter
```
You can use `rspec_junit_formatter` like this:
```shell theme={null}
rspec --format RspecJunitFormatter --out junit.xml
```
### Report File Path
The JUnit report will be written to the location specified by the `--out` argument. In the example above, the report would be at `./junit.xml`. You will need this when you update your CI config to integrate with Trunk.
### Disable Retries
You need to disable automatic retries if you previously enabled them. Retries compromise the accurate detection of flaky tests.
If you have a step in CI to rerun failed tests with the `--only-failures` option, or you're using a package like [rspec-retry](https://github.com/NoRedInk/rspec-retry), remember to disable them.
## Try It Locally
### The Validate Command
You can validate your test reports using the [Trunk Analytics CLI](../../../reference/cli-reference). If you don't have it installed already, you can install and run the `validate` command like this:
```bash Linux (x64) theme={null}
SKU="trunk-analytics-cli-x86_64-unknown-linux.tar.gz"
curl -fL --retry 3 \
"https://github.com/trunk-io/analytics-cli/releases/latest/download/${SKU}" \
| tar -xz
chmod +x trunk-analytics-cli
./trunk-analytics-cli validate --junit-paths "./junit.xml"
```
```bash Linux (arm64) theme={null}
SKU="trunk-analytics-cli-aarch64-unknown-linux.tar.gz"
curl -fL --retry 3 \
"https://github.com/trunk-io/analytics-cli/releases/latest/download/${SKU}" \
| tar -xz
chmod +x trunk-analytics-cli
./trunk-analytics-cli validate --junit-paths "./junit.xml"
```
```bash macOS (arm64) theme={null}
SKU="trunk-analytics-cli-aarch64-apple-darwin.tar.gz"
curl -fL --retry 3 \
"https://github.com/trunk-io/analytics-cli/releases/latest/download/${SKU}" \
| tar -xz
chmod +x trunk-analytics-cli
./trunk-analytics-cli validate --junit-paths "./junit.xml"
```
```bash macOS (x64) theme={null}
SKU="trunk-analytics-cli-x86_64-apple-darwin.tar.gz"
curl -fL --retry 3 \
"https://github.com/trunk-io/analytics-cli/releases/latest/download/${SKU}" \
| tar -xz
chmod +x trunk-analytics-cli
./trunk-analytics-cli validate --junit-paths "./junit.xml"
```
**This will not upload anything to Trunk**. To improve detection accuracy, you should **address all errors and warnings** before proceeding to the next steps.
### Test Upload
Before modifying your CI jobs to automatically upload test results to Trunk, try uploading a single test run manually.
You make an upload to Trunk using the following command:
```sh theme={null}
./trunk-analytics-cli upload --junit-paths "./junit.xml" \
--org-url-slug \
--token
```
You can find your Trunk organization slug and token in the settings or by following these [instructions](/flaky-tests/get-started/ci-providers/otherci#id-1.-store-a-trunk_token-secret-in-your-ci-system). After your upload, you can verify that Trunk has received and processed it successfully in the **Uploads** tab. Warnings will be displayed if the report has issues.
![]()
![]() ## Next Steps
Configure your CI to upload test runs to Trunk. Find the guides for your CI framework below:
## Next Steps
Configure your CI to upload test runs to Trunk. Find the guides for your CI framework below:
# cargo-nextest
Source: https://docs.trunk.io/flaky-tests/get-started/frameworks/rust
A guide for generating Trunk-compatible test reports for Rust
You can automatically [detect and manage flaky tests](../../detection/) in your Rust projects by integrating with Trunk. This document explains how to configure cargo-nextest to output JUnit XML reports that can be uploaded to Trunk for analysis.
## Setup steps
Work through the steps below in order. Once you've finished the last one, you'll be ready to move on to [configure uploads in CI](../ci-providers/).
Generate a compatible test report} />
Configure the report file path or glob} />
Disable retries for better detection accuracy} />
Test uploads locally} />
## Generating Reports
`cargo-nextest` has built-in reporting for JUnit XML reports, which is trunk-compatible. You can enable JUnit reporting by adding the following to your nextest config:
```toml title=".config/nextest.toml" theme={null}
[profile.ci.junit]
path = "junit.xml"
```
You can invoke this profile when running tests with:
```sh theme={null}
cargo nextest run --profile ci
```
### Report File Path
`cargo-nextest` outputs artifacts at `target/nextest` by default. When you provide a profile and a file name via the config example above, it produces a report at `target/nextest/ci/junit.xml`.
### Disable Retries
You need to disable automatic retries if you previously enabled them. Retries compromise the accurate detection of flaky tests.
Omit the `--retries` option.
## Try It Locally
### The Validate Command
You can validate your test reports using the [Trunk Analytics CLI](../../reference/cli-reference). If you don't have it installed already, you can install and run the `validate` command like this:
```bash Linux (x64) theme={null}
SKU="trunk-analytics-cli-x86_64-unknown-linux.tar.gz"
curl -fL --retry 3 \
"https://github.com/trunk-io/analytics-cli/releases/latest/download/${SKU}" \
| tar -xz
chmod +x trunk-analytics-cli
./trunk-analytics-cli validate --junit-paths "./target/nextest/ci/junit.xml"
```
```bash Linux (arm64) theme={null}
SKU="trunk-analytics-cli-aarch64-unknown-linux.tar.gz"
curl -fL --retry 3 \
"https://github.com/trunk-io/analytics-cli/releases/latest/download/${SKU}" \
| tar -xz
chmod +x trunk-analytics-cli
./trunk-analytics-cli validate --junit-paths "./target/nextest/ci/junit.xml"
```
```bash macOS (arm64) theme={null}
SKU="trunk-analytics-cli-aarch64-apple-darwin.tar.gz"
curl -fL --retry 3 \
"https://github.com/trunk-io/analytics-cli/releases/latest/download/${SKU}" \
| tar -xz
chmod +x trunk-analytics-cli
./trunk-analytics-cli validate --junit-paths "./target/nextest/ci/junit.xml"
```
```bash macOS (x64) theme={null}
SKU="trunk-analytics-cli-x86_64-apple-darwin.tar.gz"
curl -fL --retry 3 \
"https://github.com/trunk-io/analytics-cli/releases/latest/download/${SKU}" \
| tar -xz
chmod +x trunk-analytics-cli
./trunk-analytics-cli validate --junit-paths "./target/nextest/ci/junit.xml"
```
This will not upload anything to Trunk. To improve detection accuracy, you should address all errors and warnings before proceeding to the next steps.
### Test Upload
Before modifying your CI jobs to automatically upload test results to Trunk, try uploading a single test run manually.
You make an upload to Trunk using the following command:
```sh theme={null}
./trunk-analytics-cli upload --junit-paths "./target/nextest/ci/junit.xml" \
--org-url-slug \
--token
```
## Next Steps
Configure your CI to upload test runs to Trunk. Find the guides for your CI framework below:
# Swift Testing
Source: https://docs.trunk.io/flaky-tests/get-started/frameworks/swift-testing
A guide for generating Trunk-compatible test reports with Swift Testing
You can automatically [detect and manage flaky tests](../../detection/) in your Swift projects by integrating with Trunk. This document explains how to configure Swift Testing to output JUnit XML reports that can be uploaded to Trunk for analysis.
## Setup steps
Work through the steps below in order. Once you've finished the last one, you'll be ready to move on to [configure uploads in CI](../ci-providers/).
Generate a compatible test report} />
Configure the report file path or glob} />
Disable retries for better detection accuracy} />
Test uploads locally} />
## Generating Reports
Trunk detects flaky tests by analyzing test results automatically uploaded from your CI jobs. You can do this by generating Trunk-compatible XML reports from your test runs.
To output a compatible report, add the `--xunit-output` argument to your Swift test command:
```shell theme={null}
swift test --xunit-output junit.xml --parallel
```
Due to a [known bug](https://github.com/swiftlang/swift-package-manager/issues/4752) with Swift, you must include the `--parallel` flag for the XML report to output properly.
### Report File Path
The test report will be written to the location specified by the `--xunit-output` argument. In the example above, it would be at `./junit.xml`.
### Disable Retries
You need to disable automatic retries if you previously enabled them. Retries compromise the accurate detection of flaky tests.
Swift Testing doesn't support retries out of the box, but if you implemented retries or imported a package, remember to disable them.
## Try It Locally
### The Validate Command
You can validate your test reports using the [Trunk Analytics CLI](../../reference/cli-reference). If you don't have it installed already, you can install and run the `validate` command like this:
```bash Linux (x64) theme={null}
SKU="trunk-analytics-cli-x86_64-unknown-linux.tar.gz"
curl -fL --retry 3 \
"https://github.com/trunk-io/analytics-cli/releases/latest/download/${SKU}" \
| tar -xz
chmod +x trunk-analytics-cli
./trunk-analytics-cli validate --junit-paths "./junit.xml"
```
```bash Linux (arm64) theme={null}
SKU="trunk-analytics-cli-aarch64-unknown-linux.tar.gz"
curl -fL --retry 3 \
"https://github.com/trunk-io/analytics-cli/releases/latest/download/${SKU}" \
| tar -xz
chmod +x trunk-analytics-cli
./trunk-analytics-cli validate --junit-paths "./junit.xml"
```
```bash macOS (arm64) theme={null}
SKU="trunk-analytics-cli-aarch64-apple-darwin.tar.gz"
curl -fL --retry 3 \
"https://github.com/trunk-io/analytics-cli/releases/latest/download/${SKU}" \
| tar -xz
chmod +x trunk-analytics-cli
./trunk-analytics-cli validate --junit-paths "./junit.xml"
```
```bash macOS (x64) theme={null}
SKU="trunk-analytics-cli-x86_64-apple-darwin.tar.gz"
curl -fL --retry 3 \
"https://github.com/trunk-io/analytics-cli/releases/latest/download/${SKU}" \
| tar -xz
chmod +x trunk-analytics-cli
./trunk-analytics-cli validate --junit-paths "./junit.xml"
```
**This will not upload anything to Trunk**. To improve detection accuracy, you should **address all errors and warnings** before proceeding to the next steps.
### Test Upload
Before modifying your CI jobs to automatically upload test results to Trunk, try uploading a single test run manually.
You make an upload to Trunk using the following command:
```sh theme={null}
./trunk-analytics-cli upload --junit-paths "./junit.xml" \
--org-url-slug \
--token
```
You can find your Trunk organization slug and token in the settings or by following these [instructions](/flaky-tests/get-started/ci-providers/otherci#id-1.-store-a-trunk_token-secret-in-your-ci-system). After your upload, you can verify that Trunk has received and processed it successfully in the **Uploads** tab. Warnings will be displayed if the report has issues.
![]()
![]() ## Next Steps
Configure your CI to upload test runs to Trunk. Find the guides for your CI framework below:
## Next Steps
Configure your CI to upload test runs to Trunk. Find the guides for your CI framework below:
# Testplan
Source: https://docs.trunk.io/flaky-tests/get-started/frameworks/testplan
A guide for generating Trunk-compatible test reports for Testplan
You can automatically [detect and manage flaky tests](../../detection/) in your projects running Testplan by integrating with Trunk. This document explains how to configure Testplan to output JUnit XML reports that can be uploaded to Trunk for analysis.
## Setup steps
Work through the steps below in order. Once you've finished the last one, you'll be ready to move on to [configure uploads in CI](../ci-providers/).
Generate a compatible test report} />
Configure the report file path or glob} />
Disable retries for better detection accuracy} />
Test uploads locally} />
## Generating reports
Trunk detects flaky tests by analyzing test results automatically uploaded from your CI jobs. Testplan can output JUnit XML reports which are compatible with Trunk. You can do so with the `--xml` option:
```sh theme={null}
./test_plan.py --xml
```
### Report file path
You can specify the file path for the reports with the `--xml` option.
```sh theme={null}
./test_plan.py --xml ./junit-reports
```
Testplan outputs multiple XML reports under the JUnit directory. You can locate these when uploading the reports in CI with the `"./junit-reports/*.xml"` glob.
```python Python theme={null}
@test_plan(name='SamplePlan', xml_dir='junit-reports')
def main(plan):
...
```
## Disable Retries
You need to disable automatic retries if you previously enabled them. Retries compromise the accurate detection of flaky tests. You should disable retries for accurate detection and use the [Quarantining](../../quarantining/) feature to stop flaky tests from failing your CI jobs.
### Task-level Retries
If you're using execution pools (ThreadPool, ProcessPool) and have configured tasks with the rerun parameter, you should remove this configuration:
```python theme={null}
# Remove or set rerun=0
task = Task(target='make_multitest', module='tasks', rerun=2)
plan.schedule(task, resource='MyPool')
# Instead, use:
task = Task(target='make_multitest', module='tasks')
plan.schedule(task, resource='MyPool')
```
### Thread Pool Retries
If you're using ThreadPools, tasks retries can be disabled at the pool level, you should remove this configuration:
```python theme={null}
# Set allow_task_rerun=FALSE
pool = ThreadPool(name="MyPool", allow_task_rerun=True)
# Instead, use:
pool = ThreadPool(name="MyPool", allow_task_rerun=False)
```
## Try It Locally
### The Validate Command
You can validate your test reports using the [Trunk Analytics CLI](../../reference/cli-reference). If you don't have it installed already, you can install and run the `validate` command like this:
```bash Linux (x64) theme={null}
SKU="trunk-analytics-cli-x86_64-unknown-linux.tar.gz"
curl -fL --retry 3 \
"https://github.com/trunk-io/analytics-cli/releases/latest/download/${SKU}" \
| tar -xz
chmod +x trunk-analytics-cli
./trunk-analytics-cli validate --junit-paths "./junit-reports/*.xml"
```
```bash Linux (arm64) theme={null}
SKU="trunk-analytics-cli-aarch64-unknown-linux.tar.gz"
curl -fL --retry 3 \
"https://github.com/trunk-io/analytics-cli/releases/latest/download/${SKU}" \
| tar -xz
chmod +x trunk-analytics-cli
./trunk-analytics-cli validate --junit-paths "./junit-reports/*.xml"
```
```bash macOS (arm64) theme={null}
SKU="trunk-analytics-cli-aarch64-apple-darwin.tar.gz"
curl -fL --retry 3 \
"https://github.com/trunk-io/analytics-cli/releases/latest/download/${SKU}" \
| tar -xz
chmod +x trunk-analytics-cli
./trunk-analytics-cli validate --junit-paths "./junit-reports/*.xml"
```
```bash macOS (x64) theme={null}
SKU="trunk-analytics-cli-x86_64-apple-darwin.tar.gz"
curl -fL --retry 3 \
"https://github.com/trunk-io/analytics-cli/releases/latest/download/${SKU}" \
| tar -xz
chmod +x trunk-analytics-cli
./trunk-analytics-cli validate --junit-paths "./junit-reports/*.xml"
```
**This will not upload anything to Trunk**. To improve detection accuracy, you should **address all errors and warnings** before proceeding to the next steps.
### Test Upload
Before modifying your CI jobs to automatically upload test results to Trunk, try uploading a single test run manually.
You make an upload to Trunk using the following command:
```sh theme={null}
./trunk-analytics-cli upload --junit-paths "./junit-reports/*.xml" \
--org-url-slug \
--token
```
You can find your Trunk organization slug and token in the settings or by following these [instructions](/flaky-tests/get-started/ci-providers/otherci#id-1.-store-a-trunk_token-secret-in-your-ci-system). After your upload, you can verify that Trunk has received and processed it successfully in the **Uploads** tab. Warnings will be displayed if the report has issues.
## Next Steps
Configure your CI to upload test runs to Trunk. Find the guides for your CI framework below:
# Vitest
Source: https://docs.trunk.io/flaky-tests/get-started/frameworks/vitest
A guide for generating Trunk-compatible test reports with Vitest
You can automatically [detect and manage flaky tests](../../detection/) in your Vitest projects by integrating with Trunk. This document explains how to configure Vitest to output JUnit XML reports that can be uploaded to Trunk for analysis.
## Setup steps
Work through the steps below in order. Once you've finished the last one, you'll be ready to move on to [configure uploads in CI](../ci-providers/).
Generate a compatible test report} />
Configure the report file path or glob} />
Disable retries for better detection accuracy} />
Test uploads locally} />
## Generating Reports
Trunk detects flaky tests by analyzing test results automatically uploaded from your CI jobs. You can do this by generating Trunk-compatible XML reports from your test runs.
You can configure Vitest to produce a Trunk-compatible JUnitXML report by updating your `vitest.config.ts`.
```javascript title="vitest.config.ts" theme={null}
import { defineConfig } from 'vitest/config';
export default defineConfig({
test: {
reporters: [
['junit', { outputFile: './junit.xml', addFileAttribute: true }],
],
},
});
```
**Important**: The `addFileAttribute: true` option is required for the JUnit report to pass `trunk-analytics-cli` validation. This option adds file path information to each test case in the XML output, which Trunk uses to associate test results with source files.
### Report File Path
The `outputFile: './junit.xml'` option specifies the path of the JUnit report. You'll need this path later when configuring automatic uploads to Trunk.
### Disable Retries
You need to disable automatic retries if you previously enabled them. Retries compromise the accurate detection of flaky tests. You should disable retries for accurate detection and use the [Quarantining](../../quarantining/) feature to stop flaky tests from failing your CI jobs.
If you've enabled retries, you can disable them following the [Vitest docs](https://vitest.dev/api/) for more accurate results.
**Note**: Configuration errors can sometimes mask themselves as consistent test failures. If you're seeing file-level test entries instead of individual test cases, resolve configuration issues first before adjusting retry settings. A properly configured test suite should show individual test case names in the JUnit output, not file names.
## Troubleshooting
**Configuration Errors and File-Level Test Failures**
**Issue**: You might see Trunk identifying flaky tests with names that match your test file names (e.g., `auth.test.ts` instead of `should login successfully`) rather than individual test case names.
**Root Cause**: This typically occurs when Vitest encounters configuration errors that prevent it from properly parsing or running the tests in a file. Common scenarios include:
* TypeScript configuration errors in `tsconfig.json`
* Missing dependencies or import resolution failures
* Syntax errors in test setup files
* Invalid Vitest configuration options
**What Happens**: When Vitest cannot execute the individual tests within a file due to configuration issues, it generates a single JUnit test case entry named after the file itself, regardless of how many actual test cases exist in that file.
**How to Diagnose**:
1. Run your tests locally with verbose output: `vitest --reporter=verbose`
2. Check for configuration warnings or errors in the test output
3. Look for test files that show as single entries in your JUnit report when they should contain multiple test cases
**How to Fix**:
1. **Check TypeScript Configuration**: Ensure your `tsconfig.json` is valid and includes all necessary paths
2. **Verify Dependencies**: Make sure all imported modules are properly installed and accessible
3. **Review Setup Files**: Check any test setup files referenced in your Vitest config for errors
4. **Validate Vitest Config**: Make sure your `vitest.config.ts` doesn't contain invalid options
## Try It Locally
### Validate Test Execution First
Before validating your JUnit reports with Trunk, make sure Vitest can properly execute your tests:
```bash theme={null}
# Run tests with detailed output to catch configuration issues
vitest run --reporter=verbose
# Check that individual test cases appear in output, not just file names
vitest run --reporter=json | jq '.testResults[].assertionResults'
```
If you see test files listed as single entries rather than individual test cases, you likely have configuration issues that need to be resolved before proceeding.
You can validate your test reports using the [Trunk Analytics CLI](../../reference/cli-reference). If you don't have it installed already, you can install and run the `validate` command like this:
### The Validate Command
```bash Linux (x64) theme={null}
SKU="trunk-analytics-cli-x86_64-unknown-linux.tar.gz"
curl -fL --retry 3 \
"https://github.com/trunk-io/analytics-cli/releases/latest/download/${SKU}" \
| tar -xz
chmod +x trunk-analytics-cli
./trunk-analytics-cli validate --junit-paths "./junit.xml"
```
```bash Linux (arm64) theme={null}
SKU="trunk-analytics-cli-aarch64-unknown-linux.tar.gz"
curl -fL --retry 3 \
"https://github.com/trunk-io/analytics-cli/releases/latest/download/${SKU}" \
| tar -xz
chmod +x trunk-analytics-cli
./trunk-analytics-cli validate --junit-paths "./junit.xml"
```
```bash macOS (arm64) theme={null}
SKU="trunk-analytics-cli-aarch64-apple-darwin.tar.gz"
curl -fL --retry 3 \
"https://github.com/trunk-io/analytics-cli/releases/latest/download/${SKU}" \
| tar -xz
chmod +x trunk-analytics-cli
./trunk-analytics-cli validate --junit-paths "./junit.xml"
```
```bash macOS (x64) theme={null}
SKU="trunk-analytics-cli-x86_64-apple-darwin.tar.gz"
curl -fL --retry 3 \
"https://github.com/trunk-io/analytics-cli/releases/latest/download/${SKU}" \
| tar -xz
chmod +x trunk-analytics-cli
./trunk-analytics-cli validate --junit-paths "./junit.xml"
```
**This will not upload anything to Trunk**. To improve detection accuracy, you should **address all errors and warnings** before proceeding to the next steps.
### Test Upload
Before modifying your CI jobs to automatically upload test results to Trunk, try uploading a single test run manually.
You make an upload to Trunk using the following command:
```sh theme={null}
curl -fL --retry 3 "https://github.com/trunk-io/analytics-cli/releases/latest/download/trunk-analytics-cli-x86_64-unknown-linux.tar.gz" | tar -xz && chmod +x trunk-analytics-cli
./trunk-analytics-cli upload --junit-paths "./junit.xml" \
--org-url-slug \
--token
```
You can find your Trunk organization slug and token in the settings or by following these [instructions](/flaky-tests/get-started/ci-providers/otherci#id-1.-store-a-trunk_token-secret-in-your-ci-system). After your upload, you can verify that Trunk has received and processed it successfully in the **Uploads** tab. Warnings will be displayed if the report has issues.
![]()
![]() ## Next Step
Configure your CI to upload test runs to Trunk. Find the guides for your CI framework below:
## Next Step
Configure your CI to upload test runs to Trunk. Find the guides for your CI framework below:
# XCTest
Source: https://docs.trunk.io/flaky-tests/get-started/frameworks/xctest
A guide for generating Trunk-compatible test reports for XCode and xcodebuild
You can automatically [detect and manage flaky tests](../../detection/) in your XCTest projects by integrating with Trunk. This document explains how to configure XCTest to output XCResult reports that can be uploaded to Trunk for analysis.
## Setup steps
Work through the steps below in order. Once you've finished the last one, you'll be ready to move on to [configure uploads in CI](../ci-providers/).
Generate a compatible test report} />
Configure the report file path or glob} />
Disable retries for better detection accuracy} />
Test uploads locally} />
## Generating Reports
Running XCTests from `xcodebuild` produces a `.xcresult` in an obscure directory by default. You can specify a `-resultBundlePath` option to generate the results locally:
```sh theme={null}
xcodebuild test -scheme \
-resultBundlePath ./test-results.xcresult
```
You can upload `.xcresult` directories directly to Trunk Flaky Tests.
Only XCode versions 16 or higher are supported.
### Report File Path
The test reports will be written to the `./test-results.xcresult` directory when running tests with the `-resultBundlePath ./test-results.xcresult`option. You will need this path when uploading results to Trunk in CI.
### Disable Retries
You need to disable automatic retries if you previously enabled them. Retries compromise the accurate detection of flaky tests. You should disable retries for accurate detection and use the [Quarantining](../../quarantining/) feature to stop flaky tests from failing your CI jobs.
If you run tests in CI with [the `-retry-tests-on-failure` option](https://keith.github.io/xcode-man-pages/xcodebuild.1.html#retry-tests-on-failure), disable it for more accurate results.
## Try It Locally
Before modifying your CI jobs to automatically upload test results to Trunk, try uploading a single test run manually.
You make an upload to Trunk using the following command:
```bash Linux (x64) theme={null}
SKU="trunk-analytics-cli-x86_64-unknown-linux.tar.gz"
curl -fL --retry 3 \
"https://github.com/trunk-io/analytics-cli/releases/latest/download/${SKU}" \
| tar -xz
chmod +x trunk-analytics-cli
./trunk-analytics-cli upload --xcresult-path "./test-results.xcresult" \
--org-url-slug \
--token
```
```bash Linux (arm64) theme={null}
SKU="trunk-analytics-cli-aarch64-unknown-linux.tar.gz"
curl -fL --retry 3 \
"https://github.com/trunk-io/analytics-cli/releases/latest/download/${SKU}" \
| tar -xz
chmod +x trunk-analytics-cli
./trunk-analytics-cli upload --xcresult-path "./test-results.xcresult" \
--org-url-slug \
--token
```
```bash macOS (arm64) theme={null}
SKU="trunk-analytics-cli-aarch64-apple-darwin.tar.gz"
curl -fL --retry 3 \
"https://github.com/trunk-io/analytics-cli/releases/latest/download/${SKU}" \
| tar -xz
chmod +x trunk-analytics-cli
./trunk-analytics-cli upload --xcresult-path "./test-results.xcresult" \
--org-url-slug \
--token
```
```bash macOS (x64) theme={null}
SKU="trunk-analytics-cli-x86_64-apple-darwin.tar.gz"
curl -fL --retry 3 \
"https://github.com/trunk-io/analytics-cli/releases/latest/download/${SKU}" \
| tar -xz
chmod +x trunk-analytics-cli
./trunk-analytics-cli upload --xcresult-path "./test-results.xcresult" \
--org-url-slug \
--token
```
You can find your Trunk organization slug and token in the settings or by following these [instructions](/flaky-tests/get-started/ci-providers/otherci#id-1.-store-a-trunk_token-secret-in-your-ci-system). After your upload, you can verify that Trunk has received and processed it successfully in the **Uploads** tab. Warnings will be displayed if the report has issues.
![]()
![]() ## Next Step
Configure your CI to upload test runs to Trunk. Find the guides for your CI framework below:
## Next Step
Configure your CI to upload test runs to Trunk. Find the guides for your CI framework below:
# Getting Started
Source: https://docs.trunk.io/flaky-tests/get-started/index
Set up Trunk Flaky Tests by configuring test result output, uploading from CI, and enabling flake detection monitors.
Trunk Flaky Tests detects flaky tests by analyzing test results from your CI runs. Setup requires configuring test result output and CI upload integration.
## Prerequisites
* Account at [app.trunk.io](https://app.trunk.io)
* Ability to modify repository CI configuration and add secrets
* Tests running in CI on both PRs and stable branches (e.g., main, master, or develop)
### Step 1: Ensure JUnit XML output
Trunk ingests test results in JUnit XML format. If your CI already generates JUnit XML, note the file paths and skip to Step 2.
If not, configure your test frameworks to output JUnit XML:
* See [**Test Frameworks**](./frameworks/) for framework-specific configuration
* Supports multiple frameworks simultaneously
### Step 2: Configure CI uploads
Add test result uploads to all CI jobs that run tests.
1. See [**CI Providers**](./ci-providers/) for integration instructions
2. Configure uploads in jobs that run on:
* Pull request branches
* Stable branches (`main`, `master`, `develop`, etc.)
* Merge queue branches (if applicable)
Uploads from both PRs and stable branches are required for Trunk Flaky Tests to accurately detect flaky tests.
Trunk automatically recognizes `main`, `master`, and `develop` as stable branches. If your primary branch uses a different name, configure uploads from that branch the same way and Trunk will classify it correctly.
### Step 3: Verify integration
1. Push your changes and trigger a CI run
2. Check CI logs for successful upload confirmation
3. Results typically appear within a few minutes. Verify uploads appear at [app.trunk.io](https://app.trunk.io) → your repo → **Flaky Tests** → **Uploads**
![]()
![]() ### Step 4: Configure flake detection
After uploads are flowing, navigate to your repo → **Flaky Tests** → **Monitors** to set up detection.
**Pass-on-retry** is enabled by default and is the recommended baseline for everyone. It catches the most common flakiness pattern — a test that fails and then passes on retry within the same commit — without any configuration needed.
**Failure rate monitors** let you detect flakiness based on failure rate over a rolling time window. How you configure them depends on your CI setup:
* **If tests must pass before merging to main**, set up a failure rate monitor scoped to `main` to catch an elevated failure rate. For example, if you run tests 5 times per day on `main`, a 24-hour rolling window with a minimum of 4 runs and a failure threshold of 25% is a reasonable starting point. This gives the monitor enough data before flagging anything.
* **If you use a merge queue**, consider a dedicated monitor scoped to your merge queue branches (e.g., `trunk-merge/*` or `gh-readonly-queue/*`). Failures here are especially suspicious since the code has already passed PR checks, so a low threshold is appropriate.
[How failure rate monitors work →](../detection/failure-rate-monitor)
### Quarantining
Quarantining suppresses failures from known flaky tests, preventing them from forcing CI re-runs or blocking your merge queue. Flaky tests continue to run and report results — they just don't cause pipeline failures while your team works on fixes. This is especially valuable for unblocking merge queues and keeping development velocity high.
[Configure Quarantining →](../quarantining/)
# Multiple Repositories and Forks
Source: https://docs.trunk.io/flaky-tests/get-started/multiple-repositories
Learn how Trunk identifies repositories, track tests across forks and multiple repositories, and enable test uploads from fork PR workflows.
Trunk Flaky Tests identifies repositories by their **git remote URL**, not by the API token. You can safely use the same organization API token across multiple repositories, including forks, without mixing test results.
## How Repository Identification Works
When the Trunk Analytics CLI uploads test results, it reads the git remote URL from your CI environment and parses it into three components:
* **Host**: `github.com`, `gitlab.com`, or your self-hosted instance
* **Owner**: The organization or user (e.g., `your-company`)
* **Name**: The repository name (e.g., `your-repo`)
These three components together uniquely identify the repository in Trunk. The API token determines which *organization* the upload belongs to, but does not affect which *repository* the results are associated with.
### Uploading from Fork Pull Requests
Fork pull requests can't upload with your org API token. GitHub Actions workflows triggered by `pull_request` events from a fork run with read-only permissions and can't read repository secrets, so `$TRUNK_API_TOKEN` isn't available. Trunk solves this with a per-repo opt-in that mints a non-secret **public repo identifier** the fork workflow uses instead.
### Step 4: Configure flake detection
After uploads are flowing, navigate to your repo → **Flaky Tests** → **Monitors** to set up detection.
**Pass-on-retry** is enabled by default and is the recommended baseline for everyone. It catches the most common flakiness pattern — a test that fails and then passes on retry within the same commit — without any configuration needed.
**Failure rate monitors** let you detect flakiness based on failure rate over a rolling time window. How you configure them depends on your CI setup:
* **If tests must pass before merging to main**, set up a failure rate monitor scoped to `main` to catch an elevated failure rate. For example, if you run tests 5 times per day on `main`, a 24-hour rolling window with a minimum of 4 runs and a failure threshold of 25% is a reasonable starting point. This gives the monitor enough data before flagging anything.
* **If you use a merge queue**, consider a dedicated monitor scoped to your merge queue branches (e.g., `trunk-merge/*` or `gh-readonly-queue/*`). Failures here are especially suspicious since the code has already passed PR checks, so a low threshold is appropriate.
[How failure rate monitors work →](../detection/failure-rate-monitor)
### Quarantining
Quarantining suppresses failures from known flaky tests, preventing them from forcing CI re-runs or blocking your merge queue. Flaky tests continue to run and report results — they just don't cause pipeline failures while your team works on fixes. This is especially valuable for unblocking merge queues and keeping development velocity high.
[Configure Quarantining →](../quarantining/)
# Multiple Repositories and Forks
Source: https://docs.trunk.io/flaky-tests/get-started/multiple-repositories
Learn how Trunk identifies repositories, track tests across forks and multiple repositories, and enable test uploads from fork PR workflows.
Trunk Flaky Tests identifies repositories by their **git remote URL**, not by the API token. You can safely use the same organization API token across multiple repositories, including forks, without mixing test results.
## How Repository Identification Works
When the Trunk Analytics CLI uploads test results, it reads the git remote URL from your CI environment and parses it into three components:
* **Host**: `github.com`, `gitlab.com`, or your self-hosted instance
* **Owner**: The organization or user (e.g., `your-company`)
* **Name**: The repository name (e.g., `your-repo`)
These three components together uniquely identify the repository in Trunk. The API token determines which *organization* the upload belongs to, but does not affect which *repository* the results are associated with.
### Uploading from Fork Pull Requests
Fork pull requests can't upload with your org API token. GitHub Actions workflows triggered by `pull_request` events from a fork run with read-only permissions and can't read repository secrets, so `$TRUNK_API_TOKEN` isn't available. Trunk solves this with a per-repo opt-in that mints a non-secret **public repo identifier** the fork workflow uses instead.
This is intended for public repositories that accept external contributions. For private repositories or internal forks, keep using the standard `$TRUNK_API_TOKEN` approach.
**Enable fork PR uploads.** In the Trunk web app, navigate to **Settings** → **Repositories** → **\[your repo]** → **Flaky Tests** and toggle on **Fork PR Uploads**. Copy the **Public Repo Identifier** that appears below the toggle — an 8-character alphanumeric code scoped to that one repository.
![The Fork PR Uploads setting in a repository's Flaky Tests settings, showing the enabled toggle and the public repo identifier]() The identifier persists across toggles. Disabling stops accepting fork PR uploads, but re-enabling reuses the same identifier rather than generating a new one.
**Use the identifier in your fork workflow.** Pass it in place of the org API token. With the Trunk uploader action, set the `public-repo-id` input:
```yaml theme={null}
jobs:
test:
runs-on: ubuntu-latest
steps:
- name: Run Tests
run: ...
- name: Upload Test Results to Trunk.io
if: ${{ !cancelled() }}
continue-on-error: true
uses: trunk-io/analytics-uploader@v2
with:
junit-paths: "**/junit.xml"
org-slug: ${{ vars.TRUNK_ORG_SLUG }}
public-repo-id:
The identifier persists across toggles. Disabling stops accepting fork PR uploads, but re-enabling reuses the same identifier rather than generating a new one.
**Use the identifier in your fork workflow.** Pass it in place of the org API token. With the Trunk uploader action, set the `public-repo-id` input:
```yaml theme={null}
jobs:
test:
runs-on: ubuntu-latest
steps:
- name: Run Tests
run: ...
- name: Upload Test Results to Trunk.io
if: ${{ !cancelled() }}
continue-on-error: true
uses: trunk-io/analytics-uploader@v2
with:
junit-paths: "**/junit.xml"
org-slug: ${{ vars.TRUNK_ORG_SLUG }}
public-repo-id:
```
If you call the CLI directly instead of the action, pass `--public-repo-id ` (or set the `TRUNK_PUBLIC_REPO_ID` environment variable). Either way the CLI sends the value on the `X-Trunk-Public-Repo-Id` header.
The public repo identifier is not a secret. It is safe to commit directly in your workflow file. Do not use your org API token in fork PR workflows.
**How authorization works.** The identifier is a routing and rate-limiting key, not a credential. Trunk accepts a fork PR upload only when two independent checks both pass:
1. The repository has **Fork PR Uploads** enabled in settings.
2. The upload targets the repository the identifier belongs to. An identifier only authorizes uploads to its own repository; an upload aimed at any other repository is rejected.
The identifier alone does not grant upload access. To stop accepting fork PR uploads, disable **Fork PR Uploads** in settings.
### Using Trunk with Forks
If you run tests from a fork, Trunk automatically keeps test results separate based on the fork's remote URL.
For example, if your company forks `metabase/metabase` to `your-company/metabase-fork`:
| Repository | Remote URL | Trunk Repo ID |
| ---------- | --------------------------------------- | ---------------------------- |
| Original | `github.com/metabase/metabase` | `metabase/metabase` |
| Your fork | `github.com/your-company/metabase-fork` | `your-company/metabase-fork` |
You can use the same organization API token for both repositories. Trunk creates separate repo entries and keeps all test data isolated.
No special configuration is needed for forks. As long as your fork has a different remote URL (which it does by default), Trunk keeps the data separate automatically.
## Verifying Your Remote URL
Before setting up uploads, verify your CI job is using the correct remote URL:
```bash theme={null}
git remote -v
# origin git@github.com:your-company/metabase-fork.git (fetch)
# origin git@github.com:your-company/metabase-fork.git (push)
```
Some CI providers set environment variables like `GITHUB_REPOSITORY` that may differ from your git remote. The CLI reads the git remote URL by default. If your CI environment modifies the remote, use the `--repo-url` flag to override repository detection.
## Overriding Repository Detection
In some CI environments, you may need to manually specify the repository URL:
* The git remote is not available or is incorrect
* You are uploading results from a build artifact without a git checkout
* A shallow clone has modified remotes
Override the repository URL with the `--repo-url` flag:
```bash theme={null}
./trunk-analytics-cli upload \
--junit-paths "test_output.xml" \
--org-url-slug \
--token $TRUNK_API_TOKEN \
--repo-url "https://github.com/your-company/your-repo.git"
```
You can also set the repository URL via the `TRUNK_REPO_URL` environment variable:
```bash theme={null}
export TRUNK_REPO_URL="https://github.com/your-company/your-repo.git"
./trunk-analytics-cli upload \
--junit-paths "test_output.xml" \
--org-url-slug \
--token $TRUNK_API_TOKEN
```
See the [Trunk Analytics CLI](/flaky-tests/reference/cli-reference) reference for the full list of override flags.
## Monorepo with Multiple Test Suites
To track different test suites within the same repository separately, use the `--variant` flag:
```bash theme={null}
# Frontend tests
./trunk-analytics-cli upload \
--junit-paths "frontend/test_output.xml" \
--variant "frontend" \
--org-url-slug \
--token $TRUNK_API_TOKEN
# Backend tests
./trunk-analytics-cli upload \
--junit-paths "backend/test_output.xml" \
--variant "backend" \
--org-url-slug \
--token $TRUNK_API_TOKEN
```
## Troubleshooting
### Test results appearing in wrong repository
1. **Check your git remote**: Run `git remote -v` in your CI job to verify the URL.
2. **Check CI environment variables**: Some CI providers override git configuration.
3. **Use explicit override**: Set `--repo-url` to force the correct repository.
### Duplicate repositories in dashboard
This can happen if the same repository is uploaded with different URL formats (e.g., HTTPS vs SSH). To resolve:
1. Standardize the remote URL format across all CI jobs.
2. Use `--repo-url` to set a consistent URL.
3. Contact [support@trunk.io](mailto:support@trunk.io) to merge duplicate repository entries.
## FAQ
| Question | Answer |
| ------------------------------------------------ | ------------------------------------------------------------------- |
| Can I use the same API token for multiple repos? | Yes. The token is org-scoped, not repo-scoped. |
| Will fork test results mix with upstream? | No. Repos are identified by remote URL, not by token. |
| Do I need separate tokens for forks? | No. The same token works for all repos in your organization. |
| Can I override the detected repository? | Yes. Use `--repo-url` or the `TRUNK_REPO_URL` environment variable. |
# Pull request comments
Source: https://docs.trunk.io/flaky-tests/management/github-pull-request-comments
Flaky Tests provides summary analytics about tests running on Pull Requests
Flaky Tests can post comments on GitHub pull requests that summarize test results across CI jobs. These comments indicate which failures are flaky and include the test’s failure history and related context.
**Note:** Flaky Tests will only post a comment when there are failing tests.
![]()
![]() Each GitHub comment includes a summary report showing all tests that passed, failed, flaked, were skipped, or were quarantined on the PR.
Each GitHub comment includes a summary report showing all tests that passed, failed, flaked, were skipped, or were quarantined on the PR.
![]()
![]() Each test case includes the full stack trace when expanded, and the job run link takes you to the complete CI logs.
## Configuration
Install the [Trunk GitHub App](../../setup-and-administration/github-app-permissions) and [upload JUnit XML](../get-started/frameworks/) test results on pull requests. Once both are in place, expect to start seeing comments on your pull requests soon.
## Disable commenting
Pull Request comments are enabled by default. If you wish to disable the comments, you can do so by navigating to **Settings** → **Repositories** → **\[your repository]** → **Flaky Tests** and toggling the **Summary Flaky Tests Reports** setting.
## Troubleshooting
At any point, feel free to reach out to our team at [support@trunk.io](mailto:support@trunk.io).
# Flaky test management
Source: https://docs.trunk.io/flaky-tests/management/index
Organize, triage, and coordinate follow-up for detected flaky tests.
Each test case includes the full stack trace when expanded, and the job run link takes you to the complete CI logs.
## Configuration
Install the [Trunk GitHub App](../../setup-and-administration/github-app-permissions) and [upload JUnit XML](../get-started/frameworks/) test results on pull requests. Once both are in place, expect to start seeing comments on your pull requests soon.
## Disable commenting
Pull Request comments are enabled by default. If you wish to disable the comments, you can do so by navigating to **Settings** → **Repositories** → **\[your repository]** → **Flaky Tests** and toggling the **Summary Flaky Tests Reports** setting.
## Troubleshooting
At any point, feel free to reach out to our team at [support@trunk.io](mailto:support@trunk.io).
# Flaky test management
Source: https://docs.trunk.io/flaky-tests/management/index
Organize, triage, and coordinate follow-up for detected flaky tests.
# Managing detected flaky tests
Source: https://docs.trunk.io/flaky-tests/management/managing-detected-flaky-tests
A step-by-step guide for building an automated process to manage detected flaky tests.
It is important to have a follow-up process in place to manage detected flaky tests. A good process makes sure flaky tests do not slow down CI for your development team and prevents flakes from accumulating over time.
This guide walks through Trunk's recommended best practices for building a process around detected flaky tests in your organization.
Flaky tests will be [automatically detected](../detection/) by Trunk after you:
* [Set up your test framework](../get-started/frameworks/) to produce test reports
* [Integrated with your CI provider](../get-started/ci-providers/) to upload those reports on CI runs.
Go through these guides first to start detecting flaky tests.
## Prerequisites
* A Trunk organization with Flaky Tests enabled and at least one repo connected
* Your [test framework set up to produce test reports](../get-started/frameworks/) and your [CI provider uploading those reports](../get-started/ci-providers/)
* Member access to the Trunk app to view and edit tests; Admin access if you also need to configure ticketing or webhook integrations
### Step 1: Organize tests with labels
Test labels let you categorize and group related flaky tests within Trunk. Labels are useful for tracking tests by team, component, root cause, or any grouping that fits your workflow.
To assign or remove labels on a test:
1. Open the test detail page in the Trunk app.
2. In the **Metadata** section at the top of the page, click the **Labels** field.
3. Select labels from the picker or type to create new ones. Remove labels by clicking the **x** on any applied label.
Labels you apply are visible on the test detail page. Use them to filter and prioritize your backlog of flaky tests.
### Step 2: Create tickets for flaky tests
Creating Linear or Jira tickets for detected flaky tests helps to integrate flaky test fixes into your existing workflows.
* Start by [connecting to Linear or Jira](./ticketing/). You can also set default labels or teams for flaky test tickets.
* Once connected, you can click **Create Ticket** on a test detail page in Trunk. Trunk will create the ticket with context, including the test ID, flake rate, and the last failure stack trace and reason.
* The ticket status and assignee will be visible on the test details page in Trunk, and these details will stay in sync with changes to the ticket.
### Step 3: Broadcast flakes
It is important to keep the team informed on all status changes for flaky tests . This allows for fast follow-up when a test is marked as flaky.
* Use the [built-in Slack or Microsoft Teams webhook integrations](../webhooks/) to transform webhook payloads into messages.
* Trunk's built-in templates help you get started and test the connection.
* You can then customize the transformation to update the message format and content, including @-mentioning test owners so they can follow up right away.
### Step 4: Mute monitors
If a flaky test has a known issue or a fix in progress, you can mute the monitor that flagged it. A muted monitor continues to run and record detections, but it does not contribute to the test's flaky status until the mute expires or is manually removed.
To mute a monitor:
1. Navigate to the test case detail page in the Trunk app.
2. Find the monitor that flagged the test.
3. Click **Mute** and select a duration.
| Duration | Description |
| -------- | ---------------------------------------- |
| 1 hour | Quick suppression for transient issues |
| 4 hours | Short-term suppression |
| 24 hours | Suppress for a full day |
| 7 days | Suppress for a week |
| 30 days | Suppress for a month |
| Forever | Mute indefinitely until manually unmuted |
The **Forever** option mutes the monitor with no expiration. The monitor stays muted until you explicitly unmute it from the test case detail page. This is useful when a test has a known flake that your team has accepted, or when a fix is planned but not yet scheduled.
For timed durations, the monitor automatically unmutes when the period expires. If the monitor is still detecting flaky behavior at that point, the test will be flagged as flaky again.
You can optionally provide a reason when muting a monitor. This helps your team understand why the monitor was muted and makes it easier to review muted monitors later.
You can unmute a monitor at any time from the test case detail page, regardless of the selected duration.
Muting suppresses the monitor's contribution to the test's status. If the muted monitor was the only active monitor for a test, the test transitions from flaky to healthy for the duration of the mute.
### Step 5: Flag flaky tests
If automated detection hasn't caught a test you know is flaky, you can manually [flag it as flaky](../detection/flag-as-flaky) from the test detail page. Flagged tests are treated as flaky even when no monitor detects them, and the flag can be removed at any time. Note that active broken monitors will take precedence over the manual flaky flag.
### Step 6: Quarantine flaky tests
Flaky tests slow down CI and have a high negative impact on merge queue throughput. You can minimize or eliminate this CI slowdown by [quarantining](../quarantining/) flaky tests at runtime.
* Enable quarantining for your repo at **Settings** → **\[your repo]** → **Enable Test Quarantining**.
* Manually quarantine flaky tests by going to the test details page, clicking **Quarantine**, and setting the status to **Always**. Leave a comment detailing why you are quarantining this test to keep your team informed. The comment and quarantine status change will appear in the timeline on the test details page.
After quarantining a test, Trunk will ignore the test result (pass/fail) on CI runs, preventing this flaky test from failing CI.
**Broken tests are not quarantine candidates.** Only tests with a **Flaky** status are eligible for quarantine. If a test is marked as Broken (consistently failing at a high rate), it represents a real regression that should be investigated and fixed rather than hidden. See [detection](../detection/) to understand the difference between flaky and broken tests.
### Step 7: Automation
Trunk has [webhooks](../webhooks/) and [Flaky Tests APIs](../reference/api-reference) that can be used to build custom workflows around ticket creation, linking existing tickets to Trunk, sending notifications, and dealing with quarantined tests.
There is also built-in automation support that handles tasks such as assigning flaky test ownership, ticket creation, and quarantining (so that unblocking CI is not a manual process).
* [`CODEOWNERS` files](../dashboard#code-owners) can automatically assign ownership of test flakes.
* Tickets can be [auto-created using webhooks](../webhooks/) as triggers, similar to Slack or MS Teams notifications.
* Automatically quarantine flaky tests by enabling **Settings** → **\[your repo]** → **Auto-Quarantine Flaky Tests**.
You can customize how flaky and quarantined tests are handled to suit your team and organization best.
### Step 8: Review existing flakes and broken tests
It is important to track and triage existing flaky and broken tests over time. Trunk collects historical failure logs and stack traces, providing developers as much information as possible for debugging high-impact test failures.
* Review all new flaky and broken tests to determine their impact and the urgency of a fix. Broken tests (consistently failing at a high rate) should typically be prioritized over flaky tests as they represent real regressions.
* Review existing quarantined tests regularly to decide which tests should be fixed and which tests should be deleted from your test suite.
* Trunk can send weekly email reports with information such as your total number of flaky tests and the number of PRs blocked, and how those numbers have changed week over week. Frequently failing tests will also be highlighted in the report. Contact [support@trunk.io](mailto:support@trunk.io) to ask about enabling weekly reports for your organization.
## In summary: Build a process around managing flaky tests
Building processes for dealing with flaky tests helps decrease or eliminate their impact on CI and reduce the amount of developer time lost to debugging flakes and CI reruns.
Trunk allows you to customize this process to fit into your existing tooling and workflows, and automates manual tasks such as notifications and ticket creation.
Contact [support@trunk.io](mailto:support@trunk.io) to chat about how to structure a process for managing flaky tests across your team or organization.
# Test Labels
Source: https://docs.trunk.io/flaky-tests/management/test-labels
Organize and categorize test cases with organization-scoped labels.
Test labels are organization-scoped tags you can apply to individual test cases to organize, filter, and categorize your test suite. Labels can be applied [manually from the test detail page](#apply-and-remove-labels-on-a-test-case) or [automatically by a monitor](#automatic-labeling-from-monitors).
![Labels applied to a test on details page]()
![Labels applied to a test on details page]() ## Manage labels
Labels are created, edited, and deleted at **Settings** → **Organization** → **Test Labels**. Each label has a name, an optional description, and a color used for its chip in the UI. The settings page also shows how many test cases each label is currently applied to. Any organization member can create, edit, assign, and unassign labels.
## Manage labels
Labels are created, edited, and deleted at **Settings** → **Organization** → **Test Labels**. Each label has a name, an optional description, and a color used for its chip in the UI. The settings page also shows how many test cases each label is currently applied to. Any organization member can create, edit, assign, and unassign labels.
Only organization admins can delete labels — the Delete option in each label's menu is disabled for non-admins. Deleting a label removes it from every test case it's applied to; this cannot be undone. A label that is referenced by a monitor's [label action](#automatic-labeling-from-monitors) cannot be deleted — the settings page lists the monitors that still reference it so you can clear those references first.
![Settings page to manage test labels]() ## Apply and remove labels on a test case
You apply and remove labels from a test case using the label picker on the test case detail page. The picker lets you search existing labels, toggle them on or off, and create a new label inline if one doesn't already exist. Each assignment records who applied the label and when.
## Apply and remove labels on a test case
You apply and remove labels from a test case using the label picker on the test case detail page. The picker lets you search existing labels, toggle them on or off, and create a new label inline if one doesn't already exist. Each assignment records who applied the label and when.
![Label picker on test details page]() ## Filter tests by label
On the tests list, you can filter the table down to test cases that have a particular label applied. This makes labels useful for slicing the view by the categories your team cares about.
## Filter tests by label
On the tests list, you can filter the table down to test cases that have a particular label applied. This makes labels useful for slicing the view by the categories your team cares about.
![Filter tests to those that have specified label applied]() ## Automatic labeling from monitors
The [pass-on-retry](../detection/pass-on-retry-monitor), [failure rate](../detection/failure-rate-monitor), and [failure count](../detection/failure-count-monitor) monitors can be configured to apply one or more labels to a test instead of classifying it as flaky or broken. Use this when you want a monitor to surface a pattern (for example, *fails on retry on PR branches*) for triage or filtering without changing the test's health status. The same setup also works as a [dry-run](../detection/#dry-running-with-labels) while you tune a new monitor before flipping it to classify.
### Choose the monitor's action
When you create or edit one of these monitors, the **Action** section asks what happens when the monitor activates:
* **Classify test status** (the default) — marks the test as flaky or broken while the monitor is active, and restores the test to healthy when the monitor resolves. This is the original behavior.
* **Apply labels** — adds the configured labels to the test while the monitor is active. The test's health status is not changed by this monitor.
A monitor uses one action or the other, not both.
### Configure the label action
After selecting **Apply labels**, pick one or more labels from your organization's label set. You can create a new label inline if the one you need doesn't exist yet — the new label is added to the org-wide set in [**Settings** → **Organization** → **Test Labels**](#manage-labels).
By default, the labels are removed when the monitor resolves. Turn off **Remove these labels when the monitor resolves** to keep them on the test after the monitor stops reporting.
### How monitor-applied labels appear
Monitor-applied labels show up in the same places as manually applied labels: as chips on the [tests list](#filter-tests-by-label) and on the test detail page. Hovering a label tells you whether a user, one or more monitors, or a combination applied it, along with when it was first applied.
When the same label is applied to a test by multiple sources (for example, by a user and by a monitor, or by two different monitors), the label stays on the test until every source removes it. Removing the source (such as disabling the monitor or switching its action away from **Apply labels**) clears that source's contribution on the next evaluation.
## Related
* [Managing detected flaky tests](./managing-detected-flaky-tests) — a step-by-step process for handling detected flaky tests
* [Flake Detection](../detection/) — monitors that watch for problematic test behavior
# Asana integration
Source: https://docs.trunk.io/flaky-tests/management/ticketing/asana-integration
Triage your flaky tests faster by creating automatically assigned and labeled tasks with the Asana integration
When Trunk Flaky Tests [detects a flaky test](../../detection/index), you can create an automatically generated Asana task for your team to pick up and fix the test.
Asana tasks are created in a single project that you choose during setup. Throughout this page, "ticket" and "task" mean the same thing — Trunk calls it a ticket, Asana calls it a task.
## Connecting to Asana
To connect an Asana project:
1. In the Trunk app, navigate to **Settings** → **Repositories** → **\[your repository]** → **Ticketing**.
2. Click **Connect** on the **Asana** row.
3. Add an [Asana personal access token](#personal-access-token) and click **Connect**.
4. In the **Configuration** section that appears, select a **Workspace**, then select a **Project**, and click **Update**.
Connecting happens in two steps because Trunk cannot list your workspaces until the token works. Until you save the token, the form shows only the **Asana Connection** section — the **Configuration** section, with its **Workspace** and **Project** dropdowns, appears once the token is accepted. The integration is not usable until you have selected both.
A fully connected integration shows all three sections:
## Automatic labeling from monitors
The [pass-on-retry](../detection/pass-on-retry-monitor), [failure rate](../detection/failure-rate-monitor), and [failure count](../detection/failure-count-monitor) monitors can be configured to apply one or more labels to a test instead of classifying it as flaky or broken. Use this when you want a monitor to surface a pattern (for example, *fails on retry on PR branches*) for triage or filtering without changing the test's health status. The same setup also works as a [dry-run](../detection/#dry-running-with-labels) while you tune a new monitor before flipping it to classify.
### Choose the monitor's action
When you create or edit one of these monitors, the **Action** section asks what happens when the monitor activates:
* **Classify test status** (the default) — marks the test as flaky or broken while the monitor is active, and restores the test to healthy when the monitor resolves. This is the original behavior.
* **Apply labels** — adds the configured labels to the test while the monitor is active. The test's health status is not changed by this monitor.
A monitor uses one action or the other, not both.
### Configure the label action
After selecting **Apply labels**, pick one or more labels from your organization's label set. You can create a new label inline if the one you need doesn't exist yet — the new label is added to the org-wide set in [**Settings** → **Organization** → **Test Labels**](#manage-labels).
By default, the labels are removed when the monitor resolves. Turn off **Remove these labels when the monitor resolves** to keep them on the test after the monitor stops reporting.
### How monitor-applied labels appear
Monitor-applied labels show up in the same places as manually applied labels: as chips on the [tests list](#filter-tests-by-label) and on the test detail page. Hovering a label tells you whether a user, one or more monitors, or a combination applied it, along with when it was first applied.
When the same label is applied to a test by multiple sources (for example, by a user and by a monitor, or by two different monitors), the label stays on the test until every source removes it. Removing the source (such as disabling the monitor or switching its action away from **Apply labels**) clears that source's contribution on the next evaluation.
## Related
* [Managing detected flaky tests](./managing-detected-flaky-tests) — a step-by-step process for handling detected flaky tests
* [Flake Detection](../detection/) — monitors that watch for problematic test behavior
# Asana integration
Source: https://docs.trunk.io/flaky-tests/management/ticketing/asana-integration
Triage your flaky tests faster by creating automatically assigned and labeled tasks with the Asana integration
When Trunk Flaky Tests [detects a flaky test](../../detection/index), you can create an automatically generated Asana task for your team to pick up and fix the test.
Asana tasks are created in a single project that you choose during setup. Throughout this page, "ticket" and "task" mean the same thing — Trunk calls it a ticket, Asana calls it a task.
## Connecting to Asana
To connect an Asana project:
1. In the Trunk app, navigate to **Settings** → **Repositories** → **\[your repository]** → **Ticketing**.
2. Click **Connect** on the **Asana** row.
3. Add an [Asana personal access token](#personal-access-token) and click **Connect**.
4. In the **Configuration** section that appears, select a **Workspace**, then select a **Project**, and click **Update**.
Connecting happens in two steps because Trunk cannot list your workspaces until the token works. Until you save the token, the form shows only the **Asana Connection** section — the **Configuration** section, with its **Workspace** and **Project** dropdowns, appears once the token is accepted. The integration is not usable until you have selected both.
A fully connected integration shows all three sections:
![]()
![]() ### Personal access token
Create a personal access token from your [Asana developer console](https://app.asana.com/0/my-apps).
Asana personal access tokens have no granular scopes — a token acts as the person who created it, with that person's permissions. The token must belong to someone who can see the workspace and project you want to file tickets in, and who can create tasks there.
### Personal access token
Create a personal access token from your [Asana developer console](https://app.asana.com/0/my-apps).
Asana personal access tokens have no granular scopes — a token acts as the person who created it, with that person's permissions. The token must belong to someone who can see the workspace and project you want to file tickets in, and who can create tasks there.
Tickets are created and updated by the token's owner, so that person appears as the author of every automated ticket and comment. Use a service account if you would rather the activity not be attributed to an individual.
## Statuses are project sections
Asana has no workflow states. Trunk uses your project's **sections** — the columns on a board, such as `To do`, `In progress`, and `Done` — as the ticket status. A ticket's status is whichever section it sits in.
Asana tracks completion separately from sections: a task has a **Completed** checkbox that is independent of which column it is in. Trunk treats a ticket as closed only when **both** are true:
* the task is marked complete, **and**
* the task sits in the section you configured as the close target.
This matches exactly what Trunk does when it closes a ticket itself, so a ticket that Trunk closed always reads as closed. It also means a task somebody ticks complete while leaving it in another column is not treated as closed, and neither is a card dragged to the close column without being completed.
Because Asana sections carry no built-in meaning, Trunk cannot tell which of your columns represents "done". Both the close and reopen dropdowns list every section in the project, and you choose. A column named `Shipped` or `Released` works exactly as well as one named `Done`.
## Ticket automation
Once the integration is fully configured, you can enable [automatic ticketing](./automatic-ticketing) from the same settings page: Trunk will create Asana tasks when tests become flaky or broken, reopen them on regression, and close them when tests return to healthy.
When Trunk closes a ticket, it marks the task complete and moves it to your configured close section. When it reopens one, it clears the completed flag and moves the task to your configured reopen section.
## Create a new ticket
You can create a new ticket for any test listed in Flaky Tests.
There are 2 ways to create a new ticket in the Flaky Tests dashboard:
* Click on the options menu for any test case on the repo overview dashboard
![]()
![]() * Use the Create ticket button in the top left corner of the [test case details](../../dashboard#test-case-details) page.
Before you create the ticket, you get a preview of the title and description.
* Use the Create ticket button in the top left corner of the [test case details](../../dashboard#test-case-details) page.
Before you create the ticket, you get a preview of the title and description.
![]()
![]() ### Create with Asana
If you are connected to Asana, you can click the **Create Asana Ticket** button at the end of the modal to create a task in the configured project with any field defaults you have set.
## Field defaults
After selecting a project, you can configure default values that pre-populate whenever a new Asana task is created from Flaky Tests. The available fields are your project's **custom fields**.
Trunk supports these Asana custom field types:
| Asana field type | Behavior |
| ----------------- | -------------------------------- |
| **Single-select** | Choose one option as the default |
| **Multi-select** | Choose one or more options |
| **Text** | Free text |
| **Number** | Numeric value |
| **People** | Choose one or more people |
Date and reference fields are not supported and do not appear in the list. Formula and custom-ID fields are also omitted — Asana calculates those and rejects any attempt to write them.
### Create with Asana
If you are connected to Asana, you can click the **Create Asana Ticket** button at the end of the modal to create a task in the configured project with any field defaults you have set.
## Field defaults
After selecting a project, you can configure default values that pre-populate whenever a new Asana task is created from Flaky Tests. The available fields are your project's **custom fields**.
Trunk supports these Asana custom field types:
| Asana field type | Behavior |
| ----------------- | -------------------------------- |
| **Single-select** | Choose one option as the default |
| **Multi-select** | Choose one or more options |
| **Text** | Free text |
| **Number** | Numeric value |
| **People** | Choose one or more people |
Date and reference fields are not supported and do not appear in the list. Formula and custom-ID fields are also omitted — Asana calculates those and rejects any attempt to write them.
Custom fields belong to a project, so changing the selected **Project** clears every configured default. Choose the project first, then set defaults.
Field defaults are saved per repository. When you open the **Create Ticket** modal, all configured defaults are pre-filled and can be overridden before submitting.
### Requiring fields at ticket creation
For each field, you can check **Require user to fill at creation** instead of setting a default value. When this option is on, the field appears in the **Create Ticket** modal as a required input, and the create button stays disabled until the user fills every required field.
This is useful for fields whose right value depends on the specific test being triaged and should not be pre-set globally.
Automatic ticketing cannot answer a create-time prompt. If you turn on auto-create, every required field needs a default, and Trunk blocks the save until they have one.
## Link existing tickets to tests
If you already have an Asana task for a test, you can link it directly from the Test Details page without creating a new one.
**From the UI:**
1. Open the test case details page.
2. Click **Link Ticket** in the top-left corner.
3. Enter the Asana task ID and click **Link Ticket**.
The task ID is the long number in the task's URL. For `https://app.asana.com/1/12345/project/67890/task/1217199000848901`, the task ID is `1217199000848901`.
The task must be in the project you configured. Linking a task from a different project is rejected, because Trunk reads its status from that project's sections and would have no status to show.
**Via API:**
You can also link tickets programmatically using the [Link Ticket to Test Case API](../../reference/api-reference#post-flaky-tests-link-ticket-to-test-case).
## How linked tickets appear
On the test case details page, a linked Asana ticket shows as **Ticket** with its current status and assignee, linking out to the task in Asana.
Asana has no short human-readable key like Jira's `TRUNK-123`, and the generated task name (`[Flaky Test] `) is too long to display, so Trunk shows a generic label rather than a truncated title.
# Automatic ticketing
Source: https://docs.trunk.io/flaky-tests/management/ticketing/automatic-ticketing
Automatically create, reopen, and close tickets as your tests change status — no webhooks or custom automation required
Trunk can manage the full lifecycle of a test's ticket for you. When a test's status changes, Trunk automatically:
* **Creates a ticket** when a test becomes flaky or broken
* **Reopens the existing ticket** (or creates a fresh one) when a fixed test regresses
* **Closes the ticket** when the test returns to healthy
Automatic ticketing works with the built-in [Linear](./linear-integration), [Jira](./jira-integration), and [Asana](./asana-integration) integrations and produces the same rich tickets as manual creation — full [ticket content](./index#ticket-content) (failure history, impact, common failure reasons, code owners), your configured [field defaults](./jira-integration#custom-fields), and complete dashboard support: linked tickets appear on the test case details page, and every automated action is recorded in the test's [Events tab](/flaky-tests/dashboard#test-case-details).
## Enabling ticket automation
Navigate to **Settings** → **Repositories** → **\[your repository]** → **Ticketing**. Once your Linear, Jira, or Asana integration is fully configured, the **Ticket automation** section becomes available.
The three toggles are independent — you can enable any combination:
| Setting | Behavior |
| ---------------------------------------- | ------------------------------------------------------------------------------------------------------------------------------------------------- |
| **Auto-create tickets for flaky tests** | When a test's status changes to flaky, automatically create a ticket and link it to the test. |
| **Auto-create tickets for broken tests** | When a test's status changes to broken, automatically create a ticket and link it to the test. |
| **Auto-close tickets for healthy tests** | When a test returns to healthy, automatically close its linked ticket. The link is kept so the same ticket can be reopened if the test regresses. |
All settings default to off.
Automatic creation fills tickets from your configured [field defaults](./jira-integration#custom-fields) with nobody in the loop. Every field your project requires must have a default set — fields marked **Require user to fill at creation** are prompted for in the manual create-ticket modal, which automatic creation can't do.
Auto-close applies to whatever ticket is linked to the test — including tickets you created manually or linked yourself — not just tickets the automation created.
### Close and reopen target statuses
When auto-close is enabled, you can pick which status closed tickets move to (for example `Done` vs. `Won't Fix` in Jira, a specific workflow state in Linear, or a project section in Asana). Similarly, reopened tickets can target a specific status. If you don't pick one, Trunk uses a sensible provider default: the first "done"-category status for closing, and a "to do"-style status for reopening.
## Reopen behavior
When a test becomes flaky or broken again after its linked ticket was closed, the **Reopen behavior** setting decides what happens:
| Option | Behavior |
| ----------------------------------- | ----------------------------------------------------------------------------------------------------------------------------------------------------------------------------------------------------------- |
| **Reopen recent tickets** (default) | If the ticket was closed within the reopen window (default 30 days, configurable 1–99), reopen it with a comment noting the re-detection. If it was closed longer ago, unlink it and create a fresh ticket. |
| **Always create a new ticket** | The closed ticket stays closed; a new ticket is created and linked each time. *Only one ticket can be linked to a Trunk test at a time.* |
| **Do nothing** | The closed ticket stays closed and no new ticket is created. |
The reopen window is measured from the ticket's close date in your ticketing system, so it behaves correctly whether Trunk or a person closed the ticket.
## How the automation behaves
* **One ticket per test.** Each test case has at most one linked ticket at a time. Previous tickets remain visible in the test's [event history](./index#ticket-event-history).
* **Ticket content stays fresh.** Auto-created tickets have their description refreshed as the test's status evolves — for example when a flaky test escalates to broken — so the ticket always reflects current data. Title edits made by your team are preserved, and tickets you created or linked manually are never edited by Trunk (only closed or reopened per your settings).
* **Quiet updates.** Status escalations update the ticket description in place rather than posting comments, so flip-flopping tests don't generate notification noise. Comments are only posted on reopen and close, where the context matters.
* **Clearly attributed.** Auto-created tickets are badged in the dashboard, and every automated action appears in the test's Events tab attributed to Trunk automation — so it's always clear whether Trunk or a teammate acted on a ticket.
* **Resilient to spikes.** A mass status change (for example, a bad merge flipping many tests at once) is absorbed and drained at a pace that respects your ticketing provider's rate limits.
For Jira, the configured close/reopen target status must be reachable in a single workflow transition from the ticket's current status. If your Jira workflow requires intermediate steps, the automation records the issue in the test's event history and skips the transition rather than guessing.
## Legacy webhook-based ticket autocreation
Before automatic ticketing, the recommended way to auto-create tickets was a [webhook integration](/flaky-tests/webhooks). Webhooks remain fully supported and are still the right tool for custom workflows and unsupported platforms, but the built-in automation is the better default for Linear, Jira, and Asana:
| | Automatic ticketing | Webhooks |
| ---------------- | --------------------------------------------------------------------------------------- | ---------------------------------------------------------- |
| Setup | Toggles on the Ticketing settings page | Svix endpoint + provider API transformation |
| Ticket body | Full Trunk ticket content: failure history, impact, common failure reasons, code owners | Whatever your transformation builds from the event payload |
| Lifecycle | Create, reopen, and close managed end to end | Create only, unless you build the rest |
| Dashboard | Tickets linked to test cases, events recorded, auto-created badge | Tickets are not linked back to Trunk |
| Custom platforms | Linear, Jira, and Asana | Anything with an API |
# Ticketing
Source: https://docs.trunk.io/flaky-tests/management/ticketing/index
Triage your flaky tests faster by creating automatically assigned and labeled tickets in your ticketing system
You can integrate directly with your ticketing systems to automatically create tickets when Trunk [detects a flaky test](/flaky-tests/detection).
## Automatic ticketing
With a connected Linear, Jira, or Asana integration, Trunk can manage ticket lifecycle automatically: create a ticket when a test becomes flaky or broken, reopen it if a fixed test regresses, and close it when the test returns to healthy. See [Automatic ticketing](./automatic-ticketing) for setup and behavior.
## Ticket content
Flaky Tests automatically generates tickets complete with a title and description. If you’re connected to Linear, Jira, or Asana, you can also assign default issue types, teams, projects, or assignees.
The ticket description contains the following information:
* Identifier of the test
* Since when has the test been labeled flaky
* The last time this test failed
* The impact when run on PRs
* The impact when run on branches
* Quarantine status
* Most common failure reasons
* Code owners, according to the [CODEOWNERS](https://docs.github.com/en/repositories/managing-your-repositorys-settings-and-features/customizing-your-repository/about-code-owners) file in your repository
## Ticket event history
When you unlink a ticket and re-link a test case to a different ticket, all events from the previous ticket association are preserved. The test case's [Events tab](/flaky-tests/dashboard#test-case-details) shows the full history — creation, updates, and status changes — across all tickets the test has ever been linked to, not just the current one.
## Integration setup
Ticket Creation supports integrations with Linear, Jira, and Asana. For any other platform, the generated ticket content is formatted in Markdown and can be copied across — see [Other ticketing platforms](./other-ticketing-platforms).
# Jira integration
Source: https://docs.trunk.io/flaky-tests/management/ticketing/jira-integration
Triage your flaky tests faster by creating automatically assigned and labeled tickets with the Jira integration
When Trunk Flaky Tests [detects a flaky test](../../detection/index), you can create an automatically generated Jira ticket for your team to pick up and fix the test.
Webhook payloads will also contain ticket information when a Jira ticket is created with the integration or when [existing tickets are linked](./jira-integration#link-existing-tickets-to-tests).
## Connecting to Jira
![]()
![]() To connect a Jira Cloud project, navigate to **Settings** → **Repositories** → **\[your repository]** → **Ticketing** and select **Jira** as your Ticketing System.
Then complete the form and click Connect to Jira Cloud with the following information.
| Field Name | Description | Examples |
| ---------------------------------------- | ----------------------------------------------------------------------------------------------- | -------------------------------- |
| Jira URL | The URL to your Jira Cloud project. | `https://trunk-io.atlassian.net` |
| Project Key | The project key for your Jira project. | `KAN` |
| Email | The email associated with your Jira API token. | `johndoe@example.com` |
| [Jira API token](#api-token-permissions) | [Create your Jira API token here.](https://id.atlassian.com/manage-profile/security/api-tokens) | `ATATT*****19FNY5Q` |
| Default label(s) for new tickets | Labels applied to new Jira tickets created through Trunk Flaky Tests | `flaky-test, debt` |
To connect a Jira Cloud project, navigate to **Settings** → **Repositories** → **\[your repository]** → **Ticketing** and select **Jira** as your Ticketing System.
Then complete the form and click Connect to Jira Cloud with the following information.
| Field Name | Description | Examples |
| ---------------------------------------- | ----------------------------------------------------------------------------------------------- | -------------------------------- |
| Jira URL | The URL to your Jira Cloud project. | `https://trunk-io.atlassian.net` |
| Project Key | The project key for your Jira project. | `KAN` |
| Email | The email associated with your Jira API token. | `johndoe@example.com` |
| [Jira API token](#api-token-permissions) | [Create your Jira API token here.](https://id.atlassian.com/manage-profile/security/api-tokens) | `ATATT*****19FNY5Q` |
| Default label(s) for new tickets | Labels applied to new Jira tickets created through Trunk Flaky Tests | `flaky-test, debt` |
Jira labels cannot contain spaces — the Trunk UI enforces this restriction in the labels field.
After connecting to Jira, you can specify a default issue type for new tickets and a default assignee for new tickets.
### API Token permissions
Your Jira user account must have the following project permissions to create a Jira API token that allows Trunk to read, create, and assign tickets automatically:
* *Create issues*
* *Assign issues* OR *Browse users and groups* (global permission)
* *Browse projects*
* If issue-level security is configured, issue-level security permissions must be granted to read issues.
You need to create an API token with the following scopes:
* Required scopes (classic)
* `read:jira-work`
* `write:jira-work`
* `read:jira-user`
* Required scopes (granular):
* `read:issue:jira`
* `read:issue-meta:jira`
* `read:issue-security-level:jira`
* `read:issue.vote:jira`
* `read:issue.changelog:jira`
* `read:avatar:jira`
* `read:status:jira`
* `read:user:jira`
* `read:field-configuration:jira`
* `read:application-role:jira`
* `read:group:jira`
* `read:issue-type:jira`
* `read:project:jira`
* `read:project.property:jira`
* `read:issue-type-hierarchy:jira`
* `read:project-category:jira`
* `read:project-version:jira`
* `read:project.component:jira`
* `read:permission:jira`
* `write:issue:jira`
* `write:comment:jira`
* `write:comment.property:jira`
* `write:attachment:jira`
Jira tokens cannot last longer than 365 days. Once the token expires, you will need to generate a new API token.
## Ticket automation
Once the integration is fully configured, you can enable [automatic ticketing](./automatic-ticketing) from the same settings page: Trunk will create Jira tickets when tests become flaky or broken, reopen them on regression, and close them when tests return to healthy.
## Create a new ticket
You can create a new ticket for any test listed in Trunk Flaky Tests.
There are 2 ways to create a new ticket in the Flaky Tests dashboard:
* Click on the options menu for any test case on the repo overview dashboard
![]()
![]() * Use the Create ticket button in the top left corner of the [test case details](../../dashboard#test-case-details) page.
Before you create the ticket, you will have a preview of the title and description.
* Use the Create ticket button in the top left corner of the [test case details](../../dashboard#test-case-details) page.
Before you create the ticket, you will have a preview of the title and description.
![]()
![]() ### Create with Jira
If you are connected to Jira, you can click the **Create Jira Ticket** button at the end of the modal, which will automatically create a ticket with the configured labels and assignees.
### Link existing tickets to tests
If you already have a ticket in Jira that you want to link to a test in the dashboard, you can use the [Link Ticket to Test Case API](../../reference/api-reference#post-flaky-tests-link-ticket-to-test-case).
## Custom Fields
Some Jira projects require additional fields beyond the standard fields (summary, description, and issue type) when creating tickets. Trunk supports configuring default values for any Jira field on a per-issue-type basis. Users can also override those defaults when creating a ticket.
### Configuring custom fields
In the Jira integration settings (**Settings** → **Repositories** → **\[your repository]** → **Ticketing**), select an issue type. Trunk fetches all available fields for that issue type from the Jira API and displays inputs for each supported field.
For each field, you can:
* Set a default value that pre-fills the field when a ticket is created
* Check **Require user to fill at creation** to leave the field blank in settings and prompt the user to fill it in the create ticket modal instead
Trunk automatically detects required fields (as marked by your Jira project) and shows a validation error if no default is set and the field is not marked for user input.
Fields are rendered using an appropriate input type based on the Jira field schema:
| Jira schema | Input type |
| -------------------------------- | ----------------------------------------- |
| `string` | Text input |
| `number` | Number input |
| `option` | Searchable dropdown |
| `user` | User picker dropdown |
| `array` of `string` | Chip input (comma or Enter to add values) |
| `text` / `string` with text hint | Text input |
### Create with Jira
If you are connected to Jira, you can click the **Create Jira Ticket** button at the end of the modal, which will automatically create a ticket with the configured labels and assignees.
### Link existing tickets to tests
If you already have a ticket in Jira that you want to link to a test in the dashboard, you can use the [Link Ticket to Test Case API](../../reference/api-reference#post-flaky-tests-link-ticket-to-test-case).
## Custom Fields
Some Jira projects require additional fields beyond the standard fields (summary, description, and issue type) when creating tickets. Trunk supports configuring default values for any Jira field on a per-issue-type basis. Users can also override those defaults when creating a ticket.
### Configuring custom fields
In the Jira integration settings (**Settings** → **Repositories** → **\[your repository]** → **Ticketing**), select an issue type. Trunk fetches all available fields for that issue type from the Jira API and displays inputs for each supported field.
For each field, you can:
* Set a default value that pre-fills the field when a ticket is created
* Check **Require user to fill at creation** to leave the field blank in settings and prompt the user to fill it in the create ticket modal instead
Trunk automatically detects required fields (as marked by your Jira project) and shows a validation error if no default is set and the field is not marked for user input.
Fields are rendered using an appropriate input type based on the Jira field schema:
| Jira schema | Input type |
| -------------------------------- | ----------------------------------------- |
| `string` | Text input |
| `number` | Number input |
| `option` | Searchable dropdown |
| `user` | User picker dropdown |
| `array` of `string` | Chip input (comma or Enter to add values) |
| `text` / `string` with text hint | Text input |
The `reporter` field is treated as optional even when Jira marks it as required. Jira automatically assigns the API token owner as reporter if the field is not specified.
The following fields are always excluded from the custom field configuration because they are managed elsewhere in the ticket creation flow:
`summary`, `description`, `project`, `issuetype`, `attachment`, `issuelinks`, `parent`
### Overriding defaults at ticket creation
When creating a ticket from the Flaky Tests dashboard, the create ticket modal shows inputs for any field that has a configured default or is marked for user input. Users can edit pre-filled defaults before submitting.
# Linear integration
Source: https://docs.trunk.io/flaky-tests/management/ticketing/linear-integration
Triage your flaky tests faster by creating automatically assigned and labeled tickets with the Linear integration
When Trunk Flaky Tests [detects a flaky test](../../detection/index), you can create an automatically generated Linear ticket for your team to pick up and fix the test.
Webhook payloads will also contain ticket information when a Linear ticket is created with the integration or when [existing tickets are linked](./linear-integration#link-existing-tickets-to-tests).
## Connecting to Linear
![]()
![]() To connect a Linear project:
1. Navigate to **Settings** → **Repositories** → **\[your repository]** → **Ticketing**.
2. Select **Linear** as your Ticketing System.
3. Add a [Linear API key](./linear-integration#api-token-permissions)
4. Select a Team and **Connect to Linear**.
After connecting, you can configure field defaults for auto-created tickets — including Priority, Labels, Estimate, Project, and Assignee — all scoped to the selected team. See [Field defaults](#field-defaults) below.
### API Key permissions
The following project permissions must be granted to your Linear API key so Trunk can read, create, and assign tickets automatically:
* *Read*
* *Create issues*
Selecting *Full Access* will also grant the required permissions.
## Ticket automation
Once the integration is fully configured, you can enable [automatic ticketing](./automatic-ticketing) from the same settings page: Trunk will create Linear issues when tests become flaky or broken, reopen them on regression, and close them when tests return to healthy.
## Create a new ticket
You can create a new ticket for any test listed in Flaky Tests.
There are 2 ways to create a new ticket in the Flaky Tests dashboard:
* Click on the options menu for any test case on the repo overview dashboard
To connect a Linear project:
1. Navigate to **Settings** → **Repositories** → **\[your repository]** → **Ticketing**.
2. Select **Linear** as your Ticketing System.
3. Add a [Linear API key](./linear-integration#api-token-permissions)
4. Select a Team and **Connect to Linear**.
After connecting, you can configure field defaults for auto-created tickets — including Priority, Labels, Estimate, Project, and Assignee — all scoped to the selected team. See [Field defaults](#field-defaults) below.
### API Key permissions
The following project permissions must be granted to your Linear API key so Trunk can read, create, and assign tickets automatically:
* *Read*
* *Create issues*
Selecting *Full Access* will also grant the required permissions.
## Ticket automation
Once the integration is fully configured, you can enable [automatic ticketing](./automatic-ticketing) from the same settings page: Trunk will create Linear issues when tests become flaky or broken, reopen them on regression, and close them when tests return to healthy.
## Create a new ticket
You can create a new ticket for any test listed in Flaky Tests.
There are 2 ways to create a new ticket in the Flaky Tests dashboard:
* Click on the options menu for any test case on the repo overview dashboard
![]()
![]() * Use the Create ticket button in the top left corner of the [test case details](../../dashboard#test-case-details) page.
Before you create the ticket, you get a preview of the title and description.
* Use the Create ticket button in the top left corner of the [test case details](../../dashboard#test-case-details) page.
Before you create the ticket, you get a preview of the title and description.
![]()
![]() ### Create with Linear
If you are connected to Linear, you can click the **Create Linear Ticket** button at the end of the modal to automatically create a ticket with the configured team and any field defaults you have set.
Note: You can use [Flaky Tests webhooks](../../webhooks/linear-integration) to automate ticket creation, or if you need more control over how tickets are created in Linear. This integration is not required when using webhooks.
## Field defaults
After selecting a team, you can configure default values that pre-populate whenever a new Linear ticket is created from Flaky Tests:
| Field | Description |
| ------------ | -------------------------------------------------------------------------------------------------------------------- |
| **Priority** | Default issue priority (Urgent, High, Medium, Low, No priority) |
| **Labels** | One or more team-level or workspace-level labels to apply |
| **Estimate** | Default story point estimate (scale matches your team's estimation type: Fibonacci, T-shirt, linear, or exponential) |
| **Project** | Default Linear project, filtered to projects accessible by the selected team |
| **Assignee** | Default assignee, chosen from team members |
Changing the selected team clears and reloads all field options automatically.
Field defaults are saved per repository. When you open the **Create Ticket** modal, all configured defaults are pre-filled and can be overridden before submitting.
### Requiring fields at ticket creation
For each field, you can check **Require user to fill at creation** instead of setting a default value. When this option is on, the field appears in the **Create Ticket** modal as a required input. The **Create Linear Ticket** button stays disabled until the user fills every required field.
This is useful for fields like **Project** or **Assignee** where the right value depends on the specific test being triaged and should not be pre-set globally.
## Link existing tickets to tests
If you already have a Linear ticket for a test, you can link it directly from the Test Details page without creating a new one.
**From the UI:**
1. Open the test case details page.
2. Click **Link Ticket** in the top-left corner.
3. Enter the Linear ticket URL or ID and click **Submit**.
The ticket appears on the test details page and its metadata (title, status, assignee) syncs from Linear.
**Via API:**
You can also link tickets programmatically using the [Link Ticket to Test Case API](../../reference/api-reference#post-flaky-tests-link-ticket-to-test-case).
# Other ticketing platforms
Source: https://docs.trunk.io/flaky-tests/management/ticketing/other-ticketing-platforms
Triage your flaky tests faster by manually creating tickets from generated markdown
If you have not set up an integration, Trunk Flaky Tests can still generate a ticket title and description so you can copy and paste the details into your project management software.
## Create a new ticket
You can create a new ticket for any test listed in Trunk Flaky Tests.
There are 2 ways to create a new ticket in the Flaky Tests dashboard:
* Click on the options menu for any test case on the repo overview dashboard
### Create with Linear
If you are connected to Linear, you can click the **Create Linear Ticket** button at the end of the modal to automatically create a ticket with the configured team and any field defaults you have set.
Note: You can use [Flaky Tests webhooks](../../webhooks/linear-integration) to automate ticket creation, or if you need more control over how tickets are created in Linear. This integration is not required when using webhooks.
## Field defaults
After selecting a team, you can configure default values that pre-populate whenever a new Linear ticket is created from Flaky Tests:
| Field | Description |
| ------------ | -------------------------------------------------------------------------------------------------------------------- |
| **Priority** | Default issue priority (Urgent, High, Medium, Low, No priority) |
| **Labels** | One or more team-level or workspace-level labels to apply |
| **Estimate** | Default story point estimate (scale matches your team's estimation type: Fibonacci, T-shirt, linear, or exponential) |
| **Project** | Default Linear project, filtered to projects accessible by the selected team |
| **Assignee** | Default assignee, chosen from team members |
Changing the selected team clears and reloads all field options automatically.
Field defaults are saved per repository. When you open the **Create Ticket** modal, all configured defaults are pre-filled and can be overridden before submitting.
### Requiring fields at ticket creation
For each field, you can check **Require user to fill at creation** instead of setting a default value. When this option is on, the field appears in the **Create Ticket** modal as a required input. The **Create Linear Ticket** button stays disabled until the user fills every required field.
This is useful for fields like **Project** or **Assignee** where the right value depends on the specific test being triaged and should not be pre-set globally.
## Link existing tickets to tests
If you already have a Linear ticket for a test, you can link it directly from the Test Details page without creating a new one.
**From the UI:**
1. Open the test case details page.
2. Click **Link Ticket** in the top-left corner.
3. Enter the Linear ticket URL or ID and click **Submit**.
The ticket appears on the test details page and its metadata (title, status, assignee) syncs from Linear.
**Via API:**
You can also link tickets programmatically using the [Link Ticket to Test Case API](../../reference/api-reference#post-flaky-tests-link-ticket-to-test-case).
# Other ticketing platforms
Source: https://docs.trunk.io/flaky-tests/management/ticketing/other-ticketing-platforms
Triage your flaky tests faster by manually creating tickets from generated markdown
If you have not set up an integration, Trunk Flaky Tests can still generate a ticket title and description so you can copy and paste the details into your project management software.
## Create a new ticket
You can create a new ticket for any test listed in Trunk Flaky Tests.
There are 2 ways to create a new ticket in the Flaky Tests dashboard:
* Click on the options menu for any test case on the repo overview dashboard
![]()
![]() * Use the Create ticket button in the top left corner of the [test case details](../../dashboard#test-case-details) page.
Before you create the ticket, you will have a preview of the title and description.
* Use the Create ticket button in the top left corner of the [test case details](../../dashboard#test-case-details) page.
Before you create the ticket, you will have a preview of the title and description.
![]()
![]() Now you can copy and paste the ticket title and description into your project management or ticketing platform.
# Overview
Source: https://docs.trunk.io/flaky-tests/overview
Detect, quarantine, and eliminate flaky tests from your codebase
Trunk Flaky Tests lets your teams detect, track, quarantine, and fix **flaky tests** in your codebase. Trunk can also identify **broken tests** — tests failing consistently at a high rate that indicate real regressions needing immediate fixes, not just quarantining. Flaky Tests is language, environment, and framework-agnostic.
Let's explore how Trunk Flaky Tests' features help you tackle flaky tests. If you can't wait to try Trunk, follow our [getting started guide](/flaky-tests/get-started).
You can see an overview of Trunk Flaky Tests in this video.
## Understand the impact
Your dashboard shows a comprehensive overview of your test suite's health at a glance. It lets you see important impact metrics like the number of flaky tests, PRs impacted by flaky tests, and PRs rescued by quarantining flaky tests.
Now you can copy and paste the ticket title and description into your project management or ticketing platform.
# Overview
Source: https://docs.trunk.io/flaky-tests/overview
Detect, quarantine, and eliminate flaky tests from your codebase
Trunk Flaky Tests lets your teams detect, track, quarantine, and fix **flaky tests** in your codebase. Trunk can also identify **broken tests** — tests failing consistently at a high rate that indicate real regressions needing immediate fixes, not just quarantining. Flaky Tests is language, environment, and framework-agnostic.
Let's explore how Trunk Flaky Tests' features help you tackle flaky tests. If you can't wait to try Trunk, follow our [getting started guide](/flaky-tests/get-started).
You can see an overview of Trunk Flaky Tests in this video.
## Understand the impact
Your dashboard shows a comprehensive overview of your test suite's health at a glance. It lets you see important impact metrics like the number of flaky tests, PRs impacted by flaky tests, and PRs rescued by quarantining flaky tests.
![]()
![]() To learn more, [see how Flaky Tests does detection](/flaky-tests/detection).
## Track every flaky test
You can find a list of known flaky tests complete with important information like their impact on PRs and if someone's working on a fix. For more granularity, you can also inspect individual tests for their execution history, results, and status changes.
To learn more, [see how Flaky Tests does detection](/flaky-tests/detection).
## Track every flaky test
You can find a list of known flaky tests complete with important information like their impact on PRs and if someone's working on a fix. For more granularity, you can also inspect individual tests for their execution history, results, and status changes.
![]()
![]() To learn more, [see how Flaky Tests does detection](/flaky-tests/detection).
## Stay in sync
To learn more, [see how Flaky Tests does detection](/flaky-tests/detection).
## Stay in sync
![PR comment linking to PR Test Summary]()
![PR comment linking to PR Test Summary]() Flaky Tests helps everyone in your team stay in sync about flaky test failures with [GitHub PR comments](./management/github-pull-request-comments), so no time is wasted debugging failures from known flaky tests.
To learn more, [see our docs about GitHub Comments and Test Summaries](./management/github-pull-request-comments).
Flaky Tests helps everyone in your team stay in sync about flaky test failures with [GitHub PR comments](./management/github-pull-request-comments), so no time is wasted debugging failures from known flaky tests.
To learn more, [see our docs about GitHub Comments and Test Summaries](./management/github-pull-request-comments).
Press ⌘ K (macOS) or Ctrl K (Windows and Linux) anywhere in the Trunk app to open the command palette. Start typing to jump to Merge Queue, Flaky Tests, your account settings, or any connected repository by name.
## Investigate flaky failures
Flaky Tests creates detailed reports for individual test failures so you can debug faster.
![]()
![]() Test details will summarize all the unique ways a flaky test fails and let you flip through the relevant stack traces in the Trunk app.
Test details will summarize all the unique ways a flaky test fails and let you flip through the relevant stack traces in the Trunk app.
![]()
![]() To learn more, [see our docs about the detection of flaky tests](./detection/).
## Quarantine flaky failures
Flaky Tests allows you to [quarantine](/flaky-tests/quarantining) detected flaky tests, stopping them from failing your CI jobs. This prevents failed flaky tests from impacting your CI pipelines, so you won’t have to disable tests and won’t be slowed down by flaky CI jobs.
To learn more, [see our docs about the detection of flaky tests](./detection/).
## Quarantine flaky failures
Flaky Tests allows you to [quarantine](/flaky-tests/quarantining) detected flaky tests, stopping them from failing your CI jobs. This prevents failed flaky tests from impacting your CI pipelines, so you won’t have to disable tests and won’t be slowed down by flaky CI jobs.
![]()
![]() To learn more, [see our docs about quarantining tests](./quarantining/).
## Manage tickets
To learn more, [see our docs about quarantining tests](./quarantining/).
## Manage tickets
![]()
![]() Trunk enables the automation of quickly creating and assigning tickets through integrations with platforms like Jira and Linear, as well as custom workflows with webhooks. The status of tickets created will be reflected in real-time in the Trunk web app. This helps you track efforts to fix high-impact, flaky tests.
To learn more, [learn about our ticketing integrations](./management/ticketing/jira-integration).
## Next steps
Trunk enables the automation of quickly creating and assigning tickets through integrations with platforms like Jira and Linear, as well as custom workflows with webhooks. The status of tickets created will be reflected in real-time in the Trunk web app. This helps you track efforts to fix high-impact, flaky tests.
To learn more, [learn about our ticketing integrations](./management/ticketing/jira-integration).
## Next steps
Start finding flaky tests today by [signing up for Trunk](https://app.trunk.io/signup?intent=flaky%20tests) or reading our [Getting Started guides](./get-started/).
# Quarantining
Source: https://docs.trunk.io/flaky-tests/quarantining/index
Mitigate impact of known flaky tests by isolating them at run time
![]() **Quarantining** isolates known flaky tests to prevent them from blocking CI jobs while continuing to run and track their results. The system identifies flaky tests at runtime and overrides their exit codes when they fail, allowing your CI pipeline to pass without requiring code changes to disable problematic tests.
**Why use quarantining:** It acts as a crucial stopgap, minimizing the disruption from known flaky tests while your team works on fixing them. By quarantining flaky tests, you unblock critical CI pipelines—**especially your merge queue**—and regain development velocity without losing visibility, as these tests continue to run and upload results. This constant stream of data allows you to prioritize fixing the worst offenders based on their ongoing impact.
**Quarantining** isolates known flaky tests to prevent them from blocking CI jobs while continuing to run and track their results. The system identifies flaky tests at runtime and overrides their exit codes when they fail, allowing your CI pipeline to pass without requiring code changes to disable problematic tests.
**Why use quarantining:** It acts as a crucial stopgap, minimizing the disruption from known flaky tests while your team works on fixing them. By quarantining flaky tests, you unblock critical CI pipelines—**especially your merge queue**—and regain development velocity without losing visibility, as these tests continue to run and upload results. This constant stream of data allows you to prioritize fixing the worst offenders based on their ongoing impact.
**Broken tests are not quarantine candidates.** Quarantining is designed for flaky tests — tests that intermittently fail and can be safely skipped to unblock CI while being investigated. A broken test represents a real failure that should not be hidden from CI results. Only tests with a **Flaky** status are eligible for auto-quarantine.
## What does "Quarantined" mean?
A quarantined test continues running in CI and uploading results to Trunk Flaky Tests, but its failures won't block your pipeline. The [Trunk Analytics CLI](../reference/cli-reference) checks with Trunk's backend to determine if failed tests are quarantined, then overrides the exit code for those failures. When all failures in a CI job come from quarantined tests, the entire job passes.
**Why this matters:** You maintain complete test coverage and historical data while preventing known problematic tests from disrupting your development cycle.
![A CI job runs three tests where test_checkout fails. Without quarantine the job exits 1 and the PR is blocked; with the failing test wrapped in a quarantine box the job exits 0 and the PR merges.]() ## How tests get quarantined
Tests can be quarantined through two methods:
1. **Manual Quarantine** - You explicitly select specific tests using override settings
2. **Auto-Quarantine** (when enabled) - Tests already flagged by [Trunk's flaky detection](../detection/) are automatically quarantined
Tests are auto-quarantined only if detected as **flaky** or [flagged as flaky](../detection/flag-as-flaky) manually. Tests with a **Broken** status are not auto-quarantined — they represent real failures that should be investigated and fixed. For [manually quarantined tests](./index#overriding-individual-tests), all failures are quarantined regardless of test state.
## Enable quarantining
## How tests get quarantined
Tests can be quarantined through two methods:
1. **Manual Quarantine** - You explicitly select specific tests using override settings
2. **Auto-Quarantine** (when enabled) - Tests already flagged by [Trunk's flaky detection](../detection/) are automatically quarantined
Tests are auto-quarantined only if detected as **flaky** or [flagged as flaky](../detection/flag-as-flaky) manually. Tests with a **Broken** status are not auto-quarantined — they represent real failures that should be investigated and fixed. For [manually quarantined tests](./index#overriding-individual-tests), all failures are quarantined regardless of test state.
## Enable quarantining
Toggling the **Enable Test Quarantining** switch makes quarantining possible but does not quarantine any tests on its own.
A test failure will only be ignored by CI if the test is already manually quarantined, or if the test has previously been identified as flaky and the Auto-Quarantine option is enabled.
Actively quarantining tests will significantly change CI results, as failures from quarantined tests no longer cause builds to fail. [Learn more about the effects of quarantining](./index#whats-affected).
With quarantining enabled, the Analytics Uploader will compare failed test cases against known flaky tests. If a test is known to be flaky, it will be quarantined. If all failed tests are quarantined, the exit code of the test command will be overridden to return 0 and the CI job will pass.
### Quarantining settings
To enable quarantining, navigate to **Settings** → **Repositories** → **\[repository]** → **Flaky Tests** → toggle **Enable Test Quarantining** on.
![]() Here's what each of these options does:
| Setting | Description |
| --------------------------------------- | ------------------------------------------------------------------------------------------------------------------------------------------------------------------------------------------------------------------------------------------------------------------------------------------------------------ |
| Enable Test Quarantining | This primary toggle activates the quarantining feature set, unlocking both manual override options and the ability to enable auto-quarantining. For any quarantining to work, the [necessary configurations](#updates-in-ci) must also be made in your CI pipeline. |
| Auto-Quarantine Flaky Tests | When enabled, any test already identified by Trunk as "flaky" will be automatically quarantined. This saves you from having to manually quarantine each flaky test as it's discovered. |
| Manual Quarantine Permissions | Controls who can set **Always Quarantine** or **Never Quarantine** overrides on individual tests. Set to **Anyone** to allow any user with repository access, or **Admins only** to restrict to organization admins. Disabled when **Enable Test Quarantining** is off. Only admins can change this setting. |
| Manual Test Status Override Permissions | Controls who can use [Flag as Flaky](../detection/flag-as-flaky) to set a test's status. Set to **Anyone** to allow any user with repository access, or **Admins only** to restrict to organization admins. Only admins can change this setting. |
| Summary Flaky Tests Reports | When enabled, Trunk posts [pull request comments](../management/github-pull-request-comments) on each PR summarizing tests that passed, failed, flaked, were skipped, or were quarantined. Enabled by default. |
### Collection-level quarantining settings
[Test Collections](../get-started/test-collections) have their own quarantining settings that override the repository-level settings for any uploads routed to that collection. This lets you apply different quarantining policies to different subsets of your test suite.
To configure collection quarantining, navigate to **Flaky Tests** → **Collections** → **\[collection name]** → **Settings** → **Quarantining**.
The same two toggles are available at the collection level:
| Setting | Description |
| --------------------------- | ------------------------------------------------------------------------------------------------------------------------------------------------------------------------------------------------------------------------- |
| Enable Test Quarantining | Activates quarantining for this collection. When enabled, this setting overrides the repository-level quarantining setting for uploads that belong to this collection. New test collections have this enabled by default. |
| Auto-Quarantine Flaky Tests | Automatically quarantines any test in this collection that Trunk has identified as flaky. This option is only available when quarantining is enabled for the collection. |
Here's what each of these options does:
| Setting | Description |
| --------------------------------------- | ------------------------------------------------------------------------------------------------------------------------------------------------------------------------------------------------------------------------------------------------------------------------------------------------------------ |
| Enable Test Quarantining | This primary toggle activates the quarantining feature set, unlocking both manual override options and the ability to enable auto-quarantining. For any quarantining to work, the [necessary configurations](#updates-in-ci) must also be made in your CI pipeline. |
| Auto-Quarantine Flaky Tests | When enabled, any test already identified by Trunk as "flaky" will be automatically quarantined. This saves you from having to manually quarantine each flaky test as it's discovered. |
| Manual Quarantine Permissions | Controls who can set **Always Quarantine** or **Never Quarantine** overrides on individual tests. Set to **Anyone** to allow any user with repository access, or **Admins only** to restrict to organization admins. Disabled when **Enable Test Quarantining** is off. Only admins can change this setting. |
| Manual Test Status Override Permissions | Controls who can use [Flag as Flaky](../detection/flag-as-flaky) to set a test's status. Set to **Anyone** to allow any user with repository access, or **Admins only** to restrict to organization admins. Only admins can change this setting. |
| Summary Flaky Tests Reports | When enabled, Trunk posts [pull request comments](../management/github-pull-request-comments) on each PR summarizing tests that passed, failed, flaked, were skipped, or were quarantined. Enabled by default. |
### Collection-level quarantining settings
[Test Collections](../get-started/test-collections) have their own quarantining settings that override the repository-level settings for any uploads routed to that collection. This lets you apply different quarantining policies to different subsets of your test suite.
To configure collection quarantining, navigate to **Flaky Tests** → **Collections** → **\[collection name]** → **Settings** → **Quarantining**.
The same two toggles are available at the collection level:
| Setting | Description |
| --------------------------- | ------------------------------------------------------------------------------------------------------------------------------------------------------------------------------------------------------------------------- |
| Enable Test Quarantining | Activates quarantining for this collection. When enabled, this setting overrides the repository-level quarantining setting for uploads that belong to this collection. New test collections have this enabled by default. |
| Auto-Quarantine Flaky Tests | Automatically quarantines any test in this collection that Trunk has identified as flaky. This option is only available when quarantining is enabled for the collection. |
Only organization admins can change collection quarantining settings. Members can view the settings page but cannot toggle the controls.
**New test collections have quarantining enabled by default.** You can disable it from the collection's Settings page at any time. Auto-Quarantine remains off by default and must be turned on separately.
When you disable collection quarantining, auto-quarantine is also disabled automatically. Re-enabling quarantining for the collection does not restore auto-quarantine — you must turn it back on separately.
## Quarantining with Sharded or Parallelized Tests
There are two options for handling quarantining.
**Option 1: Wrapping each test invocation**
Wrap each command and specify its JUnit output path. Trunk captures the exit code and automatically uploads results.
**Example**
```bash theme={null}
# run test 1
./trunk-analytics-cli test --org-url-slug=[org] --token=[token] --junit-paths=test1_output/*.xml -- npm run test1
# run test 2
./trunk-analytics-cli test --org-url-slug=[org] --token=[token] --junit-paths=test2_output/*.xml -- npm run test2
```
**Option 2: Handling quarantining during upload**
For complex setups where Trunk can’t wrap test commands, run tests first and let the upload step be the final gate. When quarantining is enabled, the upload inspects the provided JUnit results and decides whether to return exit code `0` or `1` based on the outcomes.
**Advanced: Handling build errors outside test runs**
To handle build issues that occur outside test runs, use the --test-process-exit-code option. This provides a fallback exit code if the upload runs without detecting any JUnit results.
**Example**
```sh theme={null}
./trunk-analytics-cli test --junit-paths "test_output.xml" \
--org-url-slug \
--token $TRUNK_API_TOKEN \
--junit-paths="**/results/*.xml" \
--test-process-exit-code=1
```
The CLI only recognizes tests defined in JUnit. If multiple test executions occur and one fails due to a build error, Flaky Tests won’t detect it and will assume the exit code came from test failures. If those failures are quarantined, the job may incorrectly be reported as successful. To prevent this:
* Upload results for each test execution separately, or
* Generate a JUnit that records build errors.
## Updates in CI
If you're using the provided [GitHub Actions workflow](../get-started/ci-providers/) to upload test results to Flaky Tests, you can quarantine flaky tests by wrapping the test command or as a follow-up step.
If you're using the Trunk Analytics CLI directly or other CI providers, check the instructions in the **Using The Trunk Analytics CLI Directly** tab.
Using the Trunk Analytics Uploader Action in your GitHub Actions Workflow files may need modifications to your workflow files to support quarantining.
If you upload your test results as a second step after you run your tests, **you need to add** `continue-on-error: true` **on your test step so your CI** job will continue even on failures.
Here's an example file.
```yaml lines highlight={1,9} theme={null}
name: Run Tests And Upload Results
on:
workflow_dispatch:
jobs:
upload-test-results:
runs-on: ubuntu-latest
timeout-minutes: 60
steps:
- name: Run Tests
id: unit_tests
shell: bash
run:
continue-on-error: true
- name: Upload test results
if: always()
uses: trunk-io/analytics-uploader@v2
with:
junit-paths:
org-slug: my-trunk-org-slug
token: ${{ secrets.TRUNK_API_TOKEN }}
```
If you want to run the test command and upload in a single step, the test command must be **run via the Analytics Uploader** through the `run: ` parameter.
This will override the response code of the test command. Make sure to set `continue-on-error: false` so un-quarantined tests are blocking.
```yaml theme={null}
name: Run Tests And Upload Results
on:
workflow_dispatch:
jobs:
upload-test-results:
runs-on: ubuntu-latest
timeout-minutes: 60
steps:
- name: Checkout
uses: actions/checkout@v3
- name: Run tests and upload results
uses: trunk-io/analytics-uploader@v2
with:
junit-paths:
run:
token: ${{ secrets.TRUNK_API_TOKEN }}
org-slug: my-trunk-org-slug
```
**Using Flaky Tests as a separate step**
If you upload your test results as a second step after you run your tests, you need to ensure your test step **continues on errors** so the upload step that's run after can quarantine failed tests. When quarantining is enabled, the `trunk-analytics-cli upload` command will **return an error** if there are unquarantined failures and return a status code 0 if all tests are quarantined.
```bash theme={null}
|| true # doesn't fail job on failure
|
./trunk-analytics-cli upload \
--org-url-slug $TRUNK_ORG_URL_SLUG \
--token $TRUNK_API_TOKEN \
--junit-paths $JUNIT_PATH
```
**Using Flaky Tests as a single step**
You can also wrap the test command with the Trunk Analytics CLI. When wrapping the command with the Trunk Analytics CLI, if there are unquarantined tests, the command will return an error. If there are no unquarantined tests, the command will return a status code 0.
```bash theme={null}
./trunk-analytics-cli test \
--org-url-slug \
--token $TRUNK_API_TOKEN \
--junit-paths $JUNIT_PATH \
--allow-empty-test-results \
```
## Quarantining without uploading
If you want quarantining to gate your CI job but don't want that run's test results uploaded to Trunk, pass the `--dry-run` flag (or set the `TRUNK_DRY_RUN=true` environment variable) to the `upload` or `test` command:
```bash theme={null}
./trunk-analytics-cli upload \
--org-url-slug $TRUNK_ORG_URL_SLUG \
--token $TRUNK_API_TOKEN \
--junit-paths $JUNIT_PATH \
--dry-run
```
With `--dry-run`, the CLI still checks your failed tests against Trunk's quarantine service and overrides the exit code — returning `0` when all failures are quarantined — but writes the test results bundle to a local `./bundle_upload` directory instead of uploading it to Trunk.
Keep in mind:
* An organization token and network access are still required; the quarantine check queries Trunk's backend to determine which tests are quarantined.
* Because nothing is uploaded, the run won't appear in your dashboard or contribute to [flaky test detection](../detection/). Quarantining decisions are based on results from your other, uploading CI jobs.
* The local bundle written to `./bundle_upload` can also be useful for inspecting exactly what the CLI would have uploaded.
## Overriding individual tests
If you have tests that should never be quarantined or should always be quarantined regardless of their current health status, you can do this by overriding individual tests.
![quarantine override on the test details page]()
![quarantine override on the test details page]() You can set a quarantine override from two places: a test's details page, or the Flaky Tests table.
**From the test details page**
Open the test's details page and click the **Quarantine** button to reveal the **Choose quarantine status** control. Select **Always** to quarantine the test's failures or **Never** to keep it from being quarantined, add the required comment, and click **Save**. The control also shows whether repository auto-quarantining is on. To clear an override later, reopen the control and click **Remove Quarantine**.
**From the Flaky Tests table**
Open the actions menu (the **⋮** button at the end of any row in the Flaky Tests table). Alongside **Copy link** and **Create ticket**, two quarantine actions are available:
* **Quarantine test** / **Unquarantine test**: toggles the always-quarantine override for that test.
* **Never Quarantine test** / **Remove Never Quarantine**: toggles the never-quarantine override. When set, the test is never quarantined, even if auto-quarantining is enabled for the repo.
Access to these options is controlled by the [Manual Quarantine Permissions](#quarantining-settings) setting. When set to **Admins only**, non-admin users see the quarantine controls disabled with the tooltip "Only admins can set manual quarantine."
When a manual override is active, a banner shows who set it and when.
| Setting | Behavior |
| ----------------- | ------------------------------------------------------------------------------------------------------------- |
| Always Quarantine | Quarantine a test failure even if the health status is healthy. |
| Never Quarantine | Never quarantine failures, even if the health status is flaky, and auto-quarantining is enabled for the repo. |
You can set a quarantine override from two places: a test's details page, or the Flaky Tests table.
**From the test details page**
Open the test's details page and click the **Quarantine** button to reveal the **Choose quarantine status** control. Select **Always** to quarantine the test's failures or **Never** to keep it from being quarantined, add the required comment, and click **Save**. The control also shows whether repository auto-quarantining is on. To clear an override later, reopen the control and click **Remove Quarantine**.
**From the Flaky Tests table**
Open the actions menu (the **⋮** button at the end of any row in the Flaky Tests table). Alongside **Copy link** and **Create ticket**, two quarantine actions are available:
* **Quarantine test** / **Unquarantine test**: toggles the always-quarantine override for that test.
* **Never Quarantine test** / **Remove Never Quarantine**: toggles the never-quarantine override. When set, the test is never quarantined, even if auto-quarantining is enabled for the repo.
Access to these options is controlled by the [Manual Quarantine Permissions](#quarantining-settings) setting. When set to **Admins only**, non-admin users see the quarantine controls disabled with the tooltip "Only admins can set manual quarantine."
When a manual override is active, a banner shows who set it and when.
| Setting | Behavior |
| ----------------- | ------------------------------------------------------------------------------------------------------------- |
| Always Quarantine | Quarantine a test failure even if the health status is healthy. |
| Never Quarantine | Never quarantine failures, even if the health status is flaky, and auto-quarantining is enabled for the repo. |
![]() To review a history of all quarantine changes on a test, check the **Events** tab on the test details page. The Events tab shows every override, setting change, and comment, along with the author and timestamp for each entry. To see all quarantined runs of a test, set the **Quarantined** filter to **Only** on the **Test History** tab.
## Tracking quarantined jobs in the dashboard
Once quarantining is active, the **Quarantining** tab provides a central hub for monitoring its impact and effectiveness. This tab serves as a complete audit log of every CI job saved by the feature, allowing you to:
* **Visualize Trends:** A 30-day chart shows the number of jobs quarantined per day.
* **Inspect Individual Jobs:** A detailed table lists every quarantined job. Click any entry to see the specific tests that were quarantined.
* **Isolate Critical Workflows:** Use the filter to see how quarantining impacts specific branches, such as preventing flaky failures in your Merge Queue.
* **Measure ROI:** Use the data to quantify the number of builds saved and developer time reclaimed for your organization.
To review a history of all quarantine changes on a test, check the **Events** tab on the test details page. The Events tab shows every override, setting change, and comment, along with the author and timestamp for each entry. To see all quarantined runs of a test, set the **Quarantined** filter to **Only** on the **Test History** tab.
## Tracking quarantined jobs in the dashboard
Once quarantining is active, the **Quarantining** tab provides a central hub for monitoring its impact and effectiveness. This tab serves as a complete audit log of every CI job saved by the feature, allowing you to:
* **Visualize Trends:** A 30-day chart shows the number of jobs quarantined per day.
* **Inspect Individual Jobs:** A detailed table lists every quarantined job. Click any entry to see the specific tests that were quarantined.
* **Isolate Critical Workflows:** Use the filter to see how quarantining impacts specific branches, such as preventing flaky failures in your Merge Queue.
* **Measure ROI:** Use the data to quantify the number of builds saved and developer time reclaimed for your organization.
![]() ## Audit logs
Trunk provides audit logs for all setting changes and overwrites for individual tests. You can access the audit log by navigating to **Settings** → **Repositories** → **\[repository]** → **Flaky Tests** → **Audit logs** under the Enable Test Quarantining heading.
## Audit logs
Trunk provides audit logs for all setting changes and overwrites for individual tests. You can access the audit log by navigating to **Settings** → **Repositories** → **\[repository]** → **Flaky Tests** → **Audit logs** under the Enable Test Quarantining heading.
![]() ## Quarantining API and webhooks
For advanced use cases, you can interact with quarantining features programmatically.
* API: Use the [Flaky Tests API](../reference/api-reference) to fetch a list of all currently quarantined tests in your project.
* Webhooks: Subscribe to the `test_case.quarantining_setting_changed` event to trigger automated workflows whenever a test's quarantine override is modified. Learn more about [Webhooks](https://www.svix.com/event-types/us/org_2eQPL41Ew5XSHxiXZIamIUIXg8H/#test_case.quarantining_setting_changed).
## Quarantining API and webhooks
For advanced use cases, you can interact with quarantining features programmatically.
* API: Use the [Flaky Tests API](../reference/api-reference) to fetch a list of all currently quarantined tests in your project.
* Webhooks: Subscribe to the `test_case.quarantining_setting_changed` event to trigger automated workflows whenever a test's quarantine override is modified. Learn more about [Webhooks](https://www.svix.com/event-types/us/org_2eQPL41Ew5XSHxiXZIamIUIXg8H/#test_case.quarantining_setting_changed).
### Service Availability and Graceful Degradation
Trunk Analytics CLI is designed to fail safe when our quarantine service is unavailable. Read more at [Quarantine Service Availability](./quarantine-service-availability)
# Quarantine Service Availability
Source: https://docs.trunk.io/flaky-tests/quarantining/quarantine-service-availability
How Trunk Analytics CLI handles quarantine service outages without compromising your CI pipeline.
## Service Availability and Graceful Degradation
[Trunk Analytics CLI](../reference/cli-reference) is designed to fail safe when our quarantine service is unavailable. Your CI pipeline's integrity is never compromised by Trunk outages.
### What happens if Trunk is unreachable?
When Trunk Analytics CLI cannot fetch quarantine configuration from Trunk's API:
1. **Your original test exit code is preserved** — if tests fail, your CI fails
2. **No tests are quarantined** — failed tests are reported as failures, not suppressed
3. **A warning is displayed** in Trunk Analytics CLI output:
> We were unable to determine the quarantine status for tests. Any failing tests will be reported as failures.
### Why fail-safe?
We prioritize avoiding false positives over convenience. If Trunk is down, we'd rather your CI fails on a flaky test than silently passes on a real regression. You can always re-run the job once connectivity is restored.
### What this means for you
| Scenario | CI Exit Code | Tests Quarantined |
| ------------------------------------ | --------------- | ----------------- |
| API available, tests quarantined | 0 (pass) | Yes |
| API available, tests not quarantined | Non-zero (fail) | No |
| API unavailable | Non-zero (fail) | No |
### Caching behavior
Trunk Analytics CLI does not cache quarantine configuration locally. Each invocation requires a successful API call to apply quarantining. This means you are always operating on the freshest quarantine state rather than potentially stale data.
# Alert When a Test Escalates
Source: https://docs.trunk.io/flaky-tests/recipes/alert-on-test-escalation
Send Slack alerts when a test gets worse, not just the first time it's flagged
A single "this test is now flaky" alert tells you a test crossed a threshold once. It says nothing about what happens next: the same test failing on more branches, tripping more monitors, or sliding from flaky into a consistently broken regression. For the tests that matter, you want to hear about the escalation, not just the first detection.
This page wires that up with Trunk webhooks and a Slack transformation. It builds on the [Slack integration guide](../webhooks/slack-integration), so set that connection up first, then come back here to filter it down to escalations.
## Pick the right event
The one decision that matters is which event you subscribe to. Two events fire here, at two different granularities.
| Event | Fires when | Use it to |
| ------------------------------------------------------- | ----------------------------------------------------------------------------------------- | ---------------------------------------------------------------------------------- |
| [`v2.test_case.status_changed`](../webhooks/index) | The test's **overall health status** transitions between `HEALTHY`, `FLAKY`, and `BROKEN` | Alert on health escalations like `FLAKY` → `BROKEN` |
| [`test_case.monitor_status_changed`](../webhooks/index) | **Any individual monitor** activates or resolves for the test | Alert every time a monitor flags the test, even if its overall status doesn't move |
That distinction matters. `v2.test_case.status_changed` only fires when the test's combined status changes. If a test is already `FLAKY` and a second monitor starts flagging it, the overall status stays `FLAKY`, so nothing is sent. To catch a test that keeps getting flagged by more monitors over time (the "more than just the first detection" case), subscribe to `test_case.monitor_status_changed` instead.
![A test goes HEALTHY to FLAKY when Monitor A fires, so both events send. When Monitor B fires while the test is already FLAKY, v2.test_case.status_changed sends nothing while test_case.monitor_status_changed still fires.]()
Test status priority is **Broken > Flaky > Healthy**. A test flagged by both a broken-type and a flaky-type monitor shows as `BROKEN` until the broken monitor resolves. See [Flake Detection](../detection/) for how the combined status is calculated.
## Alert when a test becomes broken
Use this when consistently failing tests deserve a louder, separate signal than routine flakiness.
**1. Configure a broken-type monitor.** A test only reaches `BROKEN` status when a [failure rate](../detection/failure-rate-monitor) or [failure count](../detection/failure-count-monitor) monitor with its **Detection type** set to **Broken** is active for it. Set one up if you haven't already. A common pattern is to pair a broken-type monitor (catching consistently failing tests) with a flaky-type monitor (catching intermittent ones).
**2. Filter the transformation to escalations.** In your Slack endpoint's transformation, cancel the webhook unless the status got worse. This example ranks the three statuses and only sends a message when `new_status` is more severe than `previous_status`, so recoveries and resolutions stay quiet:
```javascript theme={null}
// Status values are uppercase (HEALTHY, FLAKY, BROKEN), matching the payload.
const SEVERITY = { HEALTHY: 0, FLAKY: 1, BROKEN: 2 };
function handler(webhook) {
const { previous_status = "HEALTHY", new_status = "HEALTHY" } = webhook.payload;
// Only alert when the test got worse, not when it recovered.
if (SEVERITY[new_status] <= SEVERITY[previous_status]) {
webhook.cancel = true;
return webhook;
}
// summarizeTestCase() is defined in the Slack integration guide.
webhook.payload = summarizeTestCase(webhook.payload);
return webhook;
}
```
To alert *only* when a test reaches the broken state, and stay quiet on first-time flaky detections, gate on the new status directly instead:
```javascript theme={null}
function handler(webhook) {
if (webhook.payload.new_status !== "BROKEN") {
webhook.cancel = true;
return webhook;
}
// summarizeTestCase() is defined in the Slack integration guide.
webhook.payload = summarizeTestCase(webhook.payload);
return webhook;
}
```
Both snippets replace the `handler` function from the [Slack integration guide](../webhooks/slack-integration#id-2.-customize-your-transformation); keep that guide's `summarizeTestCase` helper in the same transformation so the message body still renders. Its `previous_status → new_status` line makes the escalation obvious in the channel.
## The quarantine trade-off
Before you reach for a broken-type monitor, know what it does to quarantine. Classifying a test as broken changes its health status, and auto-quarantine applies only to tests with a **Flaky** status. So when a broken-type monitor flags a test that was auto-quarantined as flaky, the test becomes `BROKEN`, drops out of the auto-quarantine set, and its failures start blocking CI again. That is by design, since a broken test is a real regression, not a flake to skip. It also means a broken classification is not a side-effect-free way to get an escalation alert.
Labels avoid this. A labeling monitor doesn't change health status, so an auto-quarantined test stays quarantined while you still get the activation signal (see [Alert every time a monitor flags a test](#alert-every-time-a-monitor-flags-a-test) below). Manually quarantined tests are unaffected either way. See [Quarantining](../quarantining/) and [Flake Detection](../detection/) for the full composite-status behavior.
![A flaky, auto-quarantined test with CI passing. A broken-type monitor fires and reclassifies it as BROKEN. Because broken tests are not quarantine candidates, it drops out of auto-quarantine and its failures block CI again.]() ## Alert every time a monitor flags a test
Use this when you want to know about every detection event on a test, including the ones that don't change its overall status (a second monitor piling on, or a labeling monitor surfacing a new pattern).
**1. Subscribe to `test_case.monitor_status_changed`.** On your Slack endpoint, enable this event in addition to (or instead of) `v2.test_case.status_changed`.
**2. Filter to monitor activations.** The event fires on both activation and resolution, so cancel the webhook unless a monitor is becoming active:
```javascript theme={null}
function handler(webhook) {
const { monitor } = webhook.payload;
// Only alert when a monitor starts flagging the test.
if (!monitor || monitor.status !== "active") {
webhook.cancel = true;
return webhook;
}
webhook.payload = {
blocks: [
{
type: "header",
text: { type: "plain_text", text: `Monitor active: ${webhook.payload.test_case.name}` },
},
{
type: "section",
text: {
type: "mrkdwn",
text: [
`Monitor type: \`${monitor.type}\``,
`Test Details: ${webhook.payload.test_case.html_url}`,
].join("\n"),
},
},
],
};
return webhook;
}
```
Because `test_case.monitor_status_changed` fires for every monitor independently, this catches a test that keeps tripping new monitors over time, even while its headline status stays `FLAKY`. The `monitor.type` field tells you which monitor fired, so you can branch on it: route [labeling monitors](../management/test-labels#automatic-labeling-from-monitors) to a triage channel and health classification monitors to your on-call channel.
## Alert every time a monitor flags a test
Use this when you want to know about every detection event on a test, including the ones that don't change its overall status (a second monitor piling on, or a labeling monitor surfacing a new pattern).
**1. Subscribe to `test_case.monitor_status_changed`.** On your Slack endpoint, enable this event in addition to (or instead of) `v2.test_case.status_changed`.
**2. Filter to monitor activations.** The event fires on both activation and resolution, so cancel the webhook unless a monitor is becoming active:
```javascript theme={null}
function handler(webhook) {
const { monitor } = webhook.payload;
// Only alert when a monitor starts flagging the test.
if (!monitor || monitor.status !== "active") {
webhook.cancel = true;
return webhook;
}
webhook.payload = {
blocks: [
{
type: "header",
text: { type: "plain_text", text: `Monitor active: ${webhook.payload.test_case.name}` },
},
{
type: "section",
text: {
type: "mrkdwn",
text: [
`Monitor type: \`${monitor.type}\``,
`Test Details: ${webhook.payload.test_case.html_url}`,
].join("\n"),
},
},
],
};
return webhook;
}
```
Because `test_case.monitor_status_changed` fires for every monitor independently, this catches a test that keeps tripping new monitors over time, even while its headline status stays `FLAKY`. The `monitor.type` field tells you which monitor fired, so you can branch on it: route [labeling monitors](../management/test-labels#automatic-labeling-from-monitors) to a triage channel and health classification monitors to your on-call channel.
To route by pattern without changing a test's health status, set a monitor's action to **Apply labels**, then branch on `monitor.type` in your transform to send those activations wherever they belong. See [Test Labels](../management/test-labels) for the full setup.
## Related
* [Integration for Slack](../webhooks/slack-integration). The Slack connection these transformations build on.
* [Webhooks](../webhooks/index). The full event catalog and field reference.
* [Flake Detection](../detection/). How monitors classify tests as flaky or broken.
* [Test Labels](../management/test-labels). Apply and route labels with monitors.
# Flaky Tests API
Source: https://docs.trunk.io/flaky-tests/reference/api-reference
REST API for checking Trunk service status and fetching unhealthy or quarantined tests in your project.
The Trunk Flaky Tests API provides access to check the status of Trunk services and fetch [unhealthy](../detection/) or [quarantined](../quarantining/) tests in your project. The API is an HTTP REST API, returns JSON from all requests, and uses standard HTTP response codes.
All requests must be [authenticated](../../setup-and-administration/apis/#authentication) by providing the `x-api-token` header.
# CLI Reference
Source: https://docs.trunk.io/flaky-tests/reference/cli-reference
CLI tool for uploading test results to Trunk from CI, enabling flaky test detection and quarantining.
Trunk detects and tracks flaky tests in your repos by receiving uploads from your test runs in CI, uploaded from the Trunk Analytics CLI. These uploads happen in the CI jobs used to run tests in your nightly CI, post-commit jobs, and PR checks.
## Guides
If you're setting up Trunk Flaky Tests for the first time, you can follow the guides for your CI provider and test framework.
The CLI should be **downloaded as part of your test workflow** in your CI system. You can download the appropriate binary for your platform directly from the [GitHub releases page](https://github.com/trunk-io/analytics-cli/releases).
## Manual Download
You can find the list of releases on [the GitHub release page](https://github.com/trunk-io/analytics-cli/releases). We provide executables for Linux and OS X. It’s a single file inside a tar and upon downloading the tar you will find a single binary - `trunk-analytics-cli` to use.
```bash Linux (x64) theme={null}
SKU="trunk-analytics-cli-x86_64-unknown-linux.tar.gz"
curl -fL --retry 3 \
"https://github.com/trunk-io/analytics-cli/releases/latest/download/${SKU}" \
| tar -xz
chmod +x trunk-analytics-cli
```
```bash Linux (arm64) theme={null}
SKU="trunk-analytics-cli-aarch64-unknown-linux.tar.gz"
curl -fL --retry 3 \
"https://github.com/trunk-io/analytics-cli/releases/latest/download/${SKU}" \
| tar -xz
chmod +x trunk-analytics-cli
```
```bash macOS (arm64) theme={null}
SKU="trunk-analytics-cli-aarch64-apple-darwin.tar.gz"
curl -fL --retry 3 \
"https://github.com/trunk-io/analytics-cli/releases/latest/download/${SKU}" \
| tar -xz
chmod +x trunk-analytics-cli
```
```bash macOS (x64) theme={null}
SKU="trunk-analytics-cli-x86_64-apple-darwin.tar.gz"
curl -fL --retry 3 \
"https://github.com/trunk-io/analytics-cli/releases/latest/download/${SKU}" \
| tar -xz
chmod +x trunk-analytics-cli
```
## Organization Slug and Token
The CLI requires your Trunk organization slug and token passed through `--org-url-slug` and `--token` to upload results to the correct organization. They can alternatively be set via environment variables, `TRUNK_ORG_URL_SLUG` and `TRUNK_API_TOKEN`, respectively.
You can find your organization slug and token by navigating to **Settings** → **Organization** → **General**.
Your organization slug is the tail of your dashboard URL (`app.trunk.io/`). It defaults to your organization name with spaces replaced by hyphens. To change it, contact [help@trunk.io](mailto:help@trunk.io).
![]()
![]()
![]()
![]()
## Uploading Test Results
The uploaded tests are processed by Trunk periodically, not in real-time. Wait for at least an hour after the initial upload before they’re displayed in the [Uploads tab](/flaky-tests/get-started/#id-4.-confirm-your-configuration-analyze-your-dashboard). Multiple uploads are required before a test can be accurately detected as flaky.
Trunk accepts uploads in three main report formats, [XML](https://github.com/testmoapp/junitxml), [Bazel Event Protocol JSONs](https://bazel.build/remote/bep#consuming-bep-text-json), and XCode XCResult paths. You can upload each of these test report formats using the `./trunk-analytics-cli upload` command like this:
Trunk can accept JUnit XMLs through the `--junit-paths` argument:
```
./trunk-analytics-cli upload --junit-paths "test_output.xml" \
--org-url-slug \
--token $TRUNK_API_TOKEN
```
Trunk can accept Bazel through the `--bazel-bep-path` argument:
```
./trunk-analytics-cli upload --bazel-bep-path \
--org-url-slug \
--token $TRUNK_API_TOKEN
```
Trunk can accept XCode through the `--xcresult-path` argument:
```
./trunk-analytics-cli upload --xcresult-path \
--org-url-slug \
--token $TRUNK_API_TOKEN
```
## Variants
If you run the same tests across different environments or architectures, you can use variants to separate these runs into distinct test cases. This allows Trunk to detect environment-specific flakes.
For example, a test for a mobile app might be flaky on iOS but stable on Android. Using variants, Trunk can isolate flakes on the iOS variant instead of marking the test as flaky across all environments.
You can specify a variant during upload using the `--variant` option:
```sh Upload an iOS variant theme={null}
./trunk-analytics-cli upload --junit-paths "test_output.xml" \
--org-url-slug \
--token $TRUNK_API_TOKEN \
--variant ios
```
Variant names are displayed in brackets next to test names in your dashboard:
![]()
![]() ## Running and Quarantining Tests
You can also execute tests and upload results to Trunk in a single step using the `test` command to **wrap** your test command.
This is especially useful for [Quarantining](../quarantining/), where the Trunk Analytics CLI will **override the exit code** of the test command if all failures can be quarantined, **preventing** flaky tests from failing your builds in CI.
## Running and Quarantining Tests
You can also execute tests and upload results to Trunk in a single step using the `test` command to **wrap** your test command.
This is especially useful for [Quarantining](../quarantining/), where the Trunk Analytics CLI will **override the exit code** of the test command if all failures can be quarantined, **preventing** flaky tests from failing your builds in CI.
Trunk can accept JUnit XMLs through the `--junit-paths` argument:
```
./trunk-analytics-cli test --junit-paths "test_output.xml" \
--org-url-slug \
--token $TRUNK_API_TOKEN \
```
Trunk can accept Bazel through the `--bazel-bep-path` argument:
```
./trunk-analytics-cli test --bazel-bep-path \
--org-url-slug \
--token $TRUNK_API_TOKEN \
```
Trunk can accept XCode through the `--xcresult-path` argument:
```
./trunk-analytics-cli test --xcresult-path \
--org-url-slug \
--token $TRUNK_API_TOKEN \
```
### Service Availability and Graceful Degradation
Trunk Analytics CLI is designed to fail safe when our quarantine service is unavailable. Read more at [Quarantine Service Availability](../quarantining/quarantine-service-availability)
### Upload failure vs test failure
We use the `SOFTWARE` exit code (70) if the upload fails.
If you use the `test` command and tests fail without the failures being quarantined, we return the provided exit code from the wrapped execution.
If you use the `upload` command, we return exit code `FAILURE` or the exit code provided with the `--test_process_exit_code` argument.
## Validating reports locally
You can validate the test reports produced by your test frameworks before you set up Trunk in your CI jobs. This is currently **only available for XML reports**.
You can run the validate command like this:
```
./trunk-analytics-cli validate --junit-paths "test_output.xml"
```
The `validate` command will output any problems with your reports so you can address them before setting up Trunk in CI.
```sh theme={null}
Validating the following 1 files:
File set matching junit.xml:
junit.xml
junit.xml - 1 test suites, 0 test cases, 0 validation errors
✅ 1 file found, all fully correct
Navigate to https://app.trunk.io/onboarding?intent=flaky+tests to continue using Trunk Flaky Tests!
```
## Using custom CI systems
The CLI is preconfigured to work with a set [ci-providers](/flaky-tests/get-started/ci-providers/) but can be used with any CI system by passing [#environment-variables](/flaky-tests/get-started/ci-providers/otherci#environment-variables) to the uploader.
> More information on using [otherci.md](/flaky-tests/get-started/ci-providers/otherci) is documented here.
## Full command reference
The `trunk` command-line tool can upload and analyze test results. The `trunk-analytics-cli` command accepts the following subcommands:
| Command | Description |
| ------------------------------------ | ---------------------------------------------------------------------------------------------------------------------------------------------------------------------------------------------------- |
| `trunk-analytics-cli upload` | Upload data to Trunk Flaky Tests. |
| `trunk-analytics-cli validate` | Validates if the provided JUnit XML files and prints any errors. |
| `trunk-analytics-cli test ` | Runs tests using the provided command, uploads results, checks whether the failures are [quarantined](../quarantining/#using-the-trunk-cli-directly) tests, and correct the exit code based on that. |
The `upload` and `test` commands accept the following options:
| Argument | Description |
| --------------------------------------------------- | ------------------------------------------------------------------------------------------------------------------------------------------------------------------------------------------------------------------------------------------------------------------------------------------------------- |
| `--junit-paths ` | Path to the test output files. File globs are supported. Remember to wrap globs in `""` quotes |
| `--bazel-bep-path ` | Path to a JSON serialized [Bazel Build Event Protocol](https://bazel.build/remote/bep). Trunk will use the BEP file to locate test reports. Your test frameworks must still output [compatible report formats](/flaky-tests/get-started/frameworks/). |
| `--xcresult-path ` | Path to a `.xcresult` directory, which contains test reports from `xcodebuild`. |
| `--org-url-slug ` | Trunk Organization slug, from the Settings page. |
| `--token ` | Trunk Organization (not repo) token, from the Settings page. Defaults to the `TRUNK_API_TOKEN` variable. |
| `-h, --help` | Additional detailed description of the `upload` command. |
| `--repo-root` | Path to the repository root. Defaults to the current directory. |
| `--repo-url ` | Value to override URL of repository. **Optional**. |
| `--repo-head-sha` `` | Value to override SHA of repository head. **Optional**. |
| `--repo-head-branch ` | Value to override branch of repository head. **Optional**. |
| `--repo-head-commit-epoch ` | Value to override commit epoch of repository head. **Optional**. |
| `--codeowners-path ` | Value to override CODEOWNERS file or directory path. **Optional**. |
| `--use-bazel-target-for-codeowners` | When uploading a Bazel BEP file, use the Bazel target as a fallback path to associate test cases to codeowners. **Optional**. |
| `--allow-empty-test-results` | Don't fail commands if test results are empty or missing. Use it when you sometimes skip all tests for certain CI jobs. Defaults to `true`. |
| `--variant ` | Upload tests to a specific variant group. **Optional**. |
| `--test-process-exit-code` `` | Specify the exit code of the test previously run. This is used by the upload command to identify errors that happen outside of the context of the test execution (such as build errors). |
| `--dry-run` | Write the test results bundle to a local `./bundle_upload` directory instead of uploading it to Trunk. [Quarantining](../quarantining/#quarantining-without-uploading) still runs and still determines the exit code. Can also be set with the `TRUNK_DRY_RUN=true` environment variable. **Optional**. |
**Memory Overhead**
Running tests via `trunk-analytics-cli test` adds negligible memory overhead.
This subcommand is a thin wrapper around your existing test command and doesn't modify or parallelize test execution.
During execution, it:
* Runs your provided test command directly.
* Records start and end times.
* Captures the exit code for quarantine decisions.
You can safely run the CLI even with large or memory-intensive suites, without risking additional OOMs in your CI agents.
# Reference
Source: https://docs.trunk.io/flaky-tests/reference/index
Reference documentation for Flaky Tests APIs, CLI commands, and MCP tools.
# Bearer Authentication
Source: https://docs.trunk.io/flaky-tests/reference/mcp-reference/configuration/bearer-auth
Add Trunk's MCP Server via Bearer Authentication
You can leverage Trunk's MCP server for all of your agentic needs. When using the MCP in cloud environments, authenticate using Bearer Authentication.
## API Token
Retrieve your organization's API token from the settings page in the web app, e.g. `https://app.trunk.io//settings`.
## Authorization Header
Set the following header when connecting to the MCP `https://mcp.trunk.io/mcp`:
| Header Key | Header Value |
| --------------- | ---------------- |
| `Authorization` | `Bearer ` |
# Claude Code (CLI)
Source: https://docs.trunk.io/flaky-tests/reference/mcp-reference/configuration/claude-code-cli
Add Trunk's MCP Server to Claude Code
## CLI setup
Run the following command to add the MCP server configuration. If you want to only enable it for yourself, use `--scope user` instead.
```bash theme={null}
claude mcp add --transport http trunk https://mcp.trunk.io/mcp --scope project
```
Once completed, reopen Claude Code.
## Alternative: Update MCP configuration
Add the following [configuration](https://docs.anthropic.com/en/docs/claude-code/mcp) to your project's `.mcp.json` file.
```json theme={null}
{
"mcpServers": {
"trunk": {
"url": "https://mcp.trunk.io/mcp",
"type": "http"
}
}
}
```
## Authentication with OAuth (default)
After the MCP server was added to Claude Code, users need to authorize to communicate with the server. Follow these steps to complete auth.
**Step 1: Start Claude Code CLI**
In your terminal, run `claude` .
**Step 2: Run the mcp command**
Claude Code should recognize that auth is required. Run `/mcp` to authenticate, select trunk, and hit Enter:
![]() **Step 3: Login & authorize**
A new webpage will be opened. Log in with your Trunk account and follow the instructions to authorize Claude Code to communicate with the MCP server.
**Step 4: Confirm**
Follow instructions to get back to Claude Code. A confirmation should be shown:
```
Authentication successful. Connected to trunk.
```
**With auth completed, Claude Code will be able to fetch the tools exposed by Trunk's MCP server.**
## Alternative: Authentication with API token
If you are in a CI or headless environment, or prefer not to use the OAuth browser flow, you can authenticate with your Trunk organization API token instead.
Find your token under **Settings** → **Organization** → **General**, in the **API** section of the Trunk dashboard, then add it to your `.mcp.json`:
```json theme={null}
{
"mcpServers": {
"trunk": {
"url": "https://mcp.trunk.io/mcp",
"type": "http",
"headers": {
"Authorization": "Bearer ${TRUNK_API_TOKEN}"
}
}
}
}
```
Set the `TRUNK_API_TOKEN` environment variable to your org API token. Claude Code interpolates environment variables in MCP configuration files automatically.
# Claude Code Plugin
Source: https://docs.trunk.io/flaky-tests/reference/mcp-reference/configuration/claude-code-plugin
Install the Trunk plugin for Claude Code
The Trunk plugin for Claude Code bundles the MCP server connection, slash commands, and skills into a single install. This is the recommended way to connect Trunk to Claude Code.
## Install the Plugin
First, add the [community plugins marketplace](https://github.com/anthropics/claude-plugins-community) if you haven't already:
```
claude plugin marketplace add anthropics/claude-plugins-community
```
Then install the Trunk plugin:
```
claude plugin install trunk@claude-community
```
This gives you access to the MCP server connection, slash commands, and skills that activate automatically.
**Step 3: Login & authorize**
A new webpage will be opened. Log in with your Trunk account and follow the instructions to authorize Claude Code to communicate with the MCP server.
**Step 4: Confirm**
Follow instructions to get back to Claude Code. A confirmation should be shown:
```
Authentication successful. Connected to trunk.
```
**With auth completed, Claude Code will be able to fetch the tools exposed by Trunk's MCP server.**
## Alternative: Authentication with API token
If you are in a CI or headless environment, or prefer not to use the OAuth browser flow, you can authenticate with your Trunk organization API token instead.
Find your token under **Settings** → **Organization** → **General**, in the **API** section of the Trunk dashboard, then add it to your `.mcp.json`:
```json theme={null}
{
"mcpServers": {
"trunk": {
"url": "https://mcp.trunk.io/mcp",
"type": "http",
"headers": {
"Authorization": "Bearer ${TRUNK_API_TOKEN}"
}
}
}
}
```
Set the `TRUNK_API_TOKEN` environment variable to your org API token. Claude Code interpolates environment variables in MCP configuration files automatically.
# Claude Code Plugin
Source: https://docs.trunk.io/flaky-tests/reference/mcp-reference/configuration/claude-code-plugin
Install the Trunk plugin for Claude Code
The Trunk plugin for Claude Code bundles the MCP server connection, slash commands, and skills into a single install. This is the recommended way to connect Trunk to Claude Code.
## Install the Plugin
First, add the [community plugins marketplace](https://github.com/anthropics/claude-plugins-community) if you haven't already:
```
claude plugin marketplace add anthropics/claude-plugins-community
```
Then install the Trunk plugin:
```
claude plugin install trunk@claude-community
```
This gives you access to the MCP server connection, slash commands, and skills that activate automatically.
You can also install from the plugin repository URL:
```
/plugin install trunk@https://github.com/trunk-io/claude-code-plugin
```
This is useful if you want to pin to a specific version or test changes before publishing a new release.
## Authentication
After installing, Claude Code will prompt you to authenticate with Trunk on first use.
1. Run any Trunk command (e.g., `/trunk:fix-flaky`) or trigger an MCP tool call
2. Claude Code will open a browser window for OAuth login
3. Log in with your Trunk account and authorize the connection
4. You'll see `Authentication successful. Connected to trunk.` back in the terminal
## Slash Commands
| Command | What it does |
| ------------------------------ | ------------------------------------------------------------------------------------ |
| `/trunk:fix-flaky ` | Retrieves root cause analysis for a flaky test and offers to apply the fix |
| `/trunk:why-flaky ` | Explains why a test is flaky without making changes — good for triage |
| `/trunk:setup-uploads` | Detects your test framework and CI provider, then generates the upload configuration |
### Fix a flaky test
```
/trunk:fix-flaky test_user_login
```
Trunk analyzes the test, explains the root cause (race condition, shared state, time dependency, etc.), and shows a proposed fix with a diff. Confirm to apply the changes directly.
### Understand why a test is flaky
```
/trunk:why-flaky test_payment_processing
```
Same analysis as `fix-flaky`, but read-only. Useful when you want to understand the problem before deciding how to handle it — especially for tests you didn't write.
### Set up test uploads
```
/trunk:setup-uploads
```
Walks through configuring your repo to upload test results to Trunk. The plugin detects your CI provider and test framework automatically, then generates ready-to-paste config snippets.
## Skills
The plugin includes two skills that activate automatically based on context:
**Flaky test patterns** — activates when you're debugging or writing tests. Provides common flaky test patterns and proven fixes so Claude Code can reference them without you asking.
**Trunk CI setup** — activates when you're editing CI configuration files (`.github/workflows/`, `.circleci/config.yml`, etc.). Provides best practices for test upload configuration.
## Also Available For
* [Cursor](./cursor-ide) (one-click install)
* [GitHub Copilot](./github-copilot-ide) (one-click install)
* [Gemini CLI](./gemini-cli)
* [Any MCP client](https://github.com/trunk-io/mcp-server) — manual configuration
# Cursor (IDE)
Source: https://docs.trunk.io/flaky-tests/reference/mcp-reference/configuration/cursor-ide
Add Trunk's MCP Server to Cursor
## One-click setup
Use the "Add to Cursor" action to add the Trunk MCP server:
![Add trunk MCP server to Cursor]()
Once clicked, follow instructions to open the MCP configuration in Cursor. A new settings window to confirm the installation of the MCP server will be shown. Click on "Install" to proceed.
![]() ## Alternative: Update MCP configuration
Add the following [configuration](https://docs.cursor.com/en/context/mcp#model-context-protocol-mcp) to your project's `.cursor/mcp.json` file. If you want to enable it only for yourself, add it to `~/.cursor/mcp.json` instead.
```json theme={null}
{
"mcpServers": {
"trunk": {
"url": "https://mcp.trunk.io/mcp"
}
}
}
```
## Authentication with OAuth (default)
After the MCP server was added to Cursor, users need to authorize Cursor to communicate with the server. Follow these steps to complete auth.
**Step 1: Open MCP Settings**
Run `CMD+Shift+P` to open the command palette and select `View: Open MCP Settings`
**Step 2: Enable the Trunk MCP server**
A "Needs authentication" status will be shown:
## Alternative: Update MCP configuration
Add the following [configuration](https://docs.cursor.com/en/context/mcp#model-context-protocol-mcp) to your project's `.cursor/mcp.json` file. If you want to enable it only for yourself, add it to `~/.cursor/mcp.json` instead.
```json theme={null}
{
"mcpServers": {
"trunk": {
"url": "https://mcp.trunk.io/mcp"
}
}
}
```
## Authentication with OAuth (default)
After the MCP server was added to Cursor, users need to authorize Cursor to communicate with the server. Follow these steps to complete auth.
**Step 1: Open MCP Settings**
Run `CMD+Shift+P` to open the command palette and select `View: Open MCP Settings`
**Step 2: Enable the Trunk MCP server**
A "Needs authentication" status will be shown:
![]() **Step 3: Login & authorize**
A new webpage will be opened. Login with your Trunk account and follow instructions to authorize Cursor to communicate with the MCP server.
**Step 4: Confirm**
Follow instructions to get back to Cursor. With auth completed, Cursor will be able to fetch the tools exposed by Trunk's MCP server:
**Step 3: Login & authorize**
A new webpage will be opened. Login with your Trunk account and follow instructions to authorize Cursor to communicate with the MCP server.
**Step 4: Confirm**
Follow instructions to get back to Cursor. With auth completed, Cursor will be able to fetch the tools exposed by Trunk's MCP server:
![]() ## Alternative: Authentication with API token
If you prefer not to use the OAuth flow, you can authenticate with your Trunk organization API token. Find your token under **Settings** → **Organization** → **General**, in the **API** section of the Trunk dashboard.
Add the token to your `.cursor/mcp.json`:
```json theme={null}
{
"mcpServers": {
"trunk": {
"url": "https://mcp.trunk.io/mcp",
"headers": {
"Authorization": "Bearer ${TRUNK_API_TOKEN}"
}
}
}
}
```
Set `TRUNK_API_TOKEN` as an environment variable. Cursor interpolates environment variables in MCP configuration files automatically.
# Gemini (CLI)
Source: https://docs.trunk.io/flaky-tests/reference/mcp-reference/configuration/gemini-cli
Add Trunk's MCP Server to Gemini
## CLI setup
Run the following command to add the MCP server configuration. If you want to only enable it for yourself, use `--scope user` instead.
```bash theme={null}
gemini mcp add --transport http trunk https://mcp.trunk.io/mcp --scope project
```
Once completed, reopen Gemini.
## Alternative: Update MCP configuration
Add the following [configuration](https://github.com/google-gemini/gemini-cli/blob/v0.1.19/docs/tools/mcp-server.md#oauth-support-for-remote-mcp-servers) to your project's `.gemini/settings.json` file.
```json theme={null}
{
"mcpServers": {
"trunk": {
"httpUrl": "https://mcp.trunk.io/mcp"
}
}
}
```
## Authentication with OAuth (default)
After the MCP server was added to Gemini, users need to authorize to communicate with the server. Follow these steps to complete auth.
**Step 1: Start Gemini CLI**
In your terminal, run `gemini` .
**Step 2: Run the mcp auth command**
Run `/mcp auth trunk` to initiate the authentication and authorization flow.
**Step 3: Login & authorize**
A new webpage will be opened. Log in with your Trunk account and follow the instructions to authorize Gemini to communicate with the MCP server.
**Step 4: Confirm**
Follow instructions to get back to Gemini. A confirmation should be shown:
```
ℹ✅ Successfully authenticated with MCP server 'trunk'!
ℹRe-discovering tools from 'trunk'...
ℹSuccessfully authenticated and refreshed tools for 'trunk'.
```
**With auth completed, Gemini will be able to fetch the tools exposed by Trunk's MCP server.**
## Alternative: Authentication with API token
If you prefer not to use the OAuth flow, you can authenticate with your Trunk organization API token. Find your token under **Settings** → **Organization** → **General**, in the **API** section of the Trunk dashboard.
Add the token to your `.gemini/settings.json`:
```json theme={null}
{
"mcpServers": {
"trunk": {
"httpUrl": "https://mcp.trunk.io/mcp",
"headers": {
"Authorization": "Bearer ${TRUNK_API_TOKEN}"
}
}
}
}
```
Set `TRUNK_API_TOKEN` as an environment variable. Gemini CLI interpolates environment variables in MCP configuration files automatically.
# GitHub Copilot (IDE)
Source: https://docs.trunk.io/flaky-tests/reference/mcp-reference/configuration/github-copilot-ide
Add Trunk's MCP Server to GitHub Copilot
## One-click setup
Use the "Add to VS Code" action to add the Trunk MCP server
## Alternative: Authentication with API token
If you prefer not to use the OAuth flow, you can authenticate with your Trunk organization API token. Find your token under **Settings** → **Organization** → **General**, in the **API** section of the Trunk dashboard.
Add the token to your `.cursor/mcp.json`:
```json theme={null}
{
"mcpServers": {
"trunk": {
"url": "https://mcp.trunk.io/mcp",
"headers": {
"Authorization": "Bearer ${TRUNK_API_TOKEN}"
}
}
}
}
```
Set `TRUNK_API_TOKEN` as an environment variable. Cursor interpolates environment variables in MCP configuration files automatically.
# Gemini (CLI)
Source: https://docs.trunk.io/flaky-tests/reference/mcp-reference/configuration/gemini-cli
Add Trunk's MCP Server to Gemini
## CLI setup
Run the following command to add the MCP server configuration. If you want to only enable it for yourself, use `--scope user` instead.
```bash theme={null}
gemini mcp add --transport http trunk https://mcp.trunk.io/mcp --scope project
```
Once completed, reopen Gemini.
## Alternative: Update MCP configuration
Add the following [configuration](https://github.com/google-gemini/gemini-cli/blob/v0.1.19/docs/tools/mcp-server.md#oauth-support-for-remote-mcp-servers) to your project's `.gemini/settings.json` file.
```json theme={null}
{
"mcpServers": {
"trunk": {
"httpUrl": "https://mcp.trunk.io/mcp"
}
}
}
```
## Authentication with OAuth (default)
After the MCP server was added to Gemini, users need to authorize to communicate with the server. Follow these steps to complete auth.
**Step 1: Start Gemini CLI**
In your terminal, run `gemini` .
**Step 2: Run the mcp auth command**
Run `/mcp auth trunk` to initiate the authentication and authorization flow.
**Step 3: Login & authorize**
A new webpage will be opened. Log in with your Trunk account and follow the instructions to authorize Gemini to communicate with the MCP server.
**Step 4: Confirm**
Follow instructions to get back to Gemini. A confirmation should be shown:
```
ℹ✅ Successfully authenticated with MCP server 'trunk'!
ℹRe-discovering tools from 'trunk'...
ℹSuccessfully authenticated and refreshed tools for 'trunk'.
```
**With auth completed, Gemini will be able to fetch the tools exposed by Trunk's MCP server.**
## Alternative: Authentication with API token
If you prefer not to use the OAuth flow, you can authenticate with your Trunk organization API token. Find your token under **Settings** → **Organization** → **General**, in the **API** section of the Trunk dashboard.
Add the token to your `.gemini/settings.json`:
```json theme={null}
{
"mcpServers": {
"trunk": {
"httpUrl": "https://mcp.trunk.io/mcp",
"headers": {
"Authorization": "Bearer ${TRUNK_API_TOKEN}"
}
}
}
}
```
Set `TRUNK_API_TOKEN` as an environment variable. Gemini CLI interpolates environment variables in MCP configuration files automatically.
# GitHub Copilot (IDE)
Source: https://docs.trunk.io/flaky-tests/reference/mcp-reference/configuration/github-copilot-ide
Add Trunk's MCP Server to GitHub Copilot
## One-click setup
Use the "Add to VS Code" action to add the Trunk MCP server
![Add trunk MCP server to VS Code]()
### Command Palette setup
Run `CMD+Shift+P` to open the Command Palette and select `MCP: Add Server`. Select `HTTP` and input `https://mcp.trunk.io/mcp`. Set the name to `trunk`.
A new window will open to confirm the MCP configuration. It should show:
```json theme={null}
{
"servers": {
"trunk": {
"url": "https://mcp.trunk.io/mcp",
"type": "http"
}
},
"inputs": []
}
```
### Alternative: Update MCP configuration
Add the following [configuration](https://code.visualstudio.com/docs/copilot/chat/mcp-servers) to your project's `.vscode/mcp.json` file.
```json theme={null}
{
"mcpServers": {
"trunk": {
"url": "https://mcp.trunk.io/mcp",
"type": "http"
}
}
}
```
### Authentication with OAuth (default)
After the MCP server was added, users need to authorize GitHub Copilot to communicate with the server. Follow these steps to complete auth.
**Step 1: Start MCP server**
Run `CMD+Shift+P` to open the Command Palette and select `MCP: List Servers`. Select `trunk` and select `Start Server` to authenticate.
**Step 2: Login & authorize**
A new webpage will be opened. Login with your Trunk account and follow instructions to authorize GitHub Copilot to communicate with the MCP server.
**Step 3: Confirm**
Follow instructions to get back to GitHub Copilot. With auth completed, GitHub Copilot will be able to fetch the tools exposed by Trunk's MCP server.
```
2025-09-10 12:49:16.975 [info] Discovered 2 tools
```
### Alternative: Authentication with API token
If you prefer not to use the OAuth flow, you can authenticate with your Trunk organization API token. Find your token under **Settings** → **Organization** → **General**, in the **API** section of the Trunk dashboard.
Add the token to your `.vscode/mcp.json`:
```json theme={null}
{
"mcpServers": {
"trunk": {
"url": "https://mcp.trunk.io/mcp",
"type": "http",
"headers": {
"Authorization": "Bearer ${env:TRUNK_API_TOKEN}"
}
}
}
}
```
VS Code uses `${env:VARIABLE_NAME}` syntax for environment variable interpolation in MCP configuration files, unlike other clients which use `${VARIABLE_NAME}`.
# Configuration
Source: https://docs.trunk.io/flaky-tests/reference/mcp-reference/configuration/index
Configure your AI application to connect to the Trunk MCP server for flaky test insights and setup assistance.
# Fix Flaky Test
Source: https://docs.trunk.io/flaky-tests/reference/mcp-reference/fix-flaky-test
MCP tool reference: fix-flaky-test
## Overview
The `fix-flaky-test` tool retrieves insights and historical failure analysis about a flaky test. This tool allows AI assistants to access investigation results and apply fixes directly in your development environment. For more information, see [Autofix Flaky Tests](../../agents/autofix-flaky-tests).
**Return Type:** Structured analysis data with fix recommendations. Structure: metadata, summary, facts
## Parameters
### Required Parameters
| Parameter | Type | Description |
| ---------- | ------ | --------------------------------------------------------------- |
| `repoName` | string | Repository name in `owner/repo` format (e.g., `trunk-io/trunk`) |
You must also provide either `investigationId` or `testCaseId`.
### Optional Parameters
| Parameter | Type | Description |
| ------------------------ | ------- | ------------------------------------------------------------------------------------------ |
| `orgSlug` | string | The name of your organization in the Trunk app |
| `investigationId` | string | Specific fix identifier from a previous investigation query. Provide this or `testCaseId`. |
| `testCaseId` | string | UUID of the test case to retrieve investigations for. Provide this or `investigationId`. |
| `createNewInvestigation` | boolean | Whether or not to trigger a new investigation (may take up to 1 minute) |
## Getting Parameter Values
If your AI assistant doesn't have direct access to Git information, use these commands:
**Get repository name:**
```bash theme={null}
git remote -v
```
Look for the repository name in the output (e.g., `trunk-io/trunk` from `git@github.com:trunk-io/trunk.git`)
## Usage Examples
### With Test ID
```
Fix the flaky test with ID
```
### Create New Investigation
```
Run a new analysis to help me fix flaky test with ID
```
### With Existing Investigation
```
Retrieve the investigation for test with investigationId
```
## Error Handling
| Error | Cause | Resolution |
| ----------------------------------------------------------------------------------------------- | ------------------------------------------------------- | ------------------------------------------------------------------------------------------------------------- |
| `Investigation {investigationId} not found` | Invalid or non-existent fix ID | Verify the investigationId from the previous query |
| `Please provide either \`investigationId\` or \`testCaseId\`.\` | Neither `investigationId` nor `testCaseId` was provided | Provide one of `investigationId` or `testCaseId` |
| `This investigation was skipped before producing a completed summary.` | Investigation was skipped | The setting may be disabled, revisit prerequisites in [Autofix Flaky Tests](../../agents/autofix-flaky-tests) |
| `This investigation failed before producing a completed summary. Please contact Trunk support.` | Investigation error | This feature is still in Beta, please contact support |
| Repository authorization error | Insufficient permissions or invalid repo name | Verify repository name format and your access permissions |
# Use MCP Server
Source: https://docs.trunk.io/flaky-tests/reference/mcp-reference/index
Use the Trunk MCP server from your IDE or AI application to access flaky test insights and configure test uploads
Trunk Flaky Tests includes a [Model Context Protocol (MCP)](https://modelcontextprotocol.io/docs/getting-started/intro) server. AI applications like Claude Code or Cursor can use MCP servers to connect to data sources, tools, and workflows, enabling them to access key information and perform tasks.
## Supported AI applications
The following applications are currently supported: Cursor, Claude Code, Gemini CLI, and GitHub Copilot.
Gemini Code Assist and Windsurf are not supported due to their limited support for MCP servers
## API
The Trunk MCP server is available at `https://mcp.trunk.io/mcp` and exposes the following tools:
| Tool | Capability |
| ---------------------------------------------------- | ----------------------------------------------------------- |
| [`search-test`](./search-test) | Experimental: Lookup the id of a test case |
| [`fix-flaky-test`](./fix-flaky-test) | Experimental: Retrieve insights around a failing/flaky test |
| [`investigate-ci-failure`](./investigate-ci-failure) | Experimental: Retrieve failing test logs from a CI run |
| [`setup-trunk-uploads`](./set-up-test-uploads) | Create a setup plan to upload test results |
## Authorization
The Trunk MCP server supports two authentication methods.
**OAuth (default)**
OAuth 2.0 + OpenID Connect is the default. MCP clients that support the [MCP authorization spec](https://modelcontextprotocol.io/specification/2025-03-26/basic/authorization) will initiate the OAuth flow automatically. Most interactive clients (Cursor, Claude Code, GitHub Copilot) use this path.
**API token**
As an alternative, you can authenticate with your Trunk organization API token. This is useful for MCP clients that do not support OAuth, CI/headless environments, or quick manual setup.
Find your token under **Settings** → **Organization** → **General**, in the **API** section of the Trunk dashboard. Pass it as a Bearer token in the `Authorization` header:
```json theme={null}
{
"mcpServers": {
"trunk": {
"url": "https://mcp.trunk.io/mcp",
"headers": {
"Authorization": "Bearer "
}
}
}
}
```
API token auth is org-level — all requests are attributed to the organization rather than to a specific user. OAuth remains the preferred method for interactive use because it provides user-level identity.
## Get started
**To get started, configure your AI application to communicate with Trunk's MCP server:**
* [Cursor](./configuration/cursor-ide)
* [GitHub Copilot](./configuration/github-copilot-ide)
* [Claude Code CLI](./configuration/claude-code-cli)
* [Gemini CLI](./configuration/gemini-cli)
# Investigate CI Failure
Source: https://docs.trunk.io/flaky-tests/reference/mcp-reference/investigate-ci-failure
MCP tool reference: investigate-ci-failure
## Overview
The `investigate-ci-failure` tool investigates a failing CI run by fetching structured test failure data from Trunk. Given a GitHub Actions workflow URL, this tool looks up test result bundles, parses them to extract test names and error messages, filters out quarantined (known-flaky) tests, and returns structured failure details the agent can act on. For more information, see [Autofix CI Failures](../../agents/autofix-ci-failures).
**Return Type:** Structured failure details with test names, error messages, stdout, and stderr. If the CI job failed before tests ran (build or compilation failure), the tool suggests pulling raw logs from the workflow URL as a fallback.
## Prerequisites
* Your repository must be set up to [upload test results to Trunk](../../get-started/index)
* For best results, [enable quarantining](../../quarantining/) so known-flaky tests are filtered out automatically
## Parameters
### Required Parameters
| Parameter | Type | Description |
| ------------- | ------ | ---------------------------------------------------------------------------------------------- |
| `workflowUrl` | string | The GitHub Actions workflow URL, e.g. `https://github.com/{owner}/{repo}/actions/runs/{runId}` |
### Optional Parameters
| Parameter | Type | Description |
| --------- | ------ | --------------------------------------------------------------------------------- |
| `orgSlug` | string | The Trunk organization slug (used to disambiguate if you belong to multiple orgs) |
## Getting Parameter Values
**Get workflow URL:**
Navigate to your GitHub Actions run and copy the full URL from your browser's address bar. It follows the pattern:
```
https://github.com/{owner}/{repo}/actions/runs/{runId}
```
## Usage Examples
### Investigate a workflow failure
```
Investigate the CI failure at https://github.com/trunk-io/trunk/actions/runs/12345678
```
## What the tool does
* Looks up test result uploads Trunk has received for that run
* Parses the test runs to extract test names, error messages, stdout and stderr
* Filters out quarantined (known-flaky) tests so you only see real failures
* Returns structured failure details you can act on
**When tests didn't run:** If the CI job failed before any tests ran (e.g., a build or compilation failure), the tool will tell you so and suggest pulling raw CI logs directly from the workflow URL as a fallback.
## Error Handling
| Error | Cause | Resolution |
| ----------------------------------------------- | ------------------------------------------------------------ | --------------------------------------------------------------------------------------------------------------------------------------------- |
| `Invalid workflow URL` | Malformed or incorrect workflow URL | Verify the URL follows the pattern `https://github.com/{owner}/{repo}/actions/runs/{runId}` |
| `No test results were uploaded for this CI run` | No test run uploads were uploaded from the provided workflow | Check that the workflow run URL is correct and that it is uploading test results. Compilation and build failures will not upload test results |
| `No test uploads found for this repository` | Repo hasn't configured Trunk test result uploads | Follow setup instructions to [upload test results](../../get-started/index) |
# Search Test
Source: https://docs.trunk.io/flaky-tests/reference/mcp-reference/search-test
MCP tool reference: search-test
## Overview
The `search-test` tool looks up the ID of a test case given its name.
**Return Type:** Metadata about the test, including its ID.
## Parameters
### Required Parameters
| Parameter | Type | Description |
| ---------------- | ------ | --------------------------------------------------------------- |
| `repoName` | string | Repository name in `owner/repo` format (e.g., `trunk-io/trunk`) |
| `testNameSearch` | string | Search string for the test name. Does not include filepaths |
### Optional Parameters
| Parameter | Type | Description |
| --------- | ------ | ---------------------------------------------- |
| `orgSlug` | string | The name of your organization in the Trunk app |
| `limit` | number | Limit for test results to return, up to 20 |
## Getting Parameter Values
If your AI assistant doesn't have direct access to Git information, use these commands:
**Get repository name:**
```bash theme={null}
git remote -v
```
Look for the repository name in the output (e.g., `trunk-io/trunk` from `git@github.com:trunk-io/trunk.git`)
## Usage Examples
### Search
```
What's the test case ID for the test "clear all filters button appears in empty state and clears filters"
```
## Error Handling
| Error | Cause | Resolution |
| ---------------------------------------------------- | --------------------------------------------- | --------------------------------------------------------- |
| `No tests matched {searchString} in repo {repoName}` | No results found | Check your search string and try again |
| Repository authorization error | Insufficient permissions or invalid repo name | Verify repository name format and your access permissions |
# Set up test uploads
Source: https://docs.trunk.io/flaky-tests/reference/mcp-reference/set-up-test-uploads
MCP tool reference: setup-trunk-uploads
## Overview
The `setup-trunk-uploads` tool helps configure test result uploads for Trunk Flaky Tests. This tool provides step-by-step instructions tailored to your specific test framework and CI provider combination.
The tool guides you through a 4-step process:
* **Configure Test Framework** - Modify your test configuration to output JUnit XML reports
* **Run Tests** - Execute at least one test to generate reports
* **Test Upload** - Manually upload a test report to verify connectivity
* **Configure CI** - Set up automated uploads in your CI pipeline
\
**Return Type:** Structured setup plan to generate test reports and upload to Trunk. Structure: project analysis and setup plan
## Parameters
This agent needs to be called **once per test framework** used in your repository. If your repository uses multiple test frameworks (e.g., Jest for frontend, pytest for backend), call this tool once for each framework with the same `ci_provider`.
### Required Parameters
| Parameter | Type | Description |
| --------------- | ------ | -------------------------------------------------------------------------------------------------------------------- |
| `testFramework` | string | The test framework used in your repository (e.g., `jest`, `pytest`, `mocha`) |
| `ciProvider` | string | Your CI provider (e.g., `github`, `circleci`) |
| `orgSlug` | string | Your organization slug. If not provided and you belong to multiple organizations, you'll be prompted to specify one. |
## Supported values
### Test Frameworks
* `android` - Android testing framework
* `bazel` - Bazel test runner
* `behave` - Behave (Python BDD) testing framework
* `cypress` - Cypress end-to-end testing
* `dart-test` - Dart Test framework
* `gotestsum` - Go testing with gotestsum
* `googletest` - GoogleTest (C++) framework
* `gradle` - Gradle test runner
* `jasmine` - Jasmine testing framework
* `jest` - Jest testing framework
* `karma` - Karma test runner
* `kotest` - Kotest (Kotlin) testing framework
* `maven` - Maven Surefire/Failsafe testing
* `minitest` - Ruby minitest framework
* `mocha` - Mocha testing framework
* `nightwatch` - Nightwatch end-to-end testing
* `nunit` - NUnit (.NET) testing framework
* `phpunit` - PHPUnit testing framework
* `playwright` - Playwright testing framework
* `pytest` - Python pytest framework
* `robot-framework` - Robot Framework
* `rspec` - Ruby RSpec testing framework
* `rust` - Rust testing with cargo-nextest
* `swift-testing` - Swift Testing framework
* `vitest` - Vitest testing framework
* `xctest` - Xcode XCTest framework
### CI Providers
* `azure-devops-pipeline` - Azure DevOps Pipelines
* `bitbucket-pipeline` - Bitbucket Pipelines
* `buildkite` - Buildkite pipelines
* `circleci` - CircleCI pipelines
* `drone` - Drone CI
* `github` - GitHub Actions
* `gitlab` - GitLab CI/CD
* `jenkins` - Jenkins
* `semaphore` - Semaphore CI
* `travis` - Travis CI
* `other` - Other CI providers (manual configuration)
## Usage examples
### Basic setup
```
Use the setup-trunk-uploads tool with testFramework="jest" and ciProvider="github"
```
### With Organization Slug
```
Use the setup-trunk-uploads tool with testFramework="pytest", ciProvider="circleci", and orgSlug="my-company"
```
### Multiple Test Frameworks
```
Use the setup-trunk-uploads tool with testFramework="jest" and ciProvider="github"
Use the setup-trunk-uploads tool with testFramework="playwright" and ciProvider="github"
```
## Sample response
The tool returns detailed setup instructions as plain text:
```
Project Analysis
- Test Framework: Vitest (detected from package.json and vitest.config.mts)
- CI Provider: GitHub Actions (detected from repository URL)
- Repository: agraebe/ci-autopilot-sample
Setup Plan
To enable flaky test uploads to Trunk, you'll need to complete these 4 steps:
1. Configure Vitest to output JUnit reports
Update your vitest.config.mts to include the JUnit reporter that will generate XML test reports.
2. Run tests with the new configuration
Execute your tests to generate the JUnit XML report.
3. Send a test upload to Trunk
Run a command to upload your first test results to Trunk using your API token.
4. Configure GitHub Actions
Add a step to your GitHub Actions workflow to automatically upload test results on every CI run.
```
## Error handling
| Error | Cause | Resolution |
| ------------------------------------------ | --------------------------------------------- | ------------------------------------------------------ |
| `Test framework is required` | `testFramework` parameter missing | Provide a supported test framework from the list above |
| `CI provider is required` | `ciProvider` parameter missing | Provide a supported CI provider from the list above |
| `User is not authenticated` | Missing or invalid authentication | Make sure you are properly authenticated with Trunk |
| `User is not a member of any organization` | No organization access | Create or join a Trunk organization |
| `No organizations found` | No accessible organizations | Create an organization in the Trunk app |
| Multiple organizations note | User belongs to multiple orgs, none specified | Provide explicit `orgSlug` parameter |
# GitHub Issues integration
Source: https://docs.trunk.io/flaky-tests/webhooks/github-issues-integration
Learn how to automatically create GitHub Issues with Flaky Tests webhooks
Trunk allows you to automate GitHub Issue creation through webhooks. This will allow you to create GitHub issues and auto-assign them to [CODEOWNERS](https://docs.github.com/en/repositories/managing-your-repositorys-settings-and-features/customizing-your-repository/about-code-owners) using Webhooks.
This guide will walk you through integrating Trunk Flaky Tests with GitHub Issues through webhooks. You will be able to automatically generate GitHub issues for new flaky tests. This guide should take 15 minutes to complete.
If your team uses **Linear or Jira**, consider Trunk's built-in [automatic ticketing](/flaky-tests/management/ticketing/automatic-ticketing) instead — richer ticket bodies (failure history, impact, common failure reasons, code owners), automatic reopen and close as test status changes, and full dashboard support with tickets linked back to their test cases. Webhooks remain the right choice for GitHub Issues and other platforms without a built-in integration.
## 1. Create a GitHub Token
Before you can create a webhook to automate GitHub Issue creation, you need to create an API token to authorize your requests.
1. Navigate to GitHub Developer Settings under **Settings** → **Developer settings**
2. Under **Personal access token** → **Fine-grained tokens**, click **Generate new token**
3. Name the token something like `Trunk Flaky Tests` so you can recognize your token and set it never to expire.
4. Select the repositories you need to create issues to under **Repository access**
5. Under **Permissions** → **Repository Permissions**, select **Read and Write** access for **Issues.**
![]()
![]() 6. Click **Generate Token** and copy your API token.
## 2. Add a new webhook
Trunk uses Svix to integrate with other services, such as GitHub Issues through webhooks.
You can create a new endpoint by:
1. Login to [Trunk Flaky Tests](https://app.trunk.io/login?intent=flaky%20tests)
2. From your profile on the top right, navigate to **Settings**
3. Under **Organization** → **Webhooks**, click **Automate GitHub Issue Creation**
6. Click **Generate Token** and copy your API token.
## 2. Add a new webhook
Trunk uses Svix to integrate with other services, such as GitHub Issues through webhooks.
You can create a new endpoint by:
1. Login to [Trunk Flaky Tests](https://app.trunk.io/login?intent=flaky%20tests)
2. From your profile on the top right, navigate to **Settings**
3. Under **Organization** → **Webhooks**, click **Automate GitHub Issue Creation**
![]()
![]() 4. Paste your GitHub repo's Issues endpoint into **Endpoint URL.** Your **Endpoint URL** should be formatted as: `https://api.github.com/repos/{OWNER}/{REPO}/issues`. You can verify the URL by visiting it in your browser, such as [https://api.github.com/repos/trunk-io/docs/issues](https://api.github.com/repos/trunk-io/docs/issues).
5. Review the transformation code automatically generated for GitHub issues. You can customize this transformation at any time. Learn more about [customizing transformations](./github-issues-integration#id-5.-customize-your-transformation).
6. Create the new endpoint. You will be redirected to the endpoint configuration view.
If you're having trouble adding a new webhook endpoint with Svix, please see the [Adding Endpoint docs from Svix](https://docs.svix.com/receiving/using-app-portal/adding-endpoints).
## 3. Add custom headers
The GitHub Issues API requires some custom headers. You can configure custom headers in the endpoint configuration:
1. You can add custom headers under **Webhooks** → **Advanced** → **Custom Headers**.
2. Fill in the **Key** and **Value** referencing the table below, and click the **+** button to add each header.
You'll need to configure the following headers.
| Key | Value |
| ---------------------- | ----------------------------- |
| `Accept` | `application/vnd.github+json` |
| `Authorization` | `Bearer
4. Paste your GitHub repo's Issues endpoint into **Endpoint URL.** Your **Endpoint URL** should be formatted as: `https://api.github.com/repos/{OWNER}/{REPO}/issues`. You can verify the URL by visiting it in your browser, such as [https://api.github.com/repos/trunk-io/docs/issues](https://api.github.com/repos/trunk-io/docs/issues).
5. Review the transformation code automatically generated for GitHub issues. You can customize this transformation at any time. Learn more about [customizing transformations](./github-issues-integration#id-5.-customize-your-transformation).
6. Create the new endpoint. You will be redirected to the endpoint configuration view.
If you're having trouble adding a new webhook endpoint with Svix, please see the [Adding Endpoint docs from Svix](https://docs.svix.com/receiving/using-app-portal/adding-endpoints).
## 3. Add custom headers
The GitHub Issues API requires some custom headers. You can configure custom headers in the endpoint configuration:
1. You can add custom headers under **Webhooks** → **Advanced** → **Custom Headers**.
2. Fill in the **Key** and **Value** referencing the table below, and click the **+** button to add each header.
You'll need to configure the following headers.
| Key | Value |
| ---------------------- | ----------------------------- |
| `Accept` | `application/vnd.github+json` |
| `Authorization` | `Bearer ` |
| `X-GitHub-Api-Version` | `2022-11-28` |
## 4. Customize your transformation
Transformations are custom code snippets you can write to customize the GitHub issues created by the webhook. A working template transformation will be added automatically for your webhook, but you can further customize the behavior of this webhook.
1. In the endpoint configuration view, navigate to the **Advanced** tab. Under **Transformation**, toggle the **Enabled** switch.
2. Click **Edit transformation** to update your transformation code, and click **Save** to update the transformation.
3. You can test the transformation by selecting the `v2.test_case.status_changed` payload and clicking **Run Test**. This will test the transformation but not send a message. You will learn to send a test message in [step 5](./github-issues-integration#id-5.-test-your-webhook).
The generated webhook template contains a configurable constant out of the box:
| Constant | Description |
| ------------------------ | ------------------------------------------------------------------------------ |
| `GITHUB_ISSUE_LABEL_IDS` | **(Optional)** GitHub labels that will be assigned to issues created by Trunk. |
Here is the provided transformation for context. You can customize your GitHub Issues integration by following the [GitHub](https://docs.github.com/en/rest/issues/issues?apiVersion=2022-11-28#create-an-issue) and [Svix transformations](https://docs.svix.com/transformations#using-transformations) documentation.
The default transformation only creates issues when `new_status === "FLAKY"`. If you also want to create issues for tests marked as **Broken** (consistently failing at a high rate), update the filter condition. For example, change `new_status !== "FLAKY"` to `new_status !== "FLAKY" && new_status !== "BROKEN"` to handle both statuses.
```javascript theme={null}
/**
* @param webhook the webhook object
* @param webhook.method destination method. Allowed values: "POST", "PUT"
* @param webhook.url current destination address
* @param webhook.eventType current webhook Event Type
* @param webhook.payload JSON payload
* @param webhook.cancel whether to cancel dispatch of the given webhook
*/
// IDs of any labels you want added to the GitHub issue.
const GITHUB_ISSUE_LABEL_IDS = [];
function handler(webhook) {
const new_status = webhook.payload.new_status;
// Filter for only tests that transitioned to flaky
if (new_status !== "FLAKY") {
webhook.payload = "canceled";
webhook.cancel = true;
return webhook;
}
webhook.payload = {
"title":`Flaky Test: ${webhook.payload.test_case.name.substring(0, 25)} transitioned to ${new_status}`,
"body": summarizeTestCase(webhook.payload),
"labels": GITHUB_ISSUE_LABEL_IDS,
// Uncomment this function for auto assignment
// "assignees": webhook.payload.test_case.codeowners.map((assignee)=>{
// // Strip the `@` symbol from codeowners
// return assignee.slice(1)
// })
}
return webhook
}
function summarizeTestCase(payload) {
const {
previous_status,
new_status,
timestamp,
repository,
test_case: {
name,
file_path,
quarantined,
codeowners,
html_url
}
} = payload;
// Construct a comprehensive issue body with key details
const issueBody = `See all details on the [Trunk Test Detail page](./${html_url})
Transition: ${previous_status} → ${new_status}
Transition time: ${timestamp}
File path: ${file_path || 'N/A'}
Quarantined: ${quarantined ? 'Yes' : 'No'}
Ownership: this test is owned by ${(codeowners && codeowners.length ? codeowners : ['@unassigned']).join(', ')}
Repository: ${repository.html_url}
`
return issueBody
}
```
### Automatically Assign Issues with CODEOWNERS
If you have [CODEOWNERS](https://docs.github.com/en/repositories/managing-your-repositorys-settings-and-features/customizing-your-repository/about-code-owners) configured for your GitHub repo, you can create issues with assignees using CODEOWNERS.\
\
You can uncomment the code block on lines 25-29 or use a snippet similar to:
```javascript theme={null}
"assignees": webhook.payload.test_case.codeowners.map((assignee)=>{
// Strip the `@` symbol from codeowners
return assignee.slice(1)
})
```
### Limitations of CODEOWNERS
1. CODEOWNERS supports assigning files to teams, but GitHub doesn't support assigning issues to teams. **If you have team owners in your CODEOWNERS file, the requests will fail**.
2. If your code owners do not map 1:1 with GitHub users, you will need to provide your own mapping, or webhooks will fail.
3. The example payload provided for testing has the CODEOWNERS assigned to `@backend`. If you're testing following the instructions in [step 5](./github-issues-integration#id-5.-test-your-webhook), the delivery attempt can fail.
## 5. Test your webhook
You can create test issues by delivering a mock webhook. You can do this by:
1. In the endpoint configuration view, navigate to the **Testing** tab and select a **Send event**
2. Under **Subscribed events,** select `v2.test_case.status_changed`as the event type to send.
3. Click **Send Example** to test your webhook
## 6. Monitoring webhooks
You can monitor the events and the webhook's delivery logs in the **Overview** tab of an endpoint configuration view.
You can see an overview of how many webhook deliveries have been attempted, how many are successful, how many are in flight, and how many fail in the **Attempt Delivery Status** modal.
![]() You can see a list of past delivery attempts in the **Message Attempts** modal. You can filter this list by **Succeeded** and **Failed** status, and you can click on each message to see the **Message content**, response code, and error message of each attempt. You can learn more about [replaying messages](https://docs.svix.com/receiving/using-app-portal/replaying-messages) and [filtering logs](https://docs.svix.com/receiving/using-app-portal/filtering-logs) in the Svix docs.
You can see a list of past delivery attempts in the **Message Attempts** modal. You can filter this list by **Succeeded** and **Failed** status, and you can click on each message to see the **Message content**, response code, and error message of each attempt. You can learn more about [replaying messages](https://docs.svix.com/receiving/using-app-portal/replaying-messages) and [filtering logs](https://docs.svix.com/receiving/using-app-portal/filtering-logs) in the Svix docs.
![]() ## Congratulations!
A GitHub Issue will now be created when a test's health status changes. You can further modify your transformation script to customize your issues.
[See the Trunk webhook event catalog](https://www.svix.com/event-types/us/org_2eQPL41Ew5XSHxiXZIamIUIXg8H/#v2.test_case.status_changed)
[Learn more about consuming webhooks in the Svix docs](https://docs.svix.com/receiving/introduction)
[Learn more about the GitHub Issues API](https://docs.github.com/en/rest/issues/issues?apiVersion=2022-11-28#create-an-issue)
# Webhooks
Source: https://docs.trunk.io/flaky-tests/webhooks/index
Use webhooks to automate custom flaky test workflows
Trunk provides webhooks for you to build custom integrations to automate workflows, like notifying your team when a test becomes flaky or automatically creating tickets to investigate flaky tests. Trunk provides built-in connectors for [Linear](./linear-integration) and [Jira](./jira-integration) to automate ticket creation, and webhooks let you build custom integrations for use cases that are not supported out of the box.
## Congratulations!
A GitHub Issue will now be created when a test's health status changes. You can further modify your transformation script to customize your issues.
[See the Trunk webhook event catalog](https://www.svix.com/event-types/us/org_2eQPL41Ew5XSHxiXZIamIUIXg8H/#v2.test_case.status_changed)
[Learn more about consuming webhooks in the Svix docs](https://docs.svix.com/receiving/introduction)
[Learn more about the GitHub Issues API](https://docs.github.com/en/rest/issues/issues?apiVersion=2022-11-28#create-an-issue)
# Webhooks
Source: https://docs.trunk.io/flaky-tests/webhooks/index
Use webhooks to automate custom flaky test workflows
Trunk provides webhooks for you to build custom integrations to automate workflows, like notifying your team when a test becomes flaky or automatically creating tickets to investigate flaky tests. Trunk provides built-in connectors for [Linear](./linear-integration) and [Jira](./jira-integration) to automate ticket creation, and webhooks let you build custom integrations for use cases that are not supported out of the box.
**Creating tickets in Linear or Jira?** Trunk's built-in [automatic ticketing](/flaky-tests/management/ticketing/automatic-ticketing) is the recommended approach — it produces richer ticket bodies (failure history, impact, common failure reasons, code owners), manages the full ticket lifecycle (create, reopen, close), and has full dashboard support with tickets linked back to their test cases. Use webhooks for custom workflows or platforms without a built-in integration.
For Merge Queue webhook events (`pull_request.*` and `pull_request_batch.*`), see the [Merge Queue webhooks reference](/merge-queue/webhooks).
[Svix](https://docs.svix.com/) powers webhooks for Trunk. You'll be using Svix to configure webhooks and you should familiarize yourself with the [Svix App Portal docs](https://docs.svix.com/app-portal) to learn more.
## Supported Events
Trunk lets you create custom workflows with **event-triggered webhooks**. Flaky Tests events are named with a `test_case` prefix. You can find all the events that Trunk supports in the event catalog:
[www.svix.com](http://www.svix.com)
Trunk publishes three Flaky Tests event types to Svix. Each event includes a full JSON schema with field descriptions visible in the Svix app portal.
### `test_case.monitor_status_changed`
Emitted when a monitor activates or resolves for a test case.
| Field | Type | Description |
| ----------------------- | ----------------- | ------------------------------------------------------------------- |
| `type` | string | Always `test_case.monitor_status_changed` |
| `timestamp` | string (ISO 8601) | When the event occurred |
| `monitor.id` | string (UUID) | Unique identifier for the monitor |
| `monitor.type` | string | The type of monitor (e.g., `pass_on_retry`) |
| `monitor.status` | string | Current monitor status (`active` or `resolved`) |
| `evidence` | object | Data supporting the status change; structure varies by monitor type |
| `repository.id` | string (UUID) | Unique identifier for the repository |
| `repository.html_url` | string | URL of the repository |
| `test_case.id` | string (UUID) | Stable unique identifier for the test |
| `test_case.name` | string | Name of the test |
| `test_case.classname` | string | Test classname |
| `test_case.file_path` | string | File path of the test |
| `test_case.html_url` | string | URL to the test detail page in Trunk |
| `test_case.codeowners` | array of strings | Code owners associated with the test |
| `test_case.quarantined` | boolean | Whether the test is quarantined |
| `test_case.variant` | string | Test variant name |
### `v2.test_case.status_changed`
Emitted when a test case changes status (e.g., becomes flaky or is resolved), as triggered by a monitor.
| Field | Type | Description |
| ----------------------------- | ----------------- | ------------------------------------------------ |
| `type` | string | Always `v2.test_case.status_changed` |
| `timestamp` | string (ISO 8601) | When the event occurred |
| `previous_status` | string | The prior status of the test case |
| `new_status` | string | The updated status of the test case |
| `triggered_by.monitor_id` | string (UUID) | Unique identifier of the triggering monitor |
| `triggered_by.monitor_type` | string | Type of monitor that triggered the change |
| `triggered_by.monitor_status` | string | Status of the monitor at the time of the trigger |
| `repository` | object | See `repository` fields above |
| `test_case` | object | See `test_case` fields above |
### `test_case.investigation_completed`
Emitted when an AI-powered flaky test analysis finishes for a test case.
| Field | Type | Description |
| -------------------- | ----------------- | --------------------------------------------------------------------------- |
| `type` | string | Always `test_case.investigation_completed` |
| `investigation_id` | string (UUID) | Unique identifier for the investigation |
| `trigger` | string | How the investigation was initiated. One of `AUTOMATIC`, `MANUAL`, or `MCP` |
| `confidence` | number | Overall confidence score (0-1) for the findings |
| `created_at` | string (ISO 8601) | When the investigation completed |
| `markdown_summary` | string | Markdown-formatted summary of findings and recommendations |
| `failure_message` | string | The original failure message that triggered the investigation |
| `facts` | array | Facts discovered during the investigation |
| `facts[].fact_type` | string | Category of the fact (e.g., `GIT_BLAME`) |
| `facts[].content` | string | Detailed description with citations to supporting evidence |
| `facts[].confidence` | number | Confidence score (0-1) for this individual fact |
| `repository` | object | See `repository` fields above |
| `test_case` | object | See `test_case` fields above |
Citations in `markdown_summary` and `facts[].content` are delivered as fully rendered links to the supporting evidence, so you can consume these fields directly without resolving placeholder tags.
**Delivery reliability.** If the webhook delivery provider rate-limits a request, Trunk automatically retries with exponential backoff, so a transient spike rarely drops an event. This applies to every Flaky Tests webhook event and needs no configuration on your side.
You can also find guides for specific examples here:
# Jira integration
Source: https://docs.trunk.io/flaky-tests/webhooks/jira-integration
Learn how to automatically create Jira issues with Flaky Test webhooks
Trunk allows you to automate Jira issue creation through webhooks. When a test becomes flaky, a Jira issue is created automatically with context including the status transition, ownership, and a link to the test details.
This guide will walk you through integrating Trunk Flaky Tests with Jira through webhooks. You will be able to automatically generate Jira issues for **new flaky tests** found in your repo. This guide should take 15 minutes to complete.
**Prefer the built-in integration for Jira.** Trunk's [Jira integration](../management/ticketing/jira-integration) now supports [automatic ticketing](../management/ticketing/automatic-ticketing) natively — richer ticket bodies (failure history, impact, common failure reasons, code owners), automatic reopen and close as test status changes, and full dashboard support with tickets linked back to their test cases. Use webhooks when you need custom payloads or workflows beyond what the built-in automation covers.
## 1. Create a Jira API Token
Before you can create a webhook to automate Jira issue creation, you need to create an API token to authorize your requests.
1. Navigate to [Atlassian API token management](https://id.atlassian.com/manage-profile/security/api-tokens).
2. Click **Create API token**, give it a label (e.g., "Trunk Webhooks"), and click **Create**.
3. Copy the token and save it in a secure location. You'll need it later.
You'll also need to generate a Base64-encoded credential string for authentication. Run this in your terminal:
```bash theme={null}
echo -n "your-email@example.com:your-api-token" | base64
```
Replace `your-email@example.com` with the email associated with your Jira account and `your-api-token` with the token you just created. Save the output for step 3.
## 2. Add a new webhook in Trunk
Trunk uses Svix to integrate with other services, such as creating Jira issues through webhooks.
You can create a new endpoint by:
1. Login to [Trunk Flaky Tests](https://app.trunk.io/login?intent=flaky%20tests)
2. From your profile on the top right, navigate to **Settings**
3. Under **Organization** → **Webhooks**, click **Automate Jira Issues Creation**.
4. Set the **Endpoint URL** to your Jira Cloud REST API endpoint: `https://.atlassian.net/rest/api/2/issue`. Replace `` with your Jira Cloud domain (e.g., `acme` if your Jira URL is `acme.atlassian.net`).
5. Review the transformation code automatically generated for Jira issues. You can customize this transformation at any time. Learn more about [customizing transformations](#5-customize-your-transformation).
6. Create the new endpoint. You will be redirected to the endpoint configuration view.
If you're having trouble adding a new webhook endpoint with Svix, please see the [Adding Endpoint docs from Svix](https://docs.svix.com/receiving/using-app-portal/adding-endpoints).
## 3. Add custom headers
The Jira REST API requires authentication headers. You can configure custom headers in the endpoint configuration:
1. Navigate to **Webhooks** → **Advanced** → **Custom Headers**.
2. Fill in the **Key** and **Value** referencing the table below, and click the **+** button to add each header.
You'll need to configure the following headers:
| Key | Value |
| --------------- | ---------------------- |
| `Authorization` | `Basic ` |
| `Content-Type` | `application/json` |
Replace `` with the Base64-encoded string you generated in [step 1](#1-create-a-jira-api-token).
## 4. Find your Jira project key and issue type
You'll need your Jira project key and preferred issue type to configure the transformation.
**Project key:** This is the short prefix on your Jira issues (e.g., `ENG`, `PROJ`, `KAN`). You can find it in the URL when viewing your Jira project: `https://your-domain.atlassian.net/jira/software/projects//board`.
**Issue type:** The type of issue to create. Common values are `Bug`, `Task`, or `Story`. The default is `Bug`.
## 5. Customize your transformation
Transformations are custom code snippets you can write to customize the Jira issues created by the webhook. A working template transformation will be added automatically for your webhook, but you can further customize the behavior.
1. In the endpoint configuration view, navigate to the **Advanced** tab. Under **Transformation**, toggle the **Enabled** switch.
2. Click **Edit transformation** to update your transformation code, and click **Save** to update the transformation.
3. You can test the transformation by selecting the `v2.test_case.status_changed` payload and clicking **Run Test**. This will test the transformation but not send a message. You will learn to send a test message [in step 6](#6-test-your-webhook).
The generated webhook template contains several configurable constants out of the box:
| Constant | Description |
| -------------------- | -------------------------------------------------------------------------------------------------- |
| `JIRA_PROJECT_KEY` | (**Required)** Your Jira project key (e.g., `ENG`, `PROJ`). |
| `JIRA_ISSUE_TYPE` | **(Optional)** The issue type to create. Defaults to `Bug`. |
| `JIRA_LABELS` | (**Optional)** Array of labels to add to the issue. Defaults to `["flaky-test"]`. |
| `JIRA_CUSTOM_FIELDS` | (**Optional)** Object of custom field key-value pairs for projects that require additional fields. |
Here is the provided transformation for context. You can customize your Jira issues integration by following the [Jira REST API docs](https://developer.atlassian.com/cloud/jira/platform/rest/v2/api-group-issues/#api-rest-api-2-issue-post) and [Svix transformations](https://docs.svix.com/transformations#using-transformations) documentation.
The default transformation only creates issues when `new_status === "FLAKY"`. If you also want to create issues for tests marked as **Broken** (consistently failing at a high rate), update the filter condition. For example, change `new_status !== "FLAKY"` to `new_status !== "FLAKY" && new_status !== "BROKEN"` to handle both statuses.
```javascript theme={null}
/**
* @param webhook the webhook object
* @param webhook.method destination method. Allowed values: "POST", "PUT"
* @param webhook.url current destination address
* @param webhook.eventType current webhook Event Type
* @param webhook.payload JSON payload
* @param webhook.cancel whether to cancel dispatch of the given webhook
*/
// Your Jira project key (e.g., "PROJ", "ENG"). This is required!
const JIRA_PROJECT_KEY = "";
// The Jira issue type to create (e.g., "Bug", "Task", "Story"). Defaults to "Bug".
const JIRA_ISSUE_TYPE = "Bug";
// Labels to add to the Jira issue. Optional.
const JIRA_LABELS = ["flaky-test"];
// Add any custom required fields your Jira project needs. Optional.
// Example: { "customfield_10042": { "value": "Platform" }, "customfield_10043": "some-value" }
const JIRA_CUSTOM_FIELDS = {};
function handler(webhook) {
const new_status = webhook.payload.new_status;
// Filter for only tests that transitioned to flaky
if (new_status !== "FLAKY") {
webhook.payload = "canceled";
webhook.cancel = true;
return webhook;
}
const description = summarizeTestCase(webhook.payload);
webhook.payload = {
fields: {
project: { key: JIRA_PROJECT_KEY },
issuetype: { name: JIRA_ISSUE_TYPE },
summary: `Flaky Test: ${webhook.payload.test_case.name}`,
description: description,
labels: JIRA_LABELS,
...JIRA_CUSTOM_FIELDS,
},
};
return webhook;
}
function summarizeTestCase(payload) {
const {
previous_status,
new_status,
timestamp,
repository,
test_case: {
name, file_path, quarantined, codeowners, html_url
}
} = payload;
const issueBody = `See all details on the [Trunk Test Detail page|${html_url}]
Transition: ${previous_status} → ${new_status}
Transition time: ${timestamp}
File path: ${file_path || 'N/A'}
Quarantined: ${quarantined ? 'Yes' : 'No'}
Ownership: this test is owned by ${(codeowners && codeowners.length ? codeowners : ['@unassigned']).join(', ')}
Repository: ${repository.html_url}
View the full stack trace on the [Test Detail page|${html_url}]
`;
return issueBody;
}
```
The description uses [Jira wiki markup](https://jira.atlassian.com/secure/WikiRendererHelpAction.jspa?section=texteffects) for formatting. Links use the `[text|url]` syntax rather than markdown.
## 6. Test your webhook
You can create test issues by delivering a mock webhook. You can do this by:
1. In the endpoint configuration view, navigate to the **Testing** tab and select a **Send event**
2. Under **Subscribed events,** select `v2.test_case.status_changed` as the event type to send
3. Click **Send Example** to test your webhook
## 7. Monitoring webhooks
You can monitor the events and the webhook's delivery logs in the **Overview** tab of an endpoint configuration view.
You can see an overview of how many webhook deliveries have been attempted, how many are successful, how many are in flight, and how many fail in the **Attempt Delivery Status** modal.
You can see a list of past delivery attempts in the **Message Attempts** modal. You can filter this list by **Succeeded** and **Failed** status, and you can click on each message to see the **Message content**, response code, and error message of each attempt. You can learn more about [replaying messages](https://docs.svix.com/receiving/using-app-portal/replaying-messages) and [filtering logs](https://docs.svix.com/receiving/using-app-portal/filtering-logs) in the Svix docs.
## Congratulations!
A Jira issue will now be created when a test's health status changes to **flaky**. You can further modify your transformation script to customize your issues.
[See the Trunk webhook event catalog](https://www.svix.com/event-types/us/org_2eQPL41Ew5XSHxiXZIamIUIXg8H/#v2.test_case.status_changed)
[Learn more about consuming webhooks in the Svix docs](https://docs.svix.com/receiving/introduction)
[Learn more about Jira's REST API](https://developer.atlassian.com/cloud/jira/platform/rest/v2/intro/)
# Linear integration
Source: https://docs.trunk.io/flaky-tests/webhooks/linear-integration
Learn how to automatically create Linear issues with Flaky Tests webhooks
Trunk allows you to automate Linear Issue creation through webhooks. This will allow you to create Linear issues and auto-assign according to [CODEOWNERS](https://docs.github.com/en/repositories/managing-your-repositorys-settings-and-features/customizing-your-repository/about-code-owners).
This guide will walk you through integrating Trunk Flaky Tests with Linear Issues through webhooks. You will be able to automatically generate Linear issues for **new flaky tests** found in your repo. This guide should take 15 minutes to complete.
**Prefer the built-in integration for Linear.** Trunk's [Linear integration](/flaky-tests/management/ticketing/linear-integration) now supports [automatic ticketing](/flaky-tests/management/ticketing/automatic-ticketing) natively — richer ticket bodies (failure history, impact, common failure reasons, code owners), automatic reopen and close as test status changes, and full dashboard support with tickets linked back to their test cases. Use webhooks when you need custom payloads or workflows beyond what the built-in automation covers.
## 1. Create a Linear Personal Access Token
Before you can create a webhook to automate GitHub Issue creation, you need to create an API token to authorize your requests.
1. In the Linear app, navigate to settings by holding `G` and pressing `S`, or by clicking on your profile on the top left and clicking **Settings**.
2. Under **Account** → **Security & Access** → **Personal API Keys**, click **New API Key** to create a new access token.
3. Copy the new API key and save it in a secure location. You'll need to use this later.
## 2. Add a new webhook in Trunk
Trunk uses Svix to integrate with other services, such as creating Linear Issues through webhooks.
You can create a new endpoint by:
1. Login to [Trunk Flaky Tests](https://app.trunk.io/login?intent=flaky%20tests)
2. From your profile on the top right, navigate to **Settings**
3. Under **Organization** → **Webhooks**, click **Automate Linear Issues Creation**.
![]()
![]() 4. Paste the Linear GraphQL API endpoint into **Endpoint URL**, which is: `https://api.linear.app/graphql`.
5. Review the transformation code automatically generated for Linear issues, you can customize this transformation at any time. Learn more about [customizing transformations](./linear-integration#id-5.-customize-your-transformation).
6. Create the new endpoint. You will be redirected to the endpoint configuration view.
If you're having trouble adding a new webhook endpoint with Svix, please see the [Adding Endpoint docs from Svix](https://docs.svix.com/receiving/using-app-portal/adding-endpoints).
## 3. Add custom headers
The Linear GraphQL API requires some custom headers. You can configure custom headers in the endpoint configuration:
1. You can add custom headers under **Webhooks** → **Advanced** → **Custom Headers**.
2. Fill in the **Key** and **Value** referencing the table below, and click the **+** button to add each header.
You'll need to configure the following headers.
| Key | Value |
| --------------- | ------------------ |
| `Authorization` | `
4. Paste the Linear GraphQL API endpoint into **Endpoint URL**, which is: `https://api.linear.app/graphql`.
5. Review the transformation code automatically generated for Linear issues, you can customize this transformation at any time. Learn more about [customizing transformations](./linear-integration#id-5.-customize-your-transformation).
6. Create the new endpoint. You will be redirected to the endpoint configuration view.
If you're having trouble adding a new webhook endpoint with Svix, please see the [Adding Endpoint docs from Svix](https://docs.svix.com/receiving/using-app-portal/adding-endpoints).
## 3. Add custom headers
The Linear GraphQL API requires some custom headers. You can configure custom headers in the endpoint configuration:
1. You can add custom headers under **Webhooks** → **Advanced** → **Custom Headers**.
2. Fill in the **Key** and **Value** referencing the table below, and click the **+** button to add each header.
You'll need to configure the following headers.
| Key | Value |
| --------------- | ------------------ |
| `Authorization` | `` |
## 4. Find your Linear Team, Project, and Label IDs
You need to find your Linear team, project, and label IDs to create issues with the appropriate labeling. You can do this by querying your Linear project using cURL.
### Team ID
First, you'll need to find your team ID so you can create Linear issues under the correct team. You can make a request in your terminal using cURL, or a similar tool.
You'll need your Linear API key from [step 1](./linear-integration#id-1.-create-a-linear-personal-access-token).
```bash theme={null}
curl \
-X POST \
-H "Content-Type: application/json" \
-H "Authorization: " \
--data '{
"query": "query Teams { teams { nodes { id name } }}"
}' \
https://api.linear.app/graphql
```
You will receive a response that contains your team UID, for example:
```json theme={null}
{
"data": {
"teams": {
"nodes": [
{
"id": "9bd0672b-7766-4a7c-3233-8ce37fdbb790",
"name": "Your Linear Team"
}
]
}
}
}
```
### Project ID
If you want to create issues under a specific project, you'll need to find its project ID. You can use a query like this:
```bash theme={null}
curl \
-X POST \
-H "Content-Type: application/json" \
-H "Authorization: lin_api_vw3gMdb2NJN9TQ66JCgBKLqNSNY6I8cH5qxwM6EW" \
--data '{
"query": "query Projects { projects { nodes { id name } }}"
}' \
https://api.linear.app/graphql
```
You'll receive a response that contains your projects and their IDs, for example:
```json theme={null}
{
"data": {
"projects": {
"nodes": [
{
"id": "ef19b35e-ce4f-4132-9705-811d4d6c8c08",
"name": "Flaky Tests"
}
]
}
}
}
```
### Label ID
If you want to create issues with a specific label, you'll need to find its label ID. You can use a query like this:
```bash theme={null}
curl \
-X POST \
-H "Content-Type: application/json" \
-H "Authorization: lin_api_vw3gMdb2NJN9TQ66JCgBKLqNSNY6I8cH5qxwM6EW" \
--data '{
"query": "query OrgLabels { organization { labels { nodes { id name } } }}"
}' \
https://api.linear.app/graphql
```
You'll receive a response that contains your labels and their IDs, for example:
```json theme={null}
{
"data": {
"organization": {
"labels": {
"nodes": [
{
"id": "e0e9f98e-c90c-40cd-939e-06ff7bd57b45",
"name": "Feature"
},
{
"id": "ce07d3bd-dee8-4bf6-979e-778dd94f15af",
"name": "Bug"
},
{
"id": "536dd774-dc33-4e70-aecc-8b00d1f04a9d",
"name": "Improvement"
},
...
]
}
}
}
}
```
## 5. Customize your transformation
Transformations are custom code snippets you can write to customize the Linear issues created by the webhook. A working template transformation will be added automatically for your webhook, but you can further customize the behavior of this webhook.
1. In the endpoint configuration view, navigate to the **Advanced** tab. Under **Transformation**, toggle the **Enabled** switch.
2. Click **Edit transformation** to update your transformation code, and click **Save** to update the transformation.
3. You can test the transformation by selecting the `v2.test_case.status_changed` payload and clicking **Run Test**. This will test the transformation but not send a message. You will learn to send a test message[ in step 6](./linear-integration#id-6.-test-your-webhook).
The generated webhook template contains several configurable constants out of the box:
| Constant | Description |
| ------------------- | --------------------------------------------------------------------------------------------------------------------- |
| `LINEAR_TEAM_ID` | (**Required)** Your Linear team ID. [Learn about finding your team ID](#team-id). |
| `LINEAR_PROJECT_ID` | **(Optional)** The Linear project ID assigned to new issues. [Learn more about finding your project ID](#project-id). |
| `LINEAR_LABEL_IDS` | (**Optional)** Array of label IDs assigned to new issues. [Learn about finding your label IDs](#label-id). |
Here is the provided transformation for context. You can customize your Linear Issues integration by following the[ Linear API](https://studio.apollographql.com/public/Linear-API/variant/current/schema/reference) and [Svix transformations](https://docs.svix.com/transformations#using-transformations) documentation.
The default transformation only creates issues when `new_status === "FLAKY"`. If you also want to create issues for tests marked as **Broken** (consistently failing at a high rate), update the filter condition. For example, change `new_status !== "FLAKY"` to `new_status !== "FLAKY" && new_status !== "BROKEN"` to handle both statuses.
```javascript theme={null}
/**
* @param webhook the webhook object
* @param webhook.method destination method. Allowed values: "POST", "PUT"
* @param webhook.url current destination address
* @param webhook.eventType current webhook Event Type
* @param webhook.payload JSON payload
* @param webhook.cancel whether to cancel dispatch of the given webhook
*/
// Your Linear Team ID from step 3 above. This is required!
const LINEAR_TEAM_ID = "";
// The Linear project ID you want issues assigned to from step 3 above. Optional.
const LINEAR_PROJECT_ID = "";
// IDs of any labels you want added to the linear issue. Optional.
const LINEAR_LABEL_IDS = [];
function handler(webhook) {
const new_status = webhook.payload.new_status;
const resolvedProjectId = LINEAR_PROJECT_ID ? `"${LINEAR_PROJECT_ID}"` : undefined;
const resolvedLinearLabels = LINEAR_LABEL_IDS.map((id) => `"${id}"`).join(",");
// Filter for only tests that transitioned to flaky
if (new_status !== "FLAKY") {
webhook.payload = "canceled";
webhook.cancel = true;
return webhook;
}
const description = summarizeTestCase(webhook.payload);
// modify the webhook object...
webhook.payload = {query: `mutation IssueCreate {
issueCreate(
input: {
title: "Flaky Test: ${webhook.payload.test_case.name}"
description: """${description}"""
teamId: "${LINEAR_TEAM_ID}"
projectId: ${resolvedProjectId}
labelIds: [${resolvedLinearLabels}]
}
) {
success
issue {
id
title
}
}
} ` };
return webhook;
}
function summarizeTestCase(payload) {
const {
previous_status,
new_status,
timestamp,
repository,
test_case: {
name,
file_path,
quarantined,
codeowners,
html_url
}
} = payload;
// Construct a comprehensive issue body with key details
const issueBody = `See all details on the [Trunk Test Detail page](./${html_url})
Transition: ${previous_status} → ${new_status}
Transition time: ${timestamp}
File path: ${file_path || 'N/A'}
Quarantined: ${quarantined ? 'Yes' : 'No'}
Ownership: this test is owned by ${(codeowners && codeowners.length ? codeowners : ['@unassigned']).join(', ')}
Repository: ${repository.html_url}
View the full stack trace on the [Test Detail page](./${html_url})
`
return issueBody
}
```
### (Optional) Automatic issue assignment
If you have CODEOWNERS configured in your repo, it will be reported by Trunk in the webhook payload. You can use this to map different CODEOWNERS to Linear assignees. You can access CODEOWNERS in the payload like this: `webhook.payload.test_case.codeowners`.
Since the way your owners map to your Linear user is unique to your team, you'll need to provide your own mapping to convert code owners to their **Linear ID**.
You can modify your issue create payload like this to include an assignee:
```javascript theme={null}
webhook.payload = {query: `mutation IssueCreate {
issueCreate(
input: {
title: "Flaky Test: ${webhook.payload.test_case.name}"
description: """${description}"""
teamId: ""
projectId: ""
labelIds: [""]
// Add you assignee here:
assigneeId: ""
}
) {
success
issue {
id
title
}
}
} ` };
```
## 6. Test your webhook
You can create test issues by delivering a mock webhook. You can do this by:
1. In the endpoint configuration view, navigate to the **Testing** tab and select a **Send event**
2. Under **Subscribed events,** select `v2.test_case.status_changed`as the event type to send
3. Click **Send Example** to test your webhook
## 7. Monitoring webhooks
You can monitor the events and the webhook's delivery logs in the **Overview** tab of an endpoint configuration view.
You can see an overview of how many webhook deliveries have been attempted, how many are successful, how many are in flight, and how many fail in the **Attempt Delivery Status** modal.
![]() You can see a list of past delivery attempts in the **Message Attempts** modal. You can filter this list by **Succeeded** and **Failed** status, and you can click on each message to see the **Message content**, response code, and error message of each attempt. You can learn more about [replaying messages](https://docs.svix.com/receiving/using-app-portal/replaying-messages) and [filtering logs](https://docs.svix.com/receiving/using-app-portal/filtering-logs) in the Svix docs.
You can see a list of past delivery attempts in the **Message Attempts** modal. You can filter this list by **Succeeded** and **Failed** status, and you can click on each message to see the **Message content**, response code, and error message of each attempt. You can learn more about [replaying messages](https://docs.svix.com/receiving/using-app-portal/replaying-messages) and [filtering logs](https://docs.svix.com/receiving/using-app-portal/filtering-logs) in the Svix docs.
![]() ## Congratulations!
A Linear Issue will now be created when a test's health status changes to **flaky**. You can further modify your transformation script to customize your issues.
[See the Trunk webhook event catalog](https://www.svix.com/event-types/us/org_2eQPL41Ew5XSHxiXZIamIUIXg8H/#v2.test_case.status_changed)
[Learn more about consuming webhooks in the Svix docs](https://docs.svix.com/receiving/introduction)
[Learn more about Linear's API](https://developers.linear.app/docs/graphql/working-with-the-graphql-api)
# Microsoft Teams integration
Source: https://docs.trunk.io/flaky-tests/webhooks/microsoft-teams-integration
Send flaky test alerts to Microsoft Teams using Trunk Flaky Tests webhooks.
Trunk allows you to create custom workflows to send customized messages to Microsoft Teams channels through webhooks.
This guide will walk you through sending Microsoft Teams messages using event-triggered webhooks. By the end of this tutorial, you'll receive Microsoft Teams messages for test status changes. This guide should take 10 minutes to complete.
## 1. Configure incoming webhooks for your team
Microsoft has two different concepts for accepting incoming webhooks. **Connectors** that are being deprecated and **Workflows** that are for newly created teams. This guide is for the newer **Workflows**. The workflow for configuring webhooks is similar, but you may see small differences. You can find more about the soon to be deprecated connectors in [Microsoft's documentation](https://learn.microsoft.com/en-us/microsoftteams/platform/webhooks-and-connectors/how-to/add-incoming-webhook?tabs=newteams%2Cdotnet).
1. Open the team in which you want to add the webhook and select the kebab menu (•••) from the upper-right corner.
2. Select **Workflows** from the dropdown menu.
3. Search for `Post to a channel when a webhook request is received`, select the workflow, then click **Next**.
4. Configure the workflow's **Microsoft Teams Team** and **Microsoft Teams Channel**, then click **Add workflow**.
5. When the workflow is added correctly, you can copy the URL displayed, then click **Done.**
## 2. Add a new webhook
Trunk uses Svix to integrate with other services, such as Microsoft Teams messages through webhooks.
You can create a new endpoint by:
1. Login to [Trunk Flaky Tests](https://app.trunk.io/login?intent=flaky%20tests)
2. From your profile on the top right, navigate to **Settings**
3. Under **Organization** → **Webhooks**, click **Teams**
## Congratulations!
A Linear Issue will now be created when a test's health status changes to **flaky**. You can further modify your transformation script to customize your issues.
[See the Trunk webhook event catalog](https://www.svix.com/event-types/us/org_2eQPL41Ew5XSHxiXZIamIUIXg8H/#v2.test_case.status_changed)
[Learn more about consuming webhooks in the Svix docs](https://docs.svix.com/receiving/introduction)
[Learn more about Linear's API](https://developers.linear.app/docs/graphql/working-with-the-graphql-api)
# Microsoft Teams integration
Source: https://docs.trunk.io/flaky-tests/webhooks/microsoft-teams-integration
Send flaky test alerts to Microsoft Teams using Trunk Flaky Tests webhooks.
Trunk allows you to create custom workflows to send customized messages to Microsoft Teams channels through webhooks.
This guide will walk you through sending Microsoft Teams messages using event-triggered webhooks. By the end of this tutorial, you'll receive Microsoft Teams messages for test status changes. This guide should take 10 minutes to complete.
## 1. Configure incoming webhooks for your team
Microsoft has two different concepts for accepting incoming webhooks. **Connectors** that are being deprecated and **Workflows** that are for newly created teams. This guide is for the newer **Workflows**. The workflow for configuring webhooks is similar, but you may see small differences. You can find more about the soon to be deprecated connectors in [Microsoft's documentation](https://learn.microsoft.com/en-us/microsoftteams/platform/webhooks-and-connectors/how-to/add-incoming-webhook?tabs=newteams%2Cdotnet).
1. Open the team in which you want to add the webhook and select the kebab menu (•••) from the upper-right corner.
2. Select **Workflows** from the dropdown menu.
3. Search for `Post to a channel when a webhook request is received`, select the workflow, then click **Next**.
4. Configure the workflow's **Microsoft Teams Team** and **Microsoft Teams Channel**, then click **Add workflow**.
5. When the workflow is added correctly, you can copy the URL displayed, then click **Done.**
## 2. Add a new webhook
Trunk uses Svix to integrate with other services, such as Microsoft Teams messages through webhooks.
You can create a new endpoint by:
1. Login to [Trunk Flaky Tests](https://app.trunk.io/login?intent=flaky%20tests)
2. From your profile on the top right, navigate to **Settings**
3. Under **Organization** → **Webhooks**, click **Teams**
![]()
![]() 4. Paste your Microsoft Teams Workflow URL from [the previous step ](./microsoft-teams-integration#id-1.-configure-incoming-webhooks-for-your-team)into **Endpoint URL**.
5. Review the transformation code automatically generated for Teams messages. You can customize this transformation at any time. Learn more about [customizing transformations](./microsoft-teams-integration#id-3.-customize-your-transformation).
6. Create the new endpoint. You will be redirected to the endpoint configuration view.
## 3. Customize your transformation
Transformations are custom code snippets you can write to customize the Microsoft Teams messages created by the webhook. A working template transformation will be added automatically for your webhook, but you can further customize the behavior of this webhook.
1. In the endpoint configuration view, navigate to the **Advanced** tab. Under **Transformation**, toggle the **Enabled** switch.
2. Click **Edit transformation** to update your transformation code, and click **Save** to update the transformation.
3. You can test the transformation by selecting the `v2.test_case.status_changed` payload and clicking **Run Test**. This will test the transformation but not send a message. You will learn to send a test message in [step 4](./microsoft-teams-integration#id-4.-test-your-webhook).
Below is an example of a webhook transformation to format the messages as [Actionable Messages](https://learn.microsoft.com/en-us/microsoftteams/platform/webhooks-and-connectors/how-to/connectors-using?tabs=cURL%2Ctext1). If you're having trouble adding a new webhook endpoint with Svix, please see the [Adding Endpoint docs from Svix](https://docs.svix.com/receiving/using-app-portal/adding-endpoints).
```javascript theme={null}
/**
* @param webhook the webhook object
* @param webhook.method destination method. Allowed values: "POST", "PUT"
* @param webhook.url current destination address
* @param webhook.eventType current webhook Event Type
* @param webhook.payload JSON payload
* @param webhook.cancel whether to cancel dispatch of the given webhook
*/
function handler(webhook) {
// See https://learn.microsoft.com/en-us/microsoftteams/platform/webhooks-and-connectors/how-to/connectors-using#send-adaptive-cards-using-an-incoming-webhook
webhook.payload = summarizeTestCase(webhook.payload);
return webhook;
}
function summarizeTestCase(payload) {
if (!payload || typeof payload !== 'object' || !payload.test_case) {
return {
type: "message",
attachments: [{
contentType: "application/vnd.microsoft.card.adaptive",
contentUrl: null,
content: {
$schema: "http://adaptivecards.io/schemas/adaptive-card.json",
type: "AdaptiveCard",
version: "1.2",
body: [{
type: "TextBlock",
text: "Error: Invalid or missing payload received by Trunk Flaky Test Webhook Transformation.",
color: "attention"
}]
}
}]
};
}
const {
previous_status = "Unknown",
new_status = "Unknown",
timestamp,
repository = {},
test_case: {
name = "N/A",
classname = "",
file_path = "",
quarantined = false,
codeowners = [],
html_url = "N/A"
}
} = payload;
const statusTimestamp = timestamp
? new Date(timestamp).toLocaleString()
: "Unknown";
const subtitle = file_path || classname || "";
return {
type: "message",
attachments: [{
contentType: "application/vnd.microsoft.card.adaptive",
contentUrl: null,
content: {
$schema: "http://adaptivecards.io/schemas/adaptive-card.json",
type: "AdaptiveCard",
version: "1.2",
body: [
{
type: "TextBlock",
text: name,
size: "large",
weight: "bolder"
},
{
type: "TextBlock",
text: subtitle,
isSubtle: true,
spacing: "none"
},
{
type: "FactSet",
facts: [
{
title: "Status",
value: `${previous_status} → ${new_status}`
},
{
title: "Last Updated",
value: statusTimestamp
},
{
title: "Quarantine Status",
value: quarantined ? "Quarantined" : "Not Quarantined"
},
{
title: "Codeowners",
value: codeowners.join(", ") || "None"
}
]
},
{
type: "ActionSet",
actions: [
{
type: "Action.OpenUrl",
title: "View Repository",
url: repository.html_url || "#"
},
{
type: "Action.OpenUrl",
title: "View Test Details",
url: html_url || "#"
}
]
}
]
}
}]
};
}
```
## 4. Test your webhook
You can send test messages to your Microsoft Teams channels as you make updates. You can do this by:
1. In the endpoint configuration view, navigate to the **Testing** tab and select a **Send event**
2. Under **Subscribed events,** select `v2.test_case.status_changed`as the event type to send.
3. Click **Send Example** to test your webhook
## 5. Monitoring webhooks
You can monitor the events and the webhook's delivery logs in the **Overview** tab of an endpoint configuration view.
You can see an overview of how many webhook deliveries have been attempted, how many are successful, how many are in flight, and how many fail in the **Attempt Delivery Status** modal.
4. Paste your Microsoft Teams Workflow URL from [the previous step ](./microsoft-teams-integration#id-1.-configure-incoming-webhooks-for-your-team)into **Endpoint URL**.
5. Review the transformation code automatically generated for Teams messages. You can customize this transformation at any time. Learn more about [customizing transformations](./microsoft-teams-integration#id-3.-customize-your-transformation).
6. Create the new endpoint. You will be redirected to the endpoint configuration view.
## 3. Customize your transformation
Transformations are custom code snippets you can write to customize the Microsoft Teams messages created by the webhook. A working template transformation will be added automatically for your webhook, but you can further customize the behavior of this webhook.
1. In the endpoint configuration view, navigate to the **Advanced** tab. Under **Transformation**, toggle the **Enabled** switch.
2. Click **Edit transformation** to update your transformation code, and click **Save** to update the transformation.
3. You can test the transformation by selecting the `v2.test_case.status_changed` payload and clicking **Run Test**. This will test the transformation but not send a message. You will learn to send a test message in [step 4](./microsoft-teams-integration#id-4.-test-your-webhook).
Below is an example of a webhook transformation to format the messages as [Actionable Messages](https://learn.microsoft.com/en-us/microsoftteams/platform/webhooks-and-connectors/how-to/connectors-using?tabs=cURL%2Ctext1). If you're having trouble adding a new webhook endpoint with Svix, please see the [Adding Endpoint docs from Svix](https://docs.svix.com/receiving/using-app-portal/adding-endpoints).
```javascript theme={null}
/**
* @param webhook the webhook object
* @param webhook.method destination method. Allowed values: "POST", "PUT"
* @param webhook.url current destination address
* @param webhook.eventType current webhook Event Type
* @param webhook.payload JSON payload
* @param webhook.cancel whether to cancel dispatch of the given webhook
*/
function handler(webhook) {
// See https://learn.microsoft.com/en-us/microsoftteams/platform/webhooks-and-connectors/how-to/connectors-using#send-adaptive-cards-using-an-incoming-webhook
webhook.payload = summarizeTestCase(webhook.payload);
return webhook;
}
function summarizeTestCase(payload) {
if (!payload || typeof payload !== 'object' || !payload.test_case) {
return {
type: "message",
attachments: [{
contentType: "application/vnd.microsoft.card.adaptive",
contentUrl: null,
content: {
$schema: "http://adaptivecards.io/schemas/adaptive-card.json",
type: "AdaptiveCard",
version: "1.2",
body: [{
type: "TextBlock",
text: "Error: Invalid or missing payload received by Trunk Flaky Test Webhook Transformation.",
color: "attention"
}]
}
}]
};
}
const {
previous_status = "Unknown",
new_status = "Unknown",
timestamp,
repository = {},
test_case: {
name = "N/A",
classname = "",
file_path = "",
quarantined = false,
codeowners = [],
html_url = "N/A"
}
} = payload;
const statusTimestamp = timestamp
? new Date(timestamp).toLocaleString()
: "Unknown";
const subtitle = file_path || classname || "";
return {
type: "message",
attachments: [{
contentType: "application/vnd.microsoft.card.adaptive",
contentUrl: null,
content: {
$schema: "http://adaptivecards.io/schemas/adaptive-card.json",
type: "AdaptiveCard",
version: "1.2",
body: [
{
type: "TextBlock",
text: name,
size: "large",
weight: "bolder"
},
{
type: "TextBlock",
text: subtitle,
isSubtle: true,
spacing: "none"
},
{
type: "FactSet",
facts: [
{
title: "Status",
value: `${previous_status} → ${new_status}`
},
{
title: "Last Updated",
value: statusTimestamp
},
{
title: "Quarantine Status",
value: quarantined ? "Quarantined" : "Not Quarantined"
},
{
title: "Codeowners",
value: codeowners.join(", ") || "None"
}
]
},
{
type: "ActionSet",
actions: [
{
type: "Action.OpenUrl",
title: "View Repository",
url: repository.html_url || "#"
},
{
type: "Action.OpenUrl",
title: "View Test Details",
url: html_url || "#"
}
]
}
]
}
}]
};
}
```
## 4. Test your webhook
You can send test messages to your Microsoft Teams channels as you make updates. You can do this by:
1. In the endpoint configuration view, navigate to the **Testing** tab and select a **Send event**
2. Under **Subscribed events,** select `v2.test_case.status_changed`as the event type to send.
3. Click **Send Example** to test your webhook
## 5. Monitoring webhooks
You can monitor the events and the webhook's delivery logs in the **Overview** tab of an endpoint configuration view.
You can see an overview of how many webhook deliveries have been attempted, how many are successful, how many are in flight, and how many fail in the **Attempt Delivery Status** modal.
![]() You can see a list of past delivery attempts in the **Message Attempts** modal. You can filter this list by **Succeeded** and **Failed** status, and you can click on each message to see the **Message content**, response code, and error message of each attempt. You can learn more about [replaying messages](https://docs.svix.com/receiving/using-app-portal/replaying-messages) and [filtering logs](https://docs.svix.com/receiving/using-app-portal/filtering-logs) in the Svix docs.
You can see a list of past delivery attempts in the **Message Attempts** modal. You can filter this list by **Succeeded** and **Failed** status, and you can click on each message to see the **Message content**, response code, and error message of each attempt. You can learn more about [replaying messages](https://docs.svix.com/receiving/using-app-portal/replaying-messages) and [filtering logs](https://docs.svix.com/receiving/using-app-portal/filtering-logs) in the Svix docs.
![]() ## Congratulations!
You should now receive notifications in your Teams channel when a test's status changes. You can further modify your transformation script to customize your messages.
[See the Trunk webhook event catalog](https://www.svix.com/event-types/us/org_2eQPL41Ew5XSHxiXZIamIUIXg8H/#v2.test_case.status_changed)
[Learn more about consuming webhooks in the Svix docs](https://docs.svix.com/receiving/introduction)
[Learn more about Microsoft Teams Workflow Webhooks](https://support.microsoft.com/en-us/office/create-incoming-webhooks-with-workflows-for-microsoft-teams-8ae491c7-0394-4861-ba59-055e33f75498)
# Integration for Slack
Source: https://docs.trunk.io/flaky-tests/webhooks/slack-integration
Learn how to use flaky test webhooks to power Slack notifications
Trunk allows you to create custom workflows to send customized messages to Slack through webhooks.
## Congratulations!
You should now receive notifications in your Teams channel when a test's status changes. You can further modify your transformation script to customize your messages.
[See the Trunk webhook event catalog](https://www.svix.com/event-types/us/org_2eQPL41Ew5XSHxiXZIamIUIXg8H/#v2.test_case.status_changed)
[Learn more about consuming webhooks in the Svix docs](https://docs.svix.com/receiving/introduction)
[Learn more about Microsoft Teams Workflow Webhooks](https://support.microsoft.com/en-us/office/create-incoming-webhooks-with-workflows-for-microsoft-teams-8ae491c7-0394-4861-ba59-055e33f75498)
# Integration for Slack
Source: https://docs.trunk.io/flaky-tests/webhooks/slack-integration
Learn how to use flaky test webhooks to power Slack notifications
Trunk allows you to create custom workflows to send customized messages to Slack through webhooks.
For details on how Trunk collects, manages, and stores your data, see our [Security and Privacy](../../setup-and-administration/security) page.
This guide will walk you through sending Slack messages using event-triggered webhooks. By the end of this tutorial, you'll receive Slack messages for test status changes. This guide should take 10 minutes to complete.
## 1. Configure Slack webhooks
Trunk uses Svix to integrate with other services, such as Slack, through webhooks.
You can add the new Slack Webhook URL to Svix by following these steps:
1. Login to [Trunk Flaky Tests](https://app.trunk.io/login?intent=flaky%20tests)
2. From your profile on the top right, navigate to **Settings**
3. Under **Organization** → **Webhooks**, click **Slack**
![]() 4. Click **Connect to Slack** and select the server and channel to connect to.
4. Click **Connect to Slack** and select the server and channel to connect to.
![]() 5. Review the transformation code automatically generated for Slack messages. You can customize this transformation at any time. Learn more about [customizing transformations](./slack-integration#id-2.-customize-your-transformation).
6. By default, this connection will send messages about Trunk Merge and Flaky Tests events. If you only want Flaky Tests events, unselect all events other than `v2.test_case.status_changed`.
7. Create the new endpoint. You will be redirected to the endpoint configuration view.
If you're having trouble adding a new webhook endpoint with Svix, please see the [Adding Endpoint docs from Svix](https://docs.svix.com/receiving/using-app-portal/adding-endpoints).
## 2. Customize your transformation
Transformations are custom code snippets you can write to customize the Slack messages sent by the webhook. A working template transformation will be added automatically for your webhook, but you can further customize the behavior of this webhook.
1. In the endpoint configuration view, navigate to the **Advanced** tab. Under **Transformation**, toggle the **Enabled** switch.
2. Click **Edit transformation** to update your transformation code, and click **Save** to update the transformation.
3. You can test the transformation by selecting the `v2.test_case.status_changed` payload and clicking **Run Test**. This will test the transformation but not send a message. You will learn to send a test message in [step 3](./slack-integration#id-3.-test-your-webhook).
An example transformation script is provided below and you can customize your Slack integration by following the [Slack](https://api.slack.com/messaging/webhooks) and [Svix transformations](https://docs.svix.com/transformations#using-transformations) documentation.
```javascript theme={null}
/**
* @param webhook the webhook object
* @param webhook.method destination method. Allowed values: "POST", "PUT"
* @param webhook.url current destination address
* @param webhook.eventType current webhook Event Type
* @param webhook.payload JSON payload
* @param webhook.cancel whether to cancel dispatch of the given webhook
*/
function handler(webhook) {
const payload = summarizeTestCase(webhook.payload)
webhook.payload = payload
return webhook
}
function summarizeTestCase(payload) {
if (!payload || typeof payload !== 'object' || !payload.test_case) {
return "Error: Invalid or missing payload.";
}
const {
previous_status = "Unknown",
new_status = "Unknown",
timestamp,
repository = {},
test_case: {
name = "N/A",
classname = "",
file_path = "",
quarantined = false,
codeowners = [],
html_url = "N/A"
}
} = payload;
const statusSummary = `Status: ${previous_status} → ${new_status} `
+ `(Updated: ${timestamp ? new Date(timestamp).toLocaleString() : "Unknown"})`;
const quarantineStatus = quarantined
? "This test is currently quarantined."
: "This test is not quarantined.";
const repoLink = `Repository: ${repository.html_url || "N/A"}`;
const testLink = `Test Details: ${html_url}`;
const ownerSummary = `Codeowners: \`${codeowners.join(", ") || "None"}\``;
const classnameSummary = classname ? `Classname: \`${classname}\`` : null;
const filePathSummary = file_path ? `File Path: \`${file_path}\`` : null;
return {
blocks: [
{
type: "header",
text: {
type: "plain_text",
text: `Test Name: ${name}`
}
},
{
type: "section",
text: {
type: "mrkdwn",
text: [
filePathSummary,
classnameSummary,
statusSummary,
quarantineStatus,
ownerSummary,
repoLink,
testLink
].filter(Boolean).join("\n"),
},
},
],
};
};
```
## 3. Test your webhook
You can send test messages to your Slack channels as you make updates. You can do this by:
1. In the endpoint configuration view, navigate to the **Testing** tab and select a **Send event**
2. Under **Subscribed events,** select `v2.test_case.status_changed` as the event type to send.
3. Click **Send Example** to test your webhook
## 4. Monitoring webhooks
You can monitor the events and the webhook's delivery logs in the **Overview** tab of an endpoint configuration view.
You can see an overview of how many webhook deliveries have been attempted, how many are successful, how many are in flight, and how many fail in the **Attempt Delivery Status** modal.
5. Review the transformation code automatically generated for Slack messages. You can customize this transformation at any time. Learn more about [customizing transformations](./slack-integration#id-2.-customize-your-transformation).
6. By default, this connection will send messages about Trunk Merge and Flaky Tests events. If you only want Flaky Tests events, unselect all events other than `v2.test_case.status_changed`.
7. Create the new endpoint. You will be redirected to the endpoint configuration view.
If you're having trouble adding a new webhook endpoint with Svix, please see the [Adding Endpoint docs from Svix](https://docs.svix.com/receiving/using-app-portal/adding-endpoints).
## 2. Customize your transformation
Transformations are custom code snippets you can write to customize the Slack messages sent by the webhook. A working template transformation will be added automatically for your webhook, but you can further customize the behavior of this webhook.
1. In the endpoint configuration view, navigate to the **Advanced** tab. Under **Transformation**, toggle the **Enabled** switch.
2. Click **Edit transformation** to update your transformation code, and click **Save** to update the transformation.
3. You can test the transformation by selecting the `v2.test_case.status_changed` payload and clicking **Run Test**. This will test the transformation but not send a message. You will learn to send a test message in [step 3](./slack-integration#id-3.-test-your-webhook).
An example transformation script is provided below and you can customize your Slack integration by following the [Slack](https://api.slack.com/messaging/webhooks) and [Svix transformations](https://docs.svix.com/transformations#using-transformations) documentation.
```javascript theme={null}
/**
* @param webhook the webhook object
* @param webhook.method destination method. Allowed values: "POST", "PUT"
* @param webhook.url current destination address
* @param webhook.eventType current webhook Event Type
* @param webhook.payload JSON payload
* @param webhook.cancel whether to cancel dispatch of the given webhook
*/
function handler(webhook) {
const payload = summarizeTestCase(webhook.payload)
webhook.payload = payload
return webhook
}
function summarizeTestCase(payload) {
if (!payload || typeof payload !== 'object' || !payload.test_case) {
return "Error: Invalid or missing payload.";
}
const {
previous_status = "Unknown",
new_status = "Unknown",
timestamp,
repository = {},
test_case: {
name = "N/A",
classname = "",
file_path = "",
quarantined = false,
codeowners = [],
html_url = "N/A"
}
} = payload;
const statusSummary = `Status: ${previous_status} → ${new_status} `
+ `(Updated: ${timestamp ? new Date(timestamp).toLocaleString() : "Unknown"})`;
const quarantineStatus = quarantined
? "This test is currently quarantined."
: "This test is not quarantined.";
const repoLink = `Repository: ${repository.html_url || "N/A"}`;
const testLink = `Test Details: ${html_url}`;
const ownerSummary = `Codeowners: \`${codeowners.join(", ") || "None"}\``;
const classnameSummary = classname ? `Classname: \`${classname}\`` : null;
const filePathSummary = file_path ? `File Path: \`${file_path}\`` : null;
return {
blocks: [
{
type: "header",
text: {
type: "plain_text",
text: `Test Name: ${name}`
}
},
{
type: "section",
text: {
type: "mrkdwn",
text: [
filePathSummary,
classnameSummary,
statusSummary,
quarantineStatus,
ownerSummary,
repoLink,
testLink
].filter(Boolean).join("\n"),
},
},
],
};
};
```
## 3. Test your webhook
You can send test messages to your Slack channels as you make updates. You can do this by:
1. In the endpoint configuration view, navigate to the **Testing** tab and select a **Send event**
2. Under **Subscribed events,** select `v2.test_case.status_changed` as the event type to send.
3. Click **Send Example** to test your webhook
## 4. Monitoring webhooks
You can monitor the events and the webhook's delivery logs in the **Overview** tab of an endpoint configuration view.
You can see an overview of how many webhook deliveries have been attempted, how many are successful, how many are in flight, and how many fail in the **Attempt Delivery Status** modal.
![]() You can see a list of past delivery attempts in the **Message Attempts** modal. You can filter this list by **Succeeded** and **Failed** status, and you can click on each message to see the **Message content**, response code, and error message of each attempt. You can learn more about [replaying messages](https://docs.svix.com/receiving/using-app-portal/replaying-messages) and [filtering logs](https://docs.svix.com/receiving/using-app-portal/filtering-logs) in the Svix docs.
You can see a list of past delivery attempts in the **Message Attempts** modal. You can filter this list by **Succeeded** and **Failed** status, and you can click on each message to see the **Message content**, response code, and error message of each attempt. You can learn more about [replaying messages](https://docs.svix.com/receiving/using-app-portal/replaying-messages) and [filtering logs](https://docs.svix.com/receiving/using-app-portal/filtering-logs) in the Svix docs.
![]() ## Alert only when a test gets worse
By default this connection alerts on every status change. If you'd rather hear about a test only when it **escalates** — degrading to broken, or tripping more monitors over time — filter the transformation on the status transition instead of sending every event.
## Alert only when a test gets worse
By default this connection alerts on every status change. If you'd rather hear about a test only when it **escalates** — degrading to broken, or tripping more monitors over time — filter the transformation on the status transition instead of sending every event.
Send Slack alerts when a test gets worse, not just the first time it's flagged.
## Congratulations!
You should now receive notifications in your Slack workspace when a test's status changes. You can further modify your transformation script to customize your messages.
[See the Trunk webhook event catalog](https://www.svix.com/event-types/us/org_2eQPL41Ew5XSHxiXZIamIUIXg8H/#v2.test_case.status_changed)
[Learn more about consuming webhooks in the Svix docs](https://docs.svix.com/receiving/introduction)
[Learn more about the Slack API](https://api.slack.com/messaging/webhooks)
# Trunk Platform
Source: https://docs.trunk.io/index
Ship Software as Fast as AI Writes It
AI generates code at machine speed, but code review, CI, and delivery still move at human pace. That gap is widening, and it gets worse every time you add another AI agent to the loop.
Trunk enables continuous delivery: any commit on your main branch could be deployed to production. We do this by eliminating the two bottlenecks that prevent it. Flaky tests that waste developer time, and serialized merge queues that cap your throughput.
Teams start with whichever problem hurts more, then expand. Caseware cut merge time from 6 hours to 90 minutes. Zillow eliminated all pipeline blockages from flaky tests. Faire prevented 20% of main branch failures from green-green conflicts.
[Schedule time here](https://calendly.com/trunk/demo) or email [support@trunk.io](mailto:support@trunk.io)
## Why This Matters Now
You check out `main` on Monday morning, grab your coffee, open a pull request, and CI fails for reasons that have nothing to do with your code. You're reading logs, pinging Slack, trying to figure out who broke what. That happens to every engineer, every day. Continuous delivery means every commit on main is known-good. Every CI failure is yours to fix, not something you inherited.
That problem has existed for years. What makes it urgent now is volume. AI agents are generating 50+ PRs a day, and they hit the same merge queue serialization and flaky test noise that slows humans. Except agents can't context-switch to other work while they wait. Every bottleneck in your CI pipeline that used to cost you hours now costs you days.
## Trunk Flaky Tests
At tens of thousands of tests, even a 1% flake rate means false failures on nearly every run. Each flake costs 10 to 15 minutes: the developer waits, reads logs, reruns, confirms it was noise. If your CI target is five-minute PR jobs, every flake doubles or triples that.
Trunk detects flakes through branch-aware analysis that treats main, PRs, and merge queues differently. We fingerprint failure modes using stack trace embeddings and surface those differences for quick triage. We quarantine flaky tests so that if a quarantined test fails, CI passes. Business-critical tests can be pinned as never-quarantine. Developers see all of this in PR comments: what failed, why, and whether it's their code or a known issue. No code changes required.
On the repair side, we're working with design partners on AI-powered fixing through MCP integration with the likes of Claude Code, Codex, or Cursor. Trunk provides the failure data and CI context, and the agent uses that to iterate on the actual fix. Think of it as a Roomba for flaky tests. Teams in the program are already running it to detect flakes, figure out root causes, and submit fixes without a human in the loop.
[Full Flaky Tests documentation →](./flaky-tests/overview)
## Trunk Merge Queue
Traditional merge queues guarantee main stability by testing PRs one at a time. At 100+ PRs/day, that becomes a bottleneck. Monorepos make this easier to solve. If you have mobile, frontend, and backend code in the same repo, those PRs can test and merge independently because they don't touch the same targets. Linear merge queues don't know that. They put everything in one line.
Trunk's merge queue runs in parallel mode. It knows which targets each PR affects, finds non-overlapping sets, and tests them at the same time. When queue depth grows, it batches multiple PRs into a single CI run and bisects automatically if the batch fails. Anti-flake protection keeps flaky failures from stalling the queue: if a later batch that includes the same code passes, both merge.
Validated at 250+ PRs/hour sustained over 24 hours. Peaked at 300+ simultaneous PRs in parallel testing.
[Full Merge Queue documentation →](./merge-queue/merge-queue)
## How They Work Together
Without flaky test handling, a merge queue backs up every time a test becomes unreliable. One recurring flake means batches fail, need re-isolation, and the queue goes serial again. With both products running, flakes get quarantined by failure mode so CI stays clean, parallel mode and batching keep the queue moving, and anti-flake protection in the queue catches what slips through.
## Trusted by
![]()
![]() ## Works With Your Stack
* **CI providers**: Works with any CI provider. Common setups include GitHub Actions, GitLab CI, Jenkins, BuildKite, CircleCI, and Azure DevOps. Integrates via CLI that uploads test results from existing pipelines.
* **Languages**: Works with any language. We analyze test output formats, not source code, so there's nothing language-specific to configure.
* **Test frameworks**: Works with any runner that produces JUnit XML, XCResult, or Bazel BEP. That covers Jest, Pytest, XCTest, Cypress, Playwright, RSpec, JUnit, GoogleTest, and most others.
* **Build systems**: Bazel, Nx, Gradle with native impacted-target calculation. API for custom build systems.
* **Integrations**: Full APIs for both products, webhooks with Svix transformations, CLI for local and CI use, Slack notifications, Jira, Linear, and Asana ticket creation. [API documentation →](./setup-and-administration/apis/)
## Why Teams Choose Trunk
**vs. GitHub native merge queue, Bors, Mergify.** Sequential by design. No parallel lane logic, no flake protection, no batching with bisection.
**vs. Datadog, Buildkite Analytics.** They show you flake data but don't quarantine at runtime or integrate with your merge queue. Most stop running quarantined tests entirely, which hides the problem. Trunk keeps running them to collect evidence for root cause analysis.
**vs. building in-house.** Merge queues at scale need parallel graph computation, bisection, and robust GitHub API orchestration. Flaky test detection at 50k+ tests needs real-time ETL, embeddings, and classification. If the engineers who built your internal system leave, you're maintaining deployment-path infrastructure without the knowledge to fix it.
## Getting Started
Most teams schedule a 30-minute call before integrating. We help plan for security reviews, understand your CI architecture, and flag common gotchas.
* [Schedule a call](https://calendly.com/trunk/demo) **← Recommended**
Or explore on your own: [Create a Trunk account →](https://app.trunk.io/signup)
* [Flaky Tests Integration Guide](/flaky-tests/get-started)
* [Merge Queue Setup Guide](/merge-queue/getting-started)
We set up a direct Slack Connect channel with our engineers for your team. Feature requests, debugging, planning. Not a vendor you file tickets with.
## Security & Compliance
SOC 2 Type II certified. TLS/HSTS in transit, AES-256 at rest. AWS-hosted in U.S. data centers with private VPCs. MFA, least privilege, access logging. Regular vulnerability scans, annual third-party pen tests. 45-day test result retention. We don't access your source code, secrets, environment variables, or customer data. [Request SOC 2 report](mailto:security@trunk.io).
## Works With Your Stack
* **CI providers**: Works with any CI provider. Common setups include GitHub Actions, GitLab CI, Jenkins, BuildKite, CircleCI, and Azure DevOps. Integrates via CLI that uploads test results from existing pipelines.
* **Languages**: Works with any language. We analyze test output formats, not source code, so there's nothing language-specific to configure.
* **Test frameworks**: Works with any runner that produces JUnit XML, XCResult, or Bazel BEP. That covers Jest, Pytest, XCTest, Cypress, Playwright, RSpec, JUnit, GoogleTest, and most others.
* **Build systems**: Bazel, Nx, Gradle with native impacted-target calculation. API for custom build systems.
* **Integrations**: Full APIs for both products, webhooks with Svix transformations, CLI for local and CI use, Slack notifications, Jira, Linear, and Asana ticket creation. [API documentation →](./setup-and-administration/apis/)
## Why Teams Choose Trunk
**vs. GitHub native merge queue, Bors, Mergify.** Sequential by design. No parallel lane logic, no flake protection, no batching with bisection.
**vs. Datadog, Buildkite Analytics.** They show you flake data but don't quarantine at runtime or integrate with your merge queue. Most stop running quarantined tests entirely, which hides the problem. Trunk keeps running them to collect evidence for root cause analysis.
**vs. building in-house.** Merge queues at scale need parallel graph computation, bisection, and robust GitHub API orchestration. Flaky test detection at 50k+ tests needs real-time ETL, embeddings, and classification. If the engineers who built your internal system leave, you're maintaining deployment-path infrastructure without the knowledge to fix it.
## Getting Started
Most teams schedule a 30-minute call before integrating. We help plan for security reviews, understand your CI architecture, and flag common gotchas.
* [Schedule a call](https://calendly.com/trunk/demo) **← Recommended**
Or explore on your own: [Create a Trunk account →](https://app.trunk.io/signup)
* [Flaky Tests Integration Guide](/flaky-tests/get-started)
* [Merge Queue Setup Guide](/merge-queue/getting-started)
We set up a direct Slack Connect channel with our engineers for your team. Feature requests, debugging, planning. Not a vendor you file tickets with.
## Security & Compliance
SOC 2 Type II certified. TLS/HSTS in transit, AES-256 at rest. AWS-hosted in U.S. data centers with private VPCs. MFA, least privilege, access logging. Regular vulnerability scans, annual third-party pen tests. 45-day test result retention. We don't access your source code, secrets, environment variables, or customer data. [Request SOC 2 report](mailto:security@trunk.io).
**Want to see how it works? Have questions?** [**Schedule time here**](https://calendly.com/trunk/demo) **or email** [**support@trunk.io**](mailto:support@trunk.io)
## Learn More
A merge queue to make merging code in GitHub safer and easier
Detect, quarantine, and eliminate flaky tests from your codebase
# Flaky Tests
Source: https://docs.trunk.io/links/flaky-tests-api
# MCP reference
Source: https://docs.trunk.io/links/mcp-reference
# Merge Queue
Source: https://docs.trunk.io/links/merge-queue-api
# Settings and configurations
Source: https://docs.trunk.io/merge-queue/administration/advanced-settings
Explanation of settings for states, timeouts, concurrency, and branch protection.
All of the following settings are specific to individual Merge Queues and can be accessed from the **Merge Queue** tab: Select your queue, then click the **Settings** tab.
Settings are organized into sections accessible from the sidebar: **General** (state, mode, merge method, timeouts, concurrency), **GitHub** (required statuses, comments, labels), **Slack** (notifications), and **Batching**. Each section has its own URL, so you can link teammates directly to a specific group of settings.
![The Merge Queue settings page with a sidebar listing General, GitHub, Slack, Batching, and Sudo, showing the General section's controls.]()
![The Merge Queue settings page with a sidebar listing General, GitHub, Slack, Batching, and Sudo, showing the General section's controls.]()
Organization admin access is required to change any of these settings. Non-admins see all controls in a disabled state. Hovering over a disabled button shows a tooltip explaining the restriction.
***
## Merge Queue state
You can change the state of your Merge Queue to control whether new PRs can enter the queue and whether tested PRs will merge. PRs already testing will always complete their tests regardless of state. Below are the possible states:
| State | Will PRs Enter the Queue? | Will PRs Merge After Testing? | Example use case |
| ---------- | ------------------------- | ----------------------------- | ----------------------------------------------------------------------------------------- |
| `Running` | Yes | Yes | **Everyday merging**: protect your mainline and merge successful PRs. |
| `Paused` | No | No | **CI failure recovery**: stop merges and testing in the queue until failure is resolved. |
| `Draining` | No | Yes | **Code freeze**: merge PRs currently in the queue but don't start testing additional PRs. |
**Note:** The Merge Queue may automatically enter a `Switching Modes` state, which functions exactly like `Draining`. This occurs when you switch the queue mode while PRs are still being tested.
### When to change merge queue state?
The `Running` state is the default state of your merge queue, and will be the normal, day-to-day state of your queue.
`Paused` is useful for CI incident response and failure recovery. For example, if there is a test infrastructure outage, a queue can be `Paused` until recovery is complete. The ordering of PRs in the queue is preserved, but no PRs are tested or merged.
`Draining` is useful for managing events like code freezes. PRs currently in the queue will be tested and merged, but no new PRs will start testing.
***
## Multiple queues per repository
You can create multiple merge queues within a single repository, with each queue targeting a different branch. This is useful for teams that maintain separate branches for different environments (e.g., `main`, `staging`, `release/v2`).
A branch can only be associated with one queue. Attempting to create a second queue against the same branch returns the error `A merge queue already exists for branch "" in this repository`.
Each queue operates independently. PRs submitted to one queue don't interact with PRs in another queue for the same repo, and every queue has its own settings, including merge method, required statuses, batching, and concurrency.
### Creating additional queues
1. Navigate to **Merge Queue** and click **New Queue** at the top right
2. Select the same repository and enter a different target branch
3. Click **Create Queue**
### Navigating between queues
The Merge Queue dashboard groups queues by repository:
* **Single-queue repos**: The repository row is itself a link that goes directly to the queue.
* **Multi-queue repos**: The repository row expands inline to list each queue with its target branch label. Click any queue to open it.
In the Settings page, when a repository has more than one queue, a **Merge Queues** selector appears so you can switch between queues. The currently selected branch is shown next to the **Merge Queue Settings** heading.
***
## Merge Queue mode
> Merge Queues operate in one of two modes, **Single** (default) or [**Parallel**](../optimizations/parallel-queues/)**.**
**Single Queue** processes all pull requests in one line, testing each PR predictively against all changes ahead of it. Multiple PRs can be tested and merged simultaneously based on your [Testing Concurrency](./advanced-settings#testing-concurrency) and [Batching](./advanced-settings#batching) settings.
**Parallel Queues** dynamically creates multiple independent testing lanes based on each PR's impacted targets (the parts of the codebase it changes). PRs affecting different parts of the code can be tested in separate lanes, reducing wait times for repositories with distinct, independently-testable components.
**Requirements for Parallel mode:**
* Requires configuring a workflow to calculate and upload impacted targets for each PR
* The queue will wait for impacted targets before processing PRs
Read more about [Trunk's implementation of Parallel merge queues](../optimizations/parallel-queues/), supported build systems ([Bazel](../../flaky-tests/get-started/frameworks/bazel), [Nx](../optimizations/parallel-queues/nx), or [custom API](../optimizations/parallel-queues/api)), and [what impacted targets are](../optimizations/parallel-queues/#what-are-impacted-targets).
***
## Merge Method
Choose how your PRs get merged into the target branch. Options are Squash (default), Merge Commit, or Rebase.
![]() ### Available Methods
**Squash** (default)
* Combines all commits from the PR into a single commit on the target branch
* Creates a clean, linear history with one commit per feature
* The commit message is generated from the PR's title and description
* Best for: Teams that prefer a clean history with one commit per logical change
**Merge Commit**
* Preserves all individual commits from the PR
* Creates an additional merge commit to mark the integration
* Maintains complete commit history from feature branches
* Best for: Teams that want to preserve detailed development history and commit attribution
**Rebase**
* Replays all commits from the PR on top of the target branch
* Creates a linear history without merge commits
* Each commit from the PR appears individually in the target branch's history
* Best for: Teams that want a linear history while preserving individual commits
### Changing the Merge Method
You can change your merge method at any time:
1. Navigate to the **Merge Queue** tab → **\[repository]** → **Settings**
2. Find the **Merge Method** dropdown
3. Select your preferred method: Squash, Merge Commit, or Rebase
4. The new method will apply to all PRs merged after the change
### Available Methods
**Squash** (default)
* Combines all commits from the PR into a single commit on the target branch
* Creates a clean, linear history with one commit per feature
* The commit message is generated from the PR's title and description
* Best for: Teams that prefer a clean history with one commit per logical change
**Merge Commit**
* Preserves all individual commits from the PR
* Creates an additional merge commit to mark the integration
* Maintains complete commit history from feature branches
* Best for: Teams that want to preserve detailed development history and commit attribution
**Rebase**
* Replays all commits from the PR on top of the target branch
* Creates a linear history without merge commits
* Each commit from the PR appears individually in the target branch's history
* Best for: Teams that want a linear history while preserving individual commits
### Changing the Merge Method
You can change your merge method at any time:
1. Navigate to the **Merge Queue** tab → **\[repository]** → **Settings**
2. Find the **Merge Method** dropdown
3. Select your preferred method: Squash, Merge Commit, or Rebase
4. The new method will apply to all PRs merged after the change
**Note:** Changing the merge method only affects future merges. PRs already merged will retain their original merge method.
### Considerations
* **Commit History Style**: Choose the method that matches your team's Git workflow preferences
* **Traceability**: Merge commits and rebase preserve more commit-level detail than squash
* **Repository Size**: Squash merging can help keep repository history more concise
* **Existing Workflows**: Match your existing GitHub merge button preferences for consistency across your team
The merge method is configured per repository, so different repositories in your organization can use different methods based on their needs.
### Custom merge commit titles
You can override the merge commit title on a per-PR basis by adding a `merge-commit-title:` directive on its own line anywhere in the PR body:
```
merge-commit-title: feat(auth): add OAuth2 login flow [PROJ-123]
```
When present, Trunk uses this title for the merge commit instead of the default GitHub-generated title. The commit body follows the usual behavior for the configured merge method. When the directive is not present, the default behavior is preserved.
See [Submit and cancel pull requests](../using-the-queue/reference#custom-merge-commit-titles) for more details and examples.
***
## Testing concurrency
> Testing concurrency can be set to any value, options are **5 (average)**, **25 (high)**, **50 (very high),** and **Custom**.
Configure how many PRs may be tested in parallel. A larger number may increase throughput since more PRs are tested in parallel, but at the expense of CI since more jobs are running in parallel. When the queue is at capacity, PRs will still be submitted to it, but they will not begin testing until a PR leaves the queue.
![A queue of six PRs where only two test at a time inside a concurrency window; as the front pair finishes, the window slides to the next pair.]()
If your testing workload contains some flaky tests, a deeper queue (i.e., a higher concurrency) may struggle. Running Merge in Parallel mode can help with this, as it will reduce the average depth of your merge queue since all PRs won't be queued directly behind each other.
For example, assuming a concurrency of 3:
* At 12:00, Alice submits PR 1000 to the Merge Queue, and it starts testing.
* At 12:05, Bob submits PR 888 to the Merge Queue, and it starts testing.
* At 12:10, Charlie submits PR 777 to the Merge Queue, and it starts testing.
* At 12:15, Alice submits PR 1001 to the Merge Queue. Tests do not start because the Merge Queue is at its concurrency limit.
***
## Timeout for tests to complete
> Select the number of hours from the dropdown, default is **5 hours**.
Configure how long a PR's test can run before auto-cancelling while testing in the Merge Queue. If a long-running test is detected, Merge will automatically cancel the test.
For example, assuming a timeout of 4 hours:
* At 3:00, Bob submits PR 456 to the Merge Queue.
* At 3:05, PR 456 starts testing using Bob's CI system.
* At 7:05, Trunk cancels PR 456 since PR 456 is still testing.
***
## Required Status Checks
> Configure which CI status checks must pass before a PR can merge through the queue.
There are three ways to tell Merge Queue which status checks to wait on while testing a PR:
1. **GitHub branch protection rules** (default) — Trunk infers required statuses from the protected branch's required status checks.
2. **Trunk UI override** — Configure required statuses directly in the Trunk UI.
3. **`.trunk/trunk.yaml` override** — Declare required statuses in `merge.required_statuses`.
All three work regardless of which testing mode you chose (Draft PR or Push-Triggered).
**These checks are what Merge Queue waits on while a PR is already in the queue and testing. They do not control which PRs are admitted into the queue.**
**When to override the default:**
* **Different checks for the queue** - Your branch protection requires checks that shouldn't gate the merge queue (e.g., code coverage reports, deployment previews)
* **Stricter queue requirements** - You want the merge queue to require additional checks beyond what branch protection enforces
* **Multiple queues** - Each queue can have its own set of required statuses
* **No GitHub branch protection** - You don't use branch protection rules and need to tell Merge Queue what to wait on
### Configure in the Trunk UI
1. Navigate to the **Merge Queue** tab, select your queue, then click **Settings** → **GitHub**
2. Find the **Required Status Checks** section
3. Use the CI job selector to choose which status checks must pass. The selector shows GitHub status check and check run names observed on recent pull requests in your repository. If a check name does not appear in the list (for example, a new workflow not yet seen on a recent PR), type it in directly and press Enter to add it.
4. Selected statuses override the GitHub branch protection defaults for the merge queue
![The GitHub section of Merge Queue settings showing GitHub Comments, Commands, Label Commands, State Labels, GitHub Statuses, Browser Extension, and Required Statuses with a Configure control.]()
![The GitHub section of Merge Queue settings showing GitHub Comments, Commands, Label Commands, State Labels, GitHub Statuses, Browser Extension, and Required Statuses with a Configure control.]()
When required statuses are configured in Trunk, only those statuses are required for the merge queue. When not configured, Trunk falls back to your GitHub branch protection required checks.
### Configure in `.trunk/trunk.yaml`
Alternatively, declare required statuses in your `.trunk/trunk.yaml` file at the root of your repository:
```yaml theme={null}
version: 0.1
merge:
required_statuses:
- Unit Tests
- Integration Tests
```
The status check names must exactly match the CI job names that report status to GitHub.
***
## Optimistic Merge Queue
> Toggle this feature **Enabled** or **Disabled**. Default is **Disabled**.
[**Optimistic Merging**](../optimizations/optimistic-merging) allows multiple PRs to merge together at once when testing completes out of order. When [Testing Concurrency](./advanced-settings#testing-concurrency) allows multiple PRs to test simultaneously, a PR later in the queue may finish before PRs ahead of it. Since that PR's tests include all the changes ahead of it, the system can safely merge all verified PRs together instead of waiting for each one individually, reducing merge time.
***
## Direct Merge to Main
Merge PRs immediately when they're already based on the tip of main and the queue is empty, skipping redundant testing.
* **Default:** Enabled
* **Trigger conditions:** PR is up-to-date with main + queue is empty + tests passed
* **Benefit:** Eliminates 5-30 minutes of wait time for up-to-date PRs
* **Best for:** Teams that keep PRs current with main before merging
Toggle this setting in the **Merge Queue** tab by selecting your queue, then clicking **Settings**. Learn more in [Direct Merge to Main](../optimizations/direct-merge-to-main).
***
## Pending Failure Depth
> Pending Failure Depth can be set to any value, options are **0** (default), **1**, **2**, **3**, and **Custom**.
[**Pending Failure Depth**](../optimizations/pending-failure-depth) controls how many levels of successor test runs the system waits on before transitioning a failed group out of the Pending Failure state. When combined with [optimistic merging](../optimizations/optimistic-merging), this allows a passing successor to retroactively clear a failure caused by a transient issue (flake).
When set to **0** (default), the successor check is skipped and groups transition as soon as predecessor groups finish testing. When set to a value greater than 0, the system additionally waits for that many successor levels to finish testing before transitioning.
***
## Draft pull request creation
> Toggle this feature **Enabled** or **Disabled**. Default is **Enabled**.
[**Draft PR Creation**](../getting-started/configure-branch-protection#draft-pr-mode-recommended---default) determines whether Trunk Merge Queue creates draft PRs or push-triggered branches when testing changes. When enabled (default), the queue creates draft PRs to trigger your existing PR-based CI checks. When disabled, the queue creates `trunk-merge/` branches instead, requiring you to configure push-triggered workflows to run your required status checks.
***
## GitHub comments
> Toggle this feature **Enabled** or **Disabled**. Default is **Enabled**.
When enabled, Trunk posts comments on pull requests with merge queue status updates and instructions (e.g., "To merge this pull request, check the box to the left or comment `/trunk merge`").
**When to disable:**
* **Testing and evaluation** - Validate the merge queue works with your CI setup without notifying your development team. Once configured and ready, re-enable comments to roll out to developers.
* **Custom tooling** - You're building your own bot or integration that will provide merge queue instructions to developers, making Trunk's default comments redundant.
![]() ***
## GitHub Statuses
> Toggle this feature **Enabled** or **Disabled**. Default is **Enabled**.
When enabled, Trunk posts a GitHub check on PRs that are in the merge queue. The check appears in the PR's Checks section with the name `Trunk Merge Queue (
***
## GitHub Statuses
> Toggle this feature **Enabled** or **Disabled**. Default is **Enabled**.
When enabled, Trunk posts a GitHub check on PRs that are in the merge queue. The check appears in the PR's Checks section with the name `Trunk Merge Queue ()` (for example, `Trunk Merge Queue (main)` for a queue on `main`) and updates as the PR moves through the queue, from queued to testing to a final outcome.
Each check includes a **Details** link that goes directly to the PR's page in the Trunk dashboard. This gives developers visibility into their PR's queue position without leaving GitHub.
**When to enable:**
* **Team adoption** - Makes the merge queue visible in developers' existing GitHub workflow
* **Status-based automation** - Other tools or workflows can react to the queue check
See [GitHub status check](../using-the-queue/monitor-queue-status#github-status-check) for details on each status value.
***
## GitHub commands
> Toggle this feature **Enabled** or **Disabled**. Default is **Enabled**.
Whether or not GitHub slash commands like `/trunk merge` are enabled for this merge queue.
**When to disable:**
* **API-only workflows** - You want all queue submissions to go through the public API (e.g., via a bot or custom automation) rather than individual developer commands.
* **Holding pattern** - You're temporarily restricting queue submissions while investigating issues, performing maintenance, or coordinating with your team. (Note: Consider using the Paused or Draining queue state if you want to stop all new PRs from entering the queue.)
***
## Label Commands
> Toggle this feature **Enabled** or **Disabled**. Default is **Enabled**.
Use GitHub PR labels to enqueue and dequeue pull requests, as an alternative to [GitHub commands](#github-commands) or the merge checkbox. Adding the configured label to a PR submits it to the queue; removing the label cancels it.
### Enqueueing label
When Label Commands is enabled, set the label that submits a PR to the queue. The default is `trunk-merge-queue-submit`. Choose any label name that fits your team's conventions.
**When to use:**
* **Automation** - Tools and workflows that already manage PR labels can enqueue PRs by applying the label, without calling the API or posting a comment.
* **GitHub-native workflow** - Developers who prefer managing PRs through labels can submit and cancel without learning slash commands.
***
## State Labels
> Toggle this feature **Enabled** or **Disabled**. Default is **Disabled**.
When enabled, Trunk applies a label to each PR reflecting its current state in the merge queue (for example, queued, testing, or failed) and updates it as the PR moves through the queue. This surfaces queue status directly in GitHub's PR list and label filters.
Once a PR has been given a state label, Trunk continues to manage that PR's labels even if this setting is later disabled. Disabling State Labels stops new PRs from being labeled, but PRs already labeled keep having their labels updated.
***
## Browser Extension
> Toggle this feature **Enabled** or **Disabled**. Default is **Enabled**.
Controls whether the [Trunk browser extension](../browser-extensions) is active for this branch's merge queue. When enabled, the extension (if installed) shows merge queue information on GitHub PR pages for this branch. When disabled, the extension behaves as though no merge queue is configured for the branch, hiding all merge queue UI on those pages.
**When to disable:**
* **Quiet rollout** - You're evaluating the merge queue on a new repository and want to add it without surfacing merge queue UI to other developers. Disable the extension for the branch while you test, then re-enable it when you're ready to roll out to your team.
***
## Connect with Slack
[Connect Trunk Merge Queue to Slack](../integration-for-slack) to receive real-time notifications about queue activity. After [installing the Trunk Slack app](../integration-for-slack#installing-the-trunk-slack-app) for your organization, you can route notifications to **multiple Slack channels** per repository, each with its own set of enabled topics. Individual users can also receive **personal DMs** about their PRs.
**Available notifications include:**
* Pull requests submitted to or removed from the queue
* Testing status updates (ready, in progress, passed, failed)
* Successful merges
* Queue configuration changes (pausing, mode changes, concurrency adjustments)
* Pull request cancellations
***
## Batching
> Toggle this feature **Enabled** or **Disabled**. Default is **Disabled**.
[**Batching**](../optimizations/batching) tests multiple pull requests as a single unit instead of individually, dramatically reducing CI costs.
### Bisection Concurrency
Configure how many PRs can be tested simultaneously during batch failure isolation (bisection). This setting is independent from the main Testing Concurrency and only applies when batches fail and need to be split to identify the failing PR.
**Default:** Same as Testing Concurrency (automatically mirrors your main concurrency setting)
**Recommended:** Set 2-5x higher than your main Testing Concurrency for faster failure isolation
**How to configure:**
1. Navigate to the **Merge Queue** tab, select your queue, click **Settings**, then scroll to **Batching**
2. Make sure **Batching** is enabled
3. Set **Bisection Concurrency** to your desired value
4. Monitor CI resource usage and adjust as needed
For detailed guidance on using this setting effectively, see [Bisection Concurrency in the Batching](../optimizations/batching#bisection-concurrency) documentation.
***
## Delete Merge Integration
CAUTION: Any queued merge requests will not be merged and all data will be lost.
**Before deleting:** Make sure all important PRs in the queue are either merged manually or that you're prepared to resubmit them to a new queue.
This setting will delete the Merge Queue configuration and any queued merge requests will not be merged and all data will be lost.
**When to use this:**
* **Switching target branches** - If you need to change which branch the queue merges into (e.g., switching from a test branch during POC to `main` for production use), you must delete the current queue and create a new one pointing to your desired branch.
* **Removing Merge Queue** - You're decommissioning Merge Queue for this repository entirely.
* **Starting fresh** - You want to reset all configuration.
**Confirming the deletion.** The confirmation dialog shows the repository name and target branch of the queue you're about to delete. Check both before you confirm, especially when the dashboard is scrolled and the repository name is no longer on screen.
# Administration
Source: https://docs.trunk.io/merge-queue/administration/index
Configuration, integrations, and analytics for queue administrators.
These pages are for repository administrators and platform engineers who configure and maintain the merge queue. Use this section to set up integrations, adjust queue behavior, and track performance metrics across your team.
## Configuration
[**Settings and configurations**](./advanced-settings)\
Manage queue behavior, GitHub integration, CI/CD configuration, and user preferences.
## Infrastructure as Code
[**Terraform provider**](./terraform)\
Manage merge queue configuration as code using the `trunk-io/trunk` Terraform provider.
## Integrations
[**Integration for Slack**](../integration-for-slack)\
Send real-time queue notifications to Slack channels.
[**Webhooks**](../webhooks)\
Integrate with external tools via HTTP webhooks for custom automation.
## Analytics
[**Metrics and monitoring**](./metrics)\
Track queue performance, identify bottlenecks, and measure optimization impact.
# Metrics and monitoring
Source: https://docs.trunk.io/merge-queue/administration/metrics
Monitor Trunk Merge Queue throughput, wait times, and health with built-in metrics.
The Metrics and Monitoring dashboard provides deep analytics on your merge queue's performance, helping you identify bottlenecks, measure improvements, and optimize your workflow.
Your merge experience directly impacts the velocity and productivity of your development team. Merge Queue Metrics provides observability for the **health** of your Trunk Merge Queue, so you can discover issues early and make informed optimizations.
![Health tab of the Trunk web app showing a Conclusion Counts stacked bar chart and a Time in Queue p50 line chart over a 30-day range]() ## Access metrics
You can access the metrics in your Trunk Merge Queue by navigating to the **Merge Queue** → **\[repository]** → **Health** tab.
## Access metrics
You can access the metrics in your Trunk Merge Queue by navigating to the **Merge Queue** → **\[repository]** → **Health** tab.
CI Time and CI Jobs Triggered charts are only available for **GitHub Actions**.
## Filter Metrics by Impacted Targets
When running in Parallel Mode, you can filter your merge queue health metrics by impacted targets to analyze performance for specific parts of your codebase.
![Health dashboard filtered by PR Conclusion: Failed and Impacted Targets: //trunk/all-ts:node_modules/@trunkio, showing a single failure bar and a p50 Time in Queue line]() ### Why Filter by Impacted Targets?
In repositories with multiple teams or distinct components (like a TypeScript/Python monorepo), different parts of your codebase may have different merge characteristics. Filtering by impacted targets helps you:
* **Analyze team-specific performance** - See how PRs from different teams move through the queue
* **Identify bottlenecks by component** - Determine if certain targets have slower merge times
* **Optimize strategically** - Focus queue configuration improvements on your highest-priority code paths
* **Demonstrate value** - Show engineering leadership how parallel mode benefits specific teams or projects
* **Check fairness** - Verify that all teams experience similar queue performance
### How to Use the Filter
1. Navigate to **Merge Queue** → **\[your repository]** → **Health** tab in the Trunk web app
2. Locate the **Impacted Targets** filter dropdown at the top of the metrics dashboard
3. Select one or more targets to filter by:
* **All Targets** (default) - Shows aggregate metrics across all PRs
* **Specific target names** - Shows metrics only for PRs affecting that target (e.g., `frontend`, `backend`, `//services/api`)
4. All charts and metrics on the page will update to reflect only PRs impacting the selected targets
### Understanding the Data
**Impacted targets are set when a PR enters the queue.** Each PR's impacted targets are calculated based on which files changed and which parts of your codebase are affected. For details on how impacted targets are computed, see [Parallel Queues - Impacted Targets](../optimizations/parallel-queues/#posting-impacted-targets-from-your-pull-requests).
**PRs can affect multiple targets.** A PR that changes both frontend and backend code will be counted in metrics when filtering by either `frontend` OR `backend`. This means the numbers may not sum to 100% when viewing multiple target filters separately.
**"All Targets" shows aggregate performance.** Selecting "All Targets" displays metrics for every PR, regardless of which targets it impacts. This is the default view and shows overall queue health.
### Requirements
**Parallel Mode must be enabled.** Impacted target filtering is only available when your merge queue is running in Parallel Mode. Repositories in Single Mode do not track impacted targets.
**Impacted targets must be uploaded.** Your CI workflow must calculate and upload impacted targets for each PR. See the Parallel Queues documentation for setup instructions using:
* Bazel
* Nx
* Custom build systems
## Export metrics as CSV
Each chart on the Health dashboard has a download icon in its top-right corner. Clicking it exports the chart's current data as a CSV file, using the same filters and time range shown on screen.
Exported filenames follow the pattern `
### Why Filter by Impacted Targets?
In repositories with multiple teams or distinct components (like a TypeScript/Python monorepo), different parts of your codebase may have different merge characteristics. Filtering by impacted targets helps you:
* **Analyze team-specific performance** - See how PRs from different teams move through the queue
* **Identify bottlenecks by component** - Determine if certain targets have slower merge times
* **Optimize strategically** - Focus queue configuration improvements on your highest-priority code paths
* **Demonstrate value** - Show engineering leadership how parallel mode benefits specific teams or projects
* **Check fairness** - Verify that all teams experience similar queue performance
### How to Use the Filter
1. Navigate to **Merge Queue** → **\[your repository]** → **Health** tab in the Trunk web app
2. Locate the **Impacted Targets** filter dropdown at the top of the metrics dashboard
3. Select one or more targets to filter by:
* **All Targets** (default) - Shows aggregate metrics across all PRs
* **Specific target names** - Shows metrics only for PRs affecting that target (e.g., `frontend`, `backend`, `//services/api`)
4. All charts and metrics on the page will update to reflect only PRs impacting the selected targets
### Understanding the Data
**Impacted targets are set when a PR enters the queue.** Each PR's impacted targets are calculated based on which files changed and which parts of your codebase are affected. For details on how impacted targets are computed, see [Parallel Queues - Impacted Targets](../optimizations/parallel-queues/#posting-impacted-targets-from-your-pull-requests).
**PRs can affect multiple targets.** A PR that changes both frontend and backend code will be counted in metrics when filtering by either `frontend` OR `backend`. This means the numbers may not sum to 100% when viewing multiple target filters separately.
**"All Targets" shows aggregate performance.** Selecting "All Targets" displays metrics for every PR, regardless of which targets it impacts. This is the default view and shows overall queue health.
### Requirements
**Parallel Mode must be enabled.** Impacted target filtering is only available when your merge queue is running in Parallel Mode. Repositories in Single Mode do not track impacted targets.
**Impacted targets must be uploaded.** Your CI workflow must calculate and upload impacted targets for each PR. See the Parallel Queues documentation for setup instructions using:
* Bazel
* Nx
* Custom build systems
## Export metrics as CSV
Each chart on the Health dashboard has a download icon in its top-right corner. Clicking it exports the chart's current data as a CSV file, using the same filters and time range shown on screen.
Exported filenames follow the pattern `--_.csv`. Timestamps match the chart's UTC setting: when **Time in UTC** is on, timestamps are in UTC; otherwise they use your local timezone. The download button is greyed out when the current filters return no data.
## Time buckets
The date ranges selector at the top left of the dashboard allows you to filter the data displayed by date and time. You can display time buckets by the day or hour in the day/hour dropdown.
The metrics displayed only include data that have **completed within the time range**, jobs started but not completed during the selected time **will not be displayed**.
When working across multiple time zones, enable **Time in UTC** so everyone sees the same data.
## Conclusion count
Conclusion count displays the number of pull requests that exited the merge queue during each time bucket. This includes passes, failures, and cancellations. Passes and failures signal a PR that was tested in the queue to completion, while canceled signals that the request to merge terminated before testing finished or before testing began.
Conclusion counts are an important signal to potential bottlenecks or underlying issues with your merging process, as a failure or cancellation in the merge queue can force other PRs to **restart their testing**. A spike in the number of failures or passes can indicate a potential problem to investigate.
Conclusions are tagged with a reason to give further insights into how merges pass or fail in the queue. You can show or hide conclusions of a particular reason by using the **+ Add** button.
| Category | Reason | Description |
| -------- | ---------------------------- | ------------------------------------------------------------------------------------ |
| Pass | Merged by Trunk | Passed all tests in Merge Queue and merged by Trunk |
| Pass | Merged manually | User manually merged the PR in Git |
| Failure | Test run timeout | User-defined timeout for tests exceeded |
| Failure | Failed Tests | Required test failed while testing the PR in the merge queue |
| Failure | Merge conflict | A (git) merge conflict encountered |
| Failure | Config parsing failure | Malformed `trunk.yaml` that couldn't be parsed |
| Failure | Config bad version | Invalid version field in `trunk.yaml` |
| Failure | Config bad required statuses | Failed to parse required statuses in `trunk.yaml` |
| Failure | No required statuses | No source for required tests was found in `trunk.yaml` or branch protection settings |
| Failure | GitHub API Failed | GitHub returned an error to us that could not be resolved while processing the PR |
| Failure | PR updated at merge time | PR updated as Trunk was attempting to merge it |
| Cancel | Canceled by user | PR explicitly canceled by user |
| Cancel | PR closed | PR closed (not merged) |
| Cancel | PR pushed to | New commits pushed to the PR branch while in the merge queue |
| Cancel | PR draft | PR was converted to a draft, which cannot be merged |
| Cancel | PR base branch changed | Base branch of PR in the merge queue changed |
| Cancel | Admin requested | Trunk employee canceled PR during a support session (extreme cases) |
## Time in queue
Time in queue shows how long each PR spends in the Merge Queue from the moment the PR enters the queue to the moment when it exits the queue, either from merging, failing, or being canceled.
Understanding the amount of time a pull request spends in the queue is important for ensuring your merge process continues to ship code quickly. A spike in the time to merge indicates a slowdown somewhere that's impacting all developers. For example, it's taking longer to run tests on PRs, PRs are waiting too long to start testing, or constant failures in the queue are causing PRs to take longer to merge
The time in queue can be displayed as different statistical measures. You can show or hide them by using the **+ Add** button.
| Measure | Explanation |
| ------- | --------------------------------------------------- |
| Average | Average of all time in queue during the time bucket |
| Minimum | The shortest time in queue in the time bucket. |
| Maximum | The longest time in queue in the time bucket. |
| Sum | The total of all time in queue added together. |
| P50 | The value below 50% of the time in queue falls. |
| P95 | The value below 95% of the time in queue falls. |
| P99 | The value below 99% of the time in queue falls. |
## Drill down into metrics
From the **Conclusion count** and **Time in queue** charts, you can drill into any point or window on the graph to see the exact pull requests that made up those numbers.
### Why Drill Down?
Aggregated charts tell you *that* something happened — drilling down tells you *which PRs* caused it. This makes it easy to:
* **Track down outliers** — if the P99 on Time in queue spikes, drill into that bucket to find the specific PR that dragged the tail out.
* **Investigate failure spikes** — click a bar on Conclusion count where failures jumped and see exactly which PRs failed and why.
* **Audit a time window** — pull the full list of PRs merged, failed, or canceled during an incident window or release cut.
* **Answer one-off questions** — "which PRs merged between 2pm and 4pm yesterday?" without writing a query against the Prometheus endpoint.
### Select Data Points
You have two ways to select:
* **Click a single data point** to see the PRs in that time bucket.
* **Click and drag across the chart** to select a range of data points spanning multiple time buckets. The selected range stays highlighted and the rest of the chart dims, giving you a focused view of just that window. The same range syncs across both charts so you can correlate Conclusion count and Time in queue data for the period you picked.
Once a selection is made, a **View PRs** button appears. Click it to open the list of PRs that make up the selection.
![PR Outcomes and Time in Queue charts with a selected Apr 20–21 range broken out into 998 merged, 30 cancelled, and 30 failed, and a selection bar showing the View PRs button]() To pick a different window, drag a new selection. To clear the selection, change the time range, time bucket, or **Time in UTC** setting at the top of the dashboard.
### Review the PR List
The PR list page shows every PR included in your selection, along with:
* **Conclusion** — whether the PR merged, failed, or was cancelled.
* **Reason** — the specific cause behind the conclusion (for example, Merged by Trunk, Required status failed, PR closed). See the [Conclusion count](#conclusion-count) table for the full list.
* **Time in queue** — how long the PR spent in the merge queue from entry to exit.
Both columns are sortable, so you can quickly surface the longest-running PRs in a window or group all failures of the same type together.
To pick a different window, drag a new selection. To clear the selection, change the time range, time bucket, or **Time in UTC** setting at the top of the dashboard.
### Review the PR List
The PR list page shows every PR included in your selection, along with:
* **Conclusion** — whether the PR merged, failed, or was cancelled.
* **Reason** — the specific cause behind the conclusion (for example, Merged by Trunk, Required status failed, PR closed). See the [Conclusion count](#conclusion-count) table for the full list.
* **Time in queue** — how long the PR spent in the merge queue from entry to exit.
Both columns are sortable, so you can quickly surface the longest-running PRs in a window or group all failures of the same type together.
![PRs in Range table listing individual PRs with Conclusion (Merged or Failed), Reason, and Time in Queue columns, sorted by Time in Queue descending]() The PR list page shows the selected date range as a subtitle and a **Back to Health** link to return to the charts. If the selection contains more than 2,500 PRs, the list shows the first 2,500 with a notice indicating the total. Narrow the time bucket on the chart to drill into a smaller window.
The PR list page shows the selected date range as a subtitle and a **Back to Health** link to return to the charts. If the selection contains more than 2,500 PRs, the list shows the first 2,500 with a notice indicating the total. Narrow the time bucket on the chart to drill into a smaller window.
Drill down and range selection are currently available on the Conclusion count and Time in queue charts. Additional Health charts will support the same interactions as they land in the UI.
***
## Prometheus metrics endpoint
Trunk exposes merge queue metrics in [Prometheus text exposition format](https://prometheus.io/docs/instrumenting/exposition_formats/) via a scrapable API endpoint. Use this to build custom Grafana dashboards, set up alerts, or integrate merge queue health into your existing observability stack.
The Prometheus metrics endpoint is available to all Merge Queue users.
### Endpoint
```
GET https://api.trunk.io/v1/getMergeQueueMetrics
```
Authenticate with your [Trunk API token](../../setup-and-administration/apis/#authentication) using the `x-api-token` header.
**Query parameters:**
| Parameter | Required | Description |
| ---------- | ----------- | ---------------------------------------------------------------------------------------------------------------------------------------------------------------------------- |
| `repo` | No | Repository in `owner/name` format (e.g., `my-org/my-repo`). If omitted, returns metrics for all repositories in the organization. Must be provided together with `repoHost`. |
| `repoHost` | Conditional | Repository host (e.g., `github.com`). Required if `repo` is specified. |
The response uses content type `text/plain; version=0.0.4; charset=utf-8` (standard Prometheus format).
### Available metrics
All metrics include these labels:
| Label | Description | Example values |
| ------------ | ---------------- | --------------------- |
| `repo` | Repository name | `my-org/my-repo` |
| `branch` | Base branch name | `main`, `develop` |
| `queue_type` | Queue type | `main` or `bisection` |
**Point-in-time gauges** reflect the current state of your merge queue.
| Metric | Type | Description |
| -------------------------- | ----- | ----------------------------------------------------------------------------------------------------------------------- |
| `mq_depth_current` | Gauge | Number of PRs currently in the queue (excludes PRs that are waiting to be mergeable before being admitted to the queue) |
| `mq_awaiting_mergeability` | Gauge | Number of PRs waiting for prerequisites like required reviews or status checks |
| `mq_testing_slots_active` | Gauge | Number of test PRs currently active (active CI slots in use - a batch counts as 1 slot) |
| `mq_prs_testing` | Gauge | Number of PRs currently in TESTING state (can be more than `mq_testing_slots_active` if batching is enabled) |
**Rolling 1-hour window metrics** summarize activity over a sliding 1-hour window. They update continuously as the window advances.
| Metric | Type | Extra labels | Description |
| -------------------------------- | --------- | ---------------------------------------- | ------------------------------------------------------------------------------------------------------------------------------------------------------------------------------------------- |
| `mq_pr_conclusions_1h_total` | Gauge | `conclusion` (merged, failed, cancelled) | PRs that exited the queue in the last hour |
| `mq_pr_restarts_1h_total` | Gauge | — | PR restarts (TESTING to PENDING transitions) in the last hour |
| `mq_pr_wait_duration_1h_seconds` | Histogram | `le` (bucket boundary) | Distribution of time PRs spent waiting before testing starts |
| `mq_pr_test_duration_1h_seconds` | Histogram | `le` (bucket boundary) | Distribution of time PRs spent in the testing phase |
| `mq_pr_time_in_queue_1h_seconds` | Histogram | `le` (bucket boundary) | Distribution of total time PRs spent in the queue, from entry to exit (includes waiting, testing, and any other phases, such as [pending failure](../optimizations/pending-failure-depth)). |
Each histogram emits `_bucket{le="..."}`, `_sum`, and `_count` series. Bucket boundaries (in seconds): 60, 300, 600, 900, 1800, 3600, 5400, 7200, +Inf.
For clarity, PRs in the "Waiting to Enter Queue" state (submitted to the queue but still waiting on prerequisites such as GitHub mergeability before they can be admitted to the queue) are not considered to be "in the queue" yet. So any time spent in this state is not counted in the Wait Duration or Time in Queue metrics.
Rolling window metrics use **gauge semantics**, not true Prometheus counters. They represent a snapshot of the last hour, not cumulative totals. PromQL functions like `rate()` and `increase()` are **not meaningful** on these metrics. Use the values directly instead.
### Scrape configuration
Configure your Prometheus instance to scrape the Trunk metrics endpoint:
```yaml theme={null}
scrape_configs:
- job_name: trunk-merge-queue
scrape_interval: 60s
scheme: https
static_configs:
- targets: ['api.trunk.io']
metrics_path: /v1/getMergeQueueMetrics
params:
repo: ['my-org/my-repo']
repoHost: ['github.com']
http_headers:
x-api-token:
values: ['']
```
To scrape metrics for all repositories in your organization, omit both the `repo` and `repoHost` parameters.
### Datadog Agent configuration
You can ingest Trunk merge queue metrics into Datadog using the Datadog Agent's built-in [OpenMetrics integration](https://docs.datadoghq.com/integrations/openmetrics/). This lets Datadog scrape the Prometheus endpoint directly without requiring a separate Prometheus server.
**1. Enable the OpenMetrics integration**
Create or edit `/etc/datadog-agent/conf.d/openmetrics.d/conf.yaml`:
```yaml theme={null}
instances:
- openmetrics_endpoint: https://api.trunk.io/v1/getMergeQueueMetrics?repo=my-org/my-repo&repoHost=github.com
namespace: trunk_merge_queue
metrics:
- mq_.*
headers:
x-api-token:
min_collection_interval: 60
send_distribution_buckets: true
```
To collect metrics for all repositories in your organization, omit the query parameters:
```yaml theme={null}
openmetrics_endpoint: https://api.trunk.io/v1/getMergeQueueMetrics
```
**2. Restart the Datadog Agent**
```bash theme={null}
sudo systemctl restart datadog-agent
```
**3. Validate**
```bash theme={null}
sudo -u dd-agent -- datadog-agent check openmetrics
```
All metrics are prefixed with your configured `namespace` value. For example, `mq_depth_current` becomes `trunk_merge_queue.mq_depth_current` in Datadog.
### Example queries
**Queue health alerts:**
```promql theme={null}
# Alert when queue depth exceeds threshold
mq_depth_current{branch="main"} > 10
# Max queue depth over the last hour
max_over_time(mq_depth_current{branch="main"}[1h])
# CI utilization (if you have 8 concurrency slots)
mq_testing_slots_active{branch="main",queue_type="main"} / 8
```
**Failure analysis:**
```promql theme={null}
# Failure rate over the last hour
mq_pr_conclusions_1h_total{conclusion="failed"}
/
ignoring(conclusion) sum(mq_pr_conclusions_1h_total)
# Alert on high failure count
mq_pr_conclusions_1h_total{conclusion="failed"} > 5
```
**Duration analysis:**
```promql theme={null}
# P90 wait time (time before testing starts)
histogram_quantile(0.90, sum(mq_pr_wait_duration_1h_seconds_bucket) by (le))
# Average wait time
mq_pr_wait_duration_1h_seconds_sum / mq_pr_wait_duration_1h_seconds_count
# Restart ratio (restarts per merge)
mq_pr_restarts_1h_total / mq_pr_conclusions_1h_total{conclusion="merged"}
```
### Sample output
```
# HELP mq_depth_current PRs currently in the queue
# TYPE mq_depth_current gauge
mq_depth_current{repo="my-org/my-repo",branch="main",queue_type="main"} 4
# HELP mq_awaiting_mergeability Number of PRs currently awaiting mergeability
# TYPE mq_awaiting_mergeability gauge
mq_awaiting_mergeability{repo="my-org/my-repo",branch="main",queue_type="main"} 1
# HELP mq_testing_slots_active PRs currently in TESTING state
# TYPE mq_testing_slots_active gauge
mq_testing_slots_active{repo="my-org/my-repo",branch="main",queue_type="main"} 3
# HELP mq_pr_conclusions_1h_total PRs exiting the queue in last hour
# TYPE mq_pr_conclusions_1h_total gauge
mq_pr_conclusions_1h_total{repo="my-org/my-repo",branch="main",queue_type="main",conclusion="merged"} 12
mq_pr_conclusions_1h_total{repo="my-org/my-repo",branch="main",queue_type="main",conclusion="failed"} 1
mq_pr_conclusions_1h_total{repo="my-org/my-repo",branch="main",queue_type="main",conclusion="cancelled"} 0
# HELP mq_pr_restarts_1h_total PR restarts in last hour
# TYPE mq_pr_restarts_1h_total gauge
mq_pr_restarts_1h_total{repo="my-org/my-repo",branch="main",queue_type="main"} 2
```
# Terraform Provider
Source: https://docs.trunk.io/merge-queue/administration/terraform
Manage Trunk Merge Queue configuration as code using the trunk-io/trunk Terraform provider.
The [trunk-io/trunk](https://registry.terraform.io/providers/trunk-io/trunk/latest) Terraform provider lets you manage merge queue configuration as infrastructure as code. Define your queue settings in Terraform, track changes in version control, and apply them consistently across repositories.
The provider currently supports the `trunk_merge_queue` resource for creating, updating, importing, and deleting merge queues.
**Current version:** `0.1.3`
## Prerequisites
* [Terraform](https://developer.hashicorp.com/terraform/install) >= 1.0
* An org-level API token from your Trunk organization. See [Organization slug and token](../../setup-and-administration/managing-your-organization#organization-slug-and-token) for how to generate one.
* A repository connected to Trunk
## Authentication
Set your org-level API token using the `TRUNK_API_KEY` environment variable:
```bash theme={null}
export TRUNK_API_KEY="your-org-api-token"
```
Alternatively, you can pass it directly in the provider block:
```hcl theme={null}
provider "trunk" {
api_key = var.trunk_api_key
}
```
Never commit your API key to version control. Use environment variables or a secrets manager to supply the `TRUNK_API_KEY` value.
***
## Quick Start
```hcl theme={null}
terraform {
required_version = ">= 1.0"
required_providers {
trunk = {
source = "trunk-io/trunk"
version = "0.1.3"
}
}
}
provider "trunk" {}
resource "trunk_merge_queue" "main" {
repo = {
host = "github.com"
owner = "my-org"
name = "my-repo"
}
target_branch = "main"
concurrency = 5
}
```
Run `terraform plan` to preview changes and `terraform apply` to apply them. If a merge queue already exists for the specified repository and branch, the provider will import it automatically rather than creating a duplicate.
***
## Importing Existing Queues
Merge queues created through the UI or API can be imported into Terraform. This lets you start managing an existing queue as code without recreating it.
```bash theme={null}
terraform import trunk_merge_queue.main github.com/my-org/my-repo/main
```
The import ID format is `{host}/{owner}/{name}/{target_branch}`.
After importing, run `terraform plan` to compare the Terraform configuration against the current queue settings. Resolve any differences before running `terraform apply`.
***
## Resource Reference: `trunk_merge_queue`
### Required Attributes
| Attribute | Type | Description |
| --------------- | ------ | ----------------------------------------------------------------------------------- |
| `repo.host` | string | Repository host (e.g., `github.com`). Changing this forces a new resource. |
| `repo.owner` | string | Repository owner or organization. Changing this forces a new resource. |
| `repo.name` | string | Repository name. Changing this forces a new resource. |
| `target_branch` | string | Branch the merge queue targets (e.g., `main`). Changing this forces a new resource. |
The `repo` and `target_branch` attributes are immutable. Changing any of them will destroy the existing queue and create a new one.
### Optional Attributes With API Defaults
These attributes are computed by the API if not specified. You only need to set them if you want to override the defaults.
| Attribute | Type | Default | Description |
| ------------- | ------- | ----------- | --------------------------------------------------------------------------------------------------------------------------- |
| `mode` | string | `"single"` | Queue mode: `"single"` or `"parallel"`. See [Merge Queue mode](./advanced-settings#merge-queue-mode). |
| `concurrency` | integer | API default | Number of PRs that can test simultaneously (minimum 1). See [Testing concurrency](./advanced-settings#testing-concurrency). |
| `state` | string | `"RUNNING"` | Queue state: `"RUNNING"`, `"PAUSED"`, or `"DRAINING"`. See [Merge Queue state](./advanced-settings#merge-queue-state). |
### Other Optional Attributes
| Attribute | Type | Description |
| --------------------------------- | ------------ | ---------------------------------------------------------------------------------------------------------------------------------------------------------------------------------------------------------- |
| `testing_timeout_minutes` | integer | Maximum minutes to wait for tests before auto-cancellation. See [Timeout for tests to complete](./advanced-settings#timeout-for-tests-to-complete). |
| `pending_failure_depth` | integer | Number of successor test runs to wait on before transitioning a failed group. See [Pending failure depth](../optimizations/pending-failure-depth). |
| `can_optimistically_merge` | Boolean | Enable [optimistic merging](../optimizations/optimistic-merging). |
| `batch` | Boolean | Enable [batching](../optimizations/batching). |
| `batching_max_wait_time_minutes` | integer | Maximum minutes to wait for a batch to fill. |
| `batching_min_size` | integer | Minimum number of PRs in a batch before testing begins. |
| `merge_method` | string | How PRs are merged: `"MERGE_COMMIT"`, `"SQUASH"`, or `"REBASE"`. See [Merge Method](./advanced-settings#merge-method). |
| `comments_enabled` | Boolean | Whether Trunk posts status comments on PRs. See [GitHub comments](./advanced-settings#github-comments). |
| `commands_enabled` | Boolean | Whether `/trunk` slash commands are enabled. See [GitHub commands](./advanced-settings#github-commands). |
| `create_prs_for_testing_branches` | Boolean | Create draft PRs for testing branches. See [Draft pull request creation](./advanced-settings#draft-pull-request-creation). |
| `status_check_enabled` | Boolean | Whether Trunk posts a status check on PRs. |
| `direct_merge_mode` | string | `"OFF"` or `"ALWAYS"`. See [Direct merge to main](../optimizations/direct-merge-to-main). |
| `optimization_mode` | string | `"OFF"` or `"BISECTION_SKIP_REDUNDANT_TESTS"`. |
| `bisection_concurrency` | integer | Concurrency for bisection testing during batch failure isolation. See [Bisection Concurrency](./advanced-settings#bisection-concurrency). |
| `required_statuses` | list(string) | CI status checks that must pass. Set to `null` to use branch protection defaults. Set to `[]` to explicitly require no statuses. See [Required Status Checks](./advanced-settings#required-status-checks). |
***
## Managing Drift
When a merge queue is managed by Terraform, the Trunk UI displays a banner indicating that the queue is under Terraform management.
![]() Users can still adjust merge queue settings through the UI. However, any changes made in the UI will cause **drift** between the live configuration and your Terraform state. The UI highlights when drift exists so your team is aware of the discrepancy.
Users can still adjust merge queue settings through the UI. However, any changes made in the UI will cause **drift** between the live configuration and your Terraform state. The UI highlights when drift exists so your team is aware of the discrepancy.
![]() To detect drift, run:
```bash theme={null}
terraform plan
```
This shows any differences between your Terraform configuration and the current queue state. Run `terraform apply` to reconcile the configuration back to what is defined in Terraform, or update your `.tf` files to match the desired state.
To detect drift, run:
```bash theme={null}
terraform plan
```
This shows any differences between your Terraform configuration and the current queue state. Run `terraform apply` to reconcile the configuration back to what is defined in Terraform, or update your `.tf` files to match the desired state.
If your team adjusts settings through the UI, run `terraform plan` periodically to detect drift. Apply to reconcile, or update your Terraform configuration to match the desired state.
***
## Deleting a Queue
A merge queue must be empty before it can be deleted. If the queue still has PRs in it, `terraform destroy` will fail.
To empty a queue, you can set `state = "DRAINING"` and wait for all in-flight PRs to finish testing and merge. Once the queue is empty, run `terraform destroy` or remove the resource from your configuration and apply.
Terraform will fail to delete a queue that still has PRs in it. Ensure the queue is empty before destroying the resource.
***
## Examples
### High-Throughput Queue With Batching
```hcl theme={null}
resource "trunk_merge_queue" "main" {
repo = {
host = "github.com"
owner = "my-org"
name = "my-repo"
}
target_branch = "main"
mode = "parallel"
concurrency = 20
batch = true
batching_min_size = 4
batching_max_wait_time_minutes = 5
can_optimistically_merge = true
}
```
### Queue With Explicit Required Statuses
```hcl theme={null}
resource "trunk_merge_queue" "main" {
repo = {
host = "github.com"
owner = "my-org"
name = "my-repo"
}
target_branch = "main"
concurrency = 3
merge_method = "SQUASH"
commands_enabled = true
comments_enabled = true
required_statuses = [
"ci/build",
"ci/test",
"ci/lint",
]
}
```
# Browser Extensions
Source: https://docs.trunk.io/merge-queue/browser-extensions
Submit, cancel, and track Trunk Merge Queue pull requests directly from GitHub with the Trunk browser extension for Chrome and Firefox. Optionally shows Flaky Tests results inline on the PR page.
The Trunk browser extension overlays merge queue controls and status onto your normal GitHub experience, so you can submit a PR to the queue, cancel it, and watch its testing progress without leaving the pull request page. It ships for Chrome and Firefox from the same codebase, so the panel and its controls work the same in both.
![Trunk Merge Queue panel on a GitHub pull request]()
The extension is a companion to Trunk Merge Queue — you still need a configured queue for your repository. The extension only surfaces controls and status for queues your Trunk organization already owns.
## Install the extension
Install it from your browser's store:
Chrome, plus Chromium browsers like Edge, Brave, and Arc.
Firefox 140+ on desktop, Firefox 142+ on Android.
Once it's added:
1. Approve the requested permissions when your browser prompts you.
2. Pin the Trunk icon to your toolbar so the popup is one click away.
3. Click the Trunk icon and sign in. The extension uses your existing browser session at [app.trunk.io](https://app.trunk.io/) - if you're already logged in, no additional sign-in is needed.
**Signed-out indicator**
When you are not signed in to Trunk, the extension toolbar icon shows an amber **!** badge on any GitHub tab. The extension does not modify GitHub's UI while signed out, so no merge queue panel or sign-in prompt appears on pull request pages. Click the Trunk toolbar icon and sign in to activate the extension.
**Disabled-repository behavior**
If the extension is [disabled for a repository's queue](/merge-queue/administration/advanced-settings#browser-extension), the extension leaves GitHub's UI untouched for that repository's pull requests, the same as when signed out.
## Submit a pull request to the queue
On any pull request in a queue-enabled repository, the extension adds a **Merge Queue** panel replacing GitHub's native merge controls.
1. Open the pull request on GitHub.
2. In the Trunk panel, click **Add to Merge Queue**.
3. Optionally choose a [priority](./optimizations/priority-merging) before submitting. The dropdown includes **Normal** (default), **Low**, **High**, and **Urgent**. Urgent forces the PR to the front of the queue and restarts any in-progress testing; use it only for production incidents.
4. If batching is enabled for the repository, you can toggle **Skip batching** to enqueue this PR without grouping it into a batch — useful for hotfixes or PRs that need to merge without waiting for a batch window.
Submission goes through the same backend as the `/trunk merge` comment and the Trunk web app, so behavior is identical. See [Submit and cancel pull requests](./using-the-queue/reference) for the full lifecycle.
## Remove a pull request from the queue
If a PR is already in the queue, the panel shows a **Cancel** action.
1. Click **Cancel** in the Trunk panel on the PR page.
2. The PR is removed from the queue immediately, the same as running `/trunk cancel`.
## Track testing progress
Once a PR is in the queue, the extension panel updates in real time as it moves through each state:
* **Queued** - waiting for prerequisites such as branch protection or mergeability
* **Pending** - admitted to the queue, waiting for capacity
* **Waiting to Batch** - admitted to the queue and waiting for additional PRs to form a batch before testing begins (shown when batching is enabled and the queue is accumulating PRs)
* **Testing** - actively running required status checks against a merge candidate
* **Tests Passed** - waiting for upstream PRs before merging
* **Merged** - the PR merged successfully; the panel shows a success state and stops polling
* **Failed** - one or more required checks did not pass; the panel lists the checks that genuinely failed by name with links to their run logs. GitHub Actions cancels other required jobs the moment any single job fails, so the panel shows only the jobs that actually failed. Cancelled jobs appear only when no genuine failure is present (for example, when an entire run was cancelled)
* **Cancelled** - the PR was removed from the queue; the panel shows who cancelled it (for example, "Cancelled by alice") when that information is available
## Resubmit after failure or cancellation
When a PR leaves the queue in a **Failed** or **Cancelled** state, the extension panel shows a **Resubmit** button that re-enqueues the PR in one click. You do not need to switch to the Trunk web app or post a `/trunk merge` comment.
Failed check details come from the most recent testing attempt only. If a PR was re-enqueued after an earlier failure and then cancelled, the panel shows the cancellation state rather than check failures from the earlier run.
## Configuring row hiding
On pull requests managed by Trunk, the extension can hide parts of GitHub's native UI that its own panel makes redundant. Toggles hide status rows in GitHub's **merge box** (the panel at the bottom of a pull request that shows whether it can be merged) and Trunk's own merge-queue bot comments. Each toggle defaults to on and is saved per browser profile. To configure them, click the Trunk toolbar icon, open **Settings**, and find the **Hide rows** card.
![The Hide rows settings card in the Trunk extension popup, with toggles for Merging is blocked, Branch out of date, and Trunk (bot) GitHub Comments]() | Toggle | What it hides | Default |
| ------------------------------- | ---------------------------------------------------------------------------------------------------------------------------------------------------------------------------------------------------- | ------- |
| **Merging is blocked** | GitHub's "Merging is blocked" merge-box status row, replaced by the Trunk panel | On |
| **Branch out of date** | GitHub's informational Conflicts row when there are no actionable conflicts. Rows with "This branch has conflicts that must be resolved" or a **Resolve conflicts** control are always left visible. | On |
| **Unable to merge as stack** | GitHub's "Unable to merge as stack" section in the merge box. GitHub's native stack UI is still preserved below the hidden section. | On |
| **Trunk (bot) GitHub Comments** | Trunk bot comments that prompt you to submit a PR to the merge queue (for example, "To merge this pull request, check the box" or a comment containing a `/merge-queue/` link) | On |
Only Trunk's own merge-queue prompt comments (from the `trunk-io` bot account) are hidden. Comments from other bots and Trunk's non-merge-queue comments are left untouched. All submit, cancel, and status actions remain available through the extension panel regardless of these settings. Hiding is applied only on PR pages where the Trunk overlay is active.
## Test details panel
When enabled for your organization, the extension shows a **Test Details** panel on GitHub pull request pages for repositories that have [Flaky Tests uploads](../flaky-tests/overview) configured. The panel surfaces test run results without leaving the PR page.
| Toggle | What it hides | Default |
| ------------------------------- | ---------------------------------------------------------------------------------------------------------------------------------------------------------------------------------------------------- | ------- |
| **Merging is blocked** | GitHub's "Merging is blocked" merge-box status row, replaced by the Trunk panel | On |
| **Branch out of date** | GitHub's informational Conflicts row when there are no actionable conflicts. Rows with "This branch has conflicts that must be resolved" or a **Resolve conflicts** control are always left visible. | On |
| **Unable to merge as stack** | GitHub's "Unable to merge as stack" section in the merge box. GitHub's native stack UI is still preserved below the hidden section. | On |
| **Trunk (bot) GitHub Comments** | Trunk bot comments that prompt you to submit a PR to the merge queue (for example, "To merge this pull request, check the box" or a comment containing a `/merge-queue/` link) | On |
Only Trunk's own merge-queue prompt comments (from the `trunk-io` bot account) are hidden. Comments from other bots and Trunk's non-merge-queue comments are left untouched. All submit, cancel, and status actions remain available through the extension panel regardless of these settings. Hiding is applied only on PR pages where the Trunk overlay is active.
## Test details panel
When enabled for your organization, the extension shows a **Test Details** panel on GitHub pull request pages for repositories that have [Flaky Tests uploads](../flaky-tests/overview) configured. The panel surfaces test run results without leaving the PR page.
The Test Details panel is available to organizations with Trunk Flaky Tests. Contact [Trunk support](mailto:help@trunk.io) to enable it for your account.
The panel shows:
* **Overall result** — passed, failed, running, or in-progress counts for the PR head commit.
* **Per-status counts** — passed, failed, quarantined, and flaky totals.
* **Commit history** — a dropdown listing recent commits with their test run status, so you can compare a new failure against the previous commit's baseline.
* **Deep links** — counts link directly into the Trunk Flaky Tests dashboard for detailed investigation.
The panel only appears on PR pages where the repository has test uploads in Trunk. Repositories without uploads do not show the panel.
The extension popup also gains a **Tests** tab (alongside **Merge Queues**) when the feature is active. The tab lists repositories that have test uploads and provides a direct link to the Flaky Tests app for each.
## Disabling the extension for a queue
Organization admins can disable the browser extension for a specific merge queue branch from the queue's **Settings** page. Navigate to **Merge Queue**, select the queue, click **Settings**, then find the **Browser Extension** toggle under the **GitHub** section.
When the toggle is off, the extension behaves as though no merge queue is configured for that branch. GitHub's native merge controls reappear in the merge box, and the Trunk overlay does not render. The setting affects only the selected queue; other queues in the same repository are not affected.
Only organization admins can change this setting. Non-admins see the toggle in a disabled state with a tooltip explaining the restriction. The toggle is on by default for all queues.
## Rolling the extension out to an entire org
Chrome admins can install the Trunk extension for everyone in a Google Workspace organization using the [Chrome Web Store ID](https://chromewebstore.google.com/detail/liggeliamkammmieidmmfmmdnjilabgn) `liggeliamkammmieidmmfmmdnjilabgn`. See Google's [Automatically install apps and extensions](https://support.google.com/chrome/a/answer/6306504?hl=en) guide for the admin console steps.
## Authentication and security
The extension does **not** ask you for credentials, API tokens, or a separate password. It authenticates by reusing your existing browser session at [app.trunk.io](https://app.trunk.io/) — the same session you already use for the Trunk web app.
* **Session-based auth.** When you take an action in the extension, the request is sent to the Trunk API with the cookies your browser already holds for `app.trunk.io`. If you aren't signed in, the extension prompts you to sign in once via the normal Trunk login flow; from then on it piggybacks on that session.
* **No new credentials are stored.** The extension does not generate, store, or transmit a long-lived token. Signing out of [app.trunk.io](https://app.trunk.io/) signs the extension out as well.
* **Permissions are unchanged.** The extension can only see queues and act on PRs that your Trunk user already has access to - it cannot escalate permissions. Every action is recorded against your Trunk user, just as it would be from the web app or CLI.
* **Scoped to GitHub PR pages.** The content script runs on `github.com` pull request URLs so it can render the overlay; it does not read or transmit page contents beyond the repository and PR identifiers needed to query the Trunk API.
* **Same transport guarantees as the rest of Trunk.** All extension traffic to Trunk uses TLS, and your data is handled per the [Trunk Security policy](../setup-and-administration/security).
## Frequently asked questions
Yes - the extension is an add-on on top of Trunk Merge Queue. Your repository must have the [Trunk GitHub App installed and a queue configured](./getting-started/) before the overlay does anything useful.
The overlay only appears on pull requests in repositories that your Trunk organization has configured a queue for. If you're signed in and still don't see it, confirm the repository in **Settings** → **Repositories** in the Trunk web app.
The Chrome build also runs on Chromium-based browsers (Edge, Brave, Arc) via the Chrome Web Store, but Chrome and Firefox are the only officially supported browsers.
Yes. Install it from the [Firefox Add-ons listing](https://addons.mozilla.org/en-US/firefox/addon/trunk-for-github/). The Firefox build has full feature parity with Chrome and supports Firefox 140+ on desktop and Firefox 142+ on Android.
Both go through the same Trunk Merge Queue backend. The extension is a faster, in-page surface for the same actions and adds live status without polling the PR comments.
Click the Trunk toolbar icon and open **Settings** in the popup to access the in-popup settings panel. Settings are organized into cards:
| Card | Settings |
| ---------------------- | ----------------------------------------------------------------------------------------------------------------------------------------------------------------------------- |
| **Hide rows** | Three toggles for hiding GitHub rows the Trunk overlay replaces. See [Configuring row hiding](#configuring-row-hiding) above. |
| **Verbose logging** | Enable detailed debug logging; the title shows the current log size. Disabling stops new writes but does not clear buffered logs. Use **Review** or **Clear** to manage them. |
| **Keyboard shortcuts** | Shortcut configuration. |
For **Celebration Mode**, right-click the Trunk toolbar icon and select **Options** (or click the icon and select **Options**) to open the full-page options view.
| Setting | Description | Default |
| --------------- | ----------------------------------------------------------------------------------------- | ------- |
| **Celebration** | When enabled, a confetti burst plays each time you add a pull request to the merge queue. | Off |
The celebration effect respects your operating system's reduced motion preference. If you have **Reduce motion** enabled in your system accessibility settings, no animation plays regardless of this toggle.
# Changelog
Source: https://docs.trunk.io/merge-queue/changelog
Recent updates to Trunk Merge Queue.
## 2026
### July 2026
**[Merge Queue: Stacked pull request support](/changelog/2026-07-31-merge-queue-stacked-pull-requests)**
Trunk Merge Queue now natively supports GitHub stacked pull requests — enqueue any PR in a stack and Trunk tests and merges the whole stack together.
### June 2026
**[Browser Extension: Performance and bug fixes](/changelog/2026-06-29-browser-extension-0-13-0)**
The Trunk browser extension 0.13.0 ships performance improvements and bug fixes.
**[Merge Queue: Queue and Graph Tabs Now Refresh on Return](/changelog/2026-06-18-merge-queue-stale-tab-refresh-fix)**
Switching back to the Queue or Graph tab now shows up-to-date data immediately instead of waiting for the next poll interval.
**[Merge Queue: Inline Queue Metrics Drilldown and Browser Extension Updates](/changelog/2026-06-17-merge-queue-metrics-and-extension-updates)**
Queue Metrics now drills down inline like Testing Metrics, and the browser extension hides the GitHub 'unable to merge as stack' row.
**[Merge Queue: Per-Queue Browser Extension Admin Control](/changelog/2026-06-15-merge-queue-browser-extension-admin-control)**
Org admins can now enable or disable the Trunk browser extension for each merge queue branch directly from the queue's settings page.
**[Merge Queue: Export Health Metrics as CSV](/changelog/2026-06-12-merge-queue-health-metrics-csv-export)**
Download any health chart's data as a CSV file directly from the Merge Queue Health dashboard.
**[Merge Queue: Settings Page Now Has Organized Sections](/changelog/2026-06-12-merge-queue-settings-section-hierarchy)**
Merge Queue settings are reorganized into a sidebar with named sections, each with its own URL for direct linking.
**[Merge Queue: Priority Badge and Impacted Targets Tooltip on PR Details Page](/changelog/2026-06-11-merge-queue-priority-badge-pr-details)**
The PR details page in the Merge Queue dashboard now shows the priority badge and a tooltip when no impacted targets have been uploaded.
**[Merge Queue: Enable or Disable PR State Labels](/changelog/2026-06-10-merge-queue-state-labels-setting)**
A new toggle in Merge Queue Settings lets you enable or disable GitHub labels that Trunk applies to pull requests to reflect their current queue state.
**[Merge Queue: Browser Extension Now Supports Firefox](/changelog/2026-06-08-merge-queue-firefox-extension)**
The Trunk browser extension is now on Firefox Add-ons, with full feature parity with the Chrome build.
**[Merge Queue: Resubmit From the Chrome Extension and Hide Noisy GitHub Rows](/changelog/2026-06-04-merge-queue-chrome-extension-0-8-0)**
The Trunk for GitHub Chrome Extension now shows why a PR left the queue with one-click resubmit, and lets you hide the GitHub merge-box rows it replaces.
### May 2026
**[Merge Queue: Chrome Extension Quality-of-Life Updates](/changelog/2026-05-19-merge-queue-chrome-extension-updates)**
Automatic bot comment hiding, a skip-batching toggle, and Celebration Mode come to the Trunk for GitHub Chrome Extension.
**[Merge Queue: Enqueue Pull Requests by Label](/changelog/2026-05-19-merge-queue-enqueue-by-label)**
Apply a configured GitHub label to a PR to send it straight to the merge queue.
**[Merge Queue: Testing Duration Chart](/changelog/2026-05-13-merge-queue-testing-duration-chart)**
Track how long PRs spend in the testing phase of the merge queue, then drill into individual test runs.
### April 2026
**[Merge Queue: Chrome Extension](/changelog/2026-04-30-merge-queue-chrome-extension)**
The Trunk Chrome Extension brings merge queue controls directly into your GitHub pull request page.
**[Merge Queue: Failure Statuses and Merge Item IDs on Test Runs](/changelog/2026-04-28-merge-queue-failure-statuses-merge-item-ids)**
The testing details API now reports which PRs a merge item is waiting on when tests pass, and the specific failure status when tests fail.
**[Merge Queue: Drill Down Into Merge Metrics](/changelog/2026-04-21-merge-queue-drill-down-into-merge-metrics)**
Merge Queue Health metrics can now be drilled down to the individual pull requests behind any data point.
**[Merge Queue: Terraform Provider](/changelog/2026-04-13-merge-queue-terraform-provider)**
Merge Queue can now be managed fully through Terraform. Previously, creating, updating, and managing a Trunk Merge Queue was a manual process handled through our UI.
### March 2026
**[Merge Queue: Testing Details API Now Includes Impacted Target Information](/changelog/2026-03-26-merge-queue-testing-details-api-now-includes-impacted-target-information)**
The Get Testing Details API now returns impacted target information, giving CI systems everything they need to launch the right tests.
**[Merge Queue: Multiple Queues Per Repo with Grouped Selector](/changelog/2026-03-25-merge-queue-multiple-queues-per-repo-with-grouped-selector)**
Previously, a repo could only have one queue. Now you can create additional queues from the merge queue creation page. The repo selector shows repos that already have queues and how many exist.
**[Merge Queue: Slack App Home Tab](/changelog/2026-03-25-merge-queue-slack-app-home-tab)**
The Trunk Slack App Home tab is now a full control plane for your merge queue activity across all your organizations.
**[Merge Queue: List Pull Requests Public API Endpoint](/changelog/2026-03-19-merge-queue-list-pull-requests-public-api-endpoint)**
A new POST /v1/listPullRequests endpoint lets you query all PRs in your merge queue programmatically. Filter by state (not ready, pending, testing, merged, failed, cancelled), time range, and…
**[Merge Queue: Route Slack Notifications to Multiple Channels](/changelog/2026-03-19-merge-queue-route-slack-notifications-to-multiple-channels)**
Merge queue Slack notifications can now be routed to multiple channels. Previously, notifications went to a single configured channel.
**[Merge Queue: Isolate PRs from Batching with noBatch](/changelog/2026-03-13-merge-queue-isolate-prs-from-batching-with-nobatch)**
PRs can now opt out of batching to test in isolation. When a high-risk PR is in the queue, batching it with other PRs means a failure forces the entire batch to restart.
**[Merge Queue: Prometheus-Compatible Metrics Endpoint](/changelog/2026-03-13-merge-queue-prometheus-compatible-metrics-endpoint)**
Merge Queue now exposes a Prometheus-compatible metrics endpoint for integration with your existing monitoring stack.
**[Merge Queue: Impacted Targets Visible on the Merge Graph](/changelog/2026-03-09-merge-queue-impacted-targets-visible-on-the-merge-graph)**
The merge graph now shows impacted targets directly on nodes and edges, so you can see exactly why PRs are connected and which targets they share.
**[Merge Queue: Custom Merge Commit Titles](/changelog/2026-03-05-merge-queue-custom-merge-commit-titles)**
You can now customize the merge commit title for any PR in the queue. Add merge-commit-title: Your custom title here on its own line anywhere in your PR body, and the merge queue will use that as the…
### February 2026
**[Merge Queue: Public API for Queue Management](/changelog/2026-02-06-merge-queue-public-api-for-queue-management)**
You can now fully manage your merge queues through the Trunk API without touching the web UI.
### January 2026
**[Merge Queue: Personal Slack Notifications](/changelog/2026-01-30-merge-queue-personal-slack-notifications)**
Get direct messages in Slack about your PRs in the merge queue, keeping you informed without adding noise to team channels and allowing you to address failures immediately.
**[Merge Queue: Support Additional Merge Methods](/changelog/2026-01-23-merge-queue-support-additional-merge-methods)**
You can now select your preferred merge method for PRs going through the merge queue. Previously, Trunk Merge only supported squash merging, which combines all commits into a single commit.
**[Merge Queue: Filter Metrics by Impacted Targets](/changelog/2026-01-14-merge-queue-filter-metrics-by-impacted-targets)**
Now you can filter merge queue health metrics by impacted targets to see exactly how well this parallel workflow is performing for each part of your codebase.
**[Merge Queue: Direct Merge to Main](/changelog/2026-01-09-merge-queue-direct-merge-to-main)**
Skip redundant testing and merge immediately when your PR is already up-to-date and the queue is empty
**[Merge Queue: Independent Concurrency for Batch Bisection](/changelog/2026-01-07-merge-queue-independent-concurrency-for-batch-bisection)**
When a batch of PRs fails and needs to be split apart to identify the culprit, you want those bisection tests to run as fast as possible so developers get quick feedback about what broke.
**[Merge Queue: Test Caching for Batch Failure Isolation](/changelog/2026-01-02-merge-queue-test-caching-for-batch-failure-isolation)**
When you use batching mode, the merge queue tests multiple PRs together for efficiency. If a batch fails, the queue needs to figure out which specific PR caused the problem by splitting the batch…
## 2025
### May 2025
**[Merge Queue: Failure tab only displays current failures](/changelog/2025-05-28-merge-queue-failure-tab-only-displays-current-failures)**
We’ve updated the Merge Queue Failure tab so that only PRs that failed and have not been resubmitted to the queue are displayed.
**[Merge Queue: Webhooks on batched PR merges](/changelog/2025-05-08-merge-queue-webhooks-on-batched-pr-merges)**
Webhooks are now available for batched PR merges in Merge Queue. This allows you to build custom automations and respond to events when batching is enabled.
### April 2025
**[Merge Queue: updateQueue API](/changelog/2025-04-17-merge-queue-updatequeue-api)**
We’ve added a new updateQueue API to Trunk Merge Queue that enables you to update a Merge Queue’s state.
### January 2025
**[Merge: Webhook notifications for Microsoft Teams and Slack](/changelog/2025-01-28-merge-webhook-notifications-for-microsoft-teams-and-slack)**
We're excited to share our new webhook integrations for Trunk Merge. You can now send notifications about events in the merge queue to your Microsoft Teams and Slack channels.
## 2024
### July 2024
**[Merge Queue: New metrics dashboard](/changelog/2024-07-17-trunk-merge-queue-metrics-dashboard)**
Merge queues are integral to validating and merging PRs - a critical part of any development process. Minimizing the friction to merge a PR and ensuring the merging process remains fast is essential…
**[Merge Queue: API updates](/changelog/2024-07-10-trunk-merge-queue-public-api-updated)**
Trunk Merge Queue has added more functionality to its public API, allowing it to fit seamlessly into any integration.
### May 2024
**[Merge Queue: Draft PR support](/changelog/2024-05-26-testing-using-draft-prs)**
Trunk Merge Queue, by default, will now raise draft pull requests in order to test changes submitted to the merge queue! Trunk Merge Queue is now even easier to get started with and no longer…
**[Merge Queue: First class Nx support](/changelog/2024-05-17-first-class-support-for-trunk-merge-queue-nx)**
Trunk Merge Queue, through its Parallel Queues feature, can dynamically create new merge queues to test only the pull requests with potential conflicts together.
### April 2024
**[Merge Queue: Batching support](/changelog/2024-04-05-merge-batching-support)**
Trunk Merge Queue now supports grouping PRs into batches for greater throughput. See Batching docs for more details.
**[Merge Queue: Webhook support](/changelog/2024-04-05-merge-web-hook-support)**
Trunk Merge Queue now supports webhooks to provide realtime events to integrated platforms. See the Webhooks API doc for more details.
### March 2024
**[Merge Queue: Optimistic merging and pending failure depth](/changelog/2024-03-29-optimistic-merging-and-pending-failure-depth)**
Merge Queue now supports Optimistic Merging to allow failed tests to be merged if later PRs pass. Merge Queue also now supports Pending Failure Depth to allow failed tests to remain in the queue for…
**[Merge Queue: PR prioritization](/changelog/2024-03-15-trunk-merge-pr-prioritization)**
Support for setting the priority of a pull request from the command line or a GitHub comment. Higher priority PRs will move ahead of lower priority PRs. See PR Prioritization docs for more details.
### February 2024
**[Merge Queue : Support for forked and open source repos](/changelog/2024-02-20-merge-support-for-forked-and-open-source-repos)**
Trunk Merge Queue now supports uploading impacted targets from forked PRs, and has more verbose information on PRs for contributors that aren't a part of the same Trunk org.
### January 2024
**[Merge Queue: Automatic status checks](/changelog/2024-01-12-merge-automatic-status-checks)**
Trunk Merge Queue now supports automatically setting the required status checks by scanning the GitHub branch protection of the target branch. See Define Required Status For Testing for details.
## 2023
### November 2023
**[Trunk Merge Queue - Parallel Queues](/changelog/2023-11-21-trunk-merge-parallel-queues)**
Trunk Merge Queue now offers two modes for creating merge queues: "Single" and "Parallel". The Single mode operates as a standard first-in, first-out merge queue, where pull requests (PRs) are added…
# Configure branch protection
Source: https://docs.trunk.io/merge-queue/getting-started/configure-branch-protection
Set up GitHub branch protection so Trunk Merge Queue can admit, test, and merge pull requests through your protected branch.
## Prerequisites
Before configuring branch protection:
* Trunk GitHub App installed and queue created (previous step)
* Repository has CI/CD configured (GitHub Actions, CircleCI, etc.)
* CI runs on pull requests and reports status checks to GitHub
* You have admin access to repository settings
## How Branch Protection Affects the Queue
Trunk Merge Queue respects GitHub's branch protection rules and works with both Classic branch protection rules and Rulesets. Branch protection plays two distinct roles in how the queue operates:
* **Admission into the queue** — Trunk doesn't admit a submitted PR for testing until GitHub considers it ready to merge. Branch protection (required reviews, required status checks, conversation resolution, etc.) is what determines when GitHub marks a PR as ready to merge, so it directly controls when a PR enters the queue.
* **Required checks during testing (optional)** — By default, Trunk waits on the same required status checks defined in your branch protection rules while testing a PR in the queue. You can override this with the Trunk UI or `.trunk/trunk.yaml` if you want a different set of checks required during queue testing. See [Required Status Checks](../administration/advanced-settings#required-status-checks).
The configurations on this page (push restrictions for the `trunk-io` bot, and excluding `trunk-temp/**/*` and `trunk-merge/**/*` from protection) ensure branch protection doesn't *block* Trunk from doing its job. They don't change either of the roles above.
## Choose your testing approach
Trunk Merge Queue can test pull requests in two ways. Choose the approach that fits your CI setup:
### Draft PR mode (Recommended - Default)
**Best for:** Most teams who want the simplest setup with no additional
configuration.
When a pull request enters the queue, Trunk creates a draft pull request to test the changes. This automatically triggers your existing pull request-based CI workflows, the same checks that run when you open a regular pull request.
**Advantages:**
* No additional CI configuration required
* Works immediately with your existing workflows
* Simple to set up and maintain
Things to look out for:
* This mode also creates a `trunk-merge/` branch
* Trunk automatically closes the draft PRs and merge the original PRs
**When to use a different approach:** If you have expensive preview deployments, review-only workflows, or security scans that you don't want running during merge queue testing, consider Push-triggered mode instead.
### Push-Triggered mode (Advanced)
**Best for:** Teams who need different CI behavior for merge queue testing
versus pull request review.
When a pull request enters the queue, Trunk creates a branch under `trunk-merge/` and pushes to it. You configure specific CI jobs to run on these branches.
**Advantages:**
* Complete control over which jobs run during queue testing
* Avoid triggering expensive preview environments or review-only workflows
* Can optimize for faster merge queue throughput
**Requirements:**
* Configure push-triggered workflows in your CI provider for `trunk-merge/**` branches (see [Configure CI status checks](./configure-ci-status-checks#if-using-push-triggered-mode))
**To enable:** Navigate to **Merge Queue** → **\[repository]** → **Settings** → toggle **Draft PR Creation** off.
## Configure Branch Protection Rules
### Rulesets vs. Classic branch protection
GitHub offers two systems for branch protection: [Rulesets](https://docs.github.com/en/repositories/configuring-branches-and-merges-in-your-repository/managing-rulesets/about-rulesets) and Classic branch protection rules. Both can coexist on the same branch.
The Trunk Merge Queue GitHub App is fully supported on both systems. **Rulesets are recommended** for two reasons:
* **Rulesets allow more granular protections.** You can layer multiple targeted rulesets on the same branch with per-actor bypass control — finer-grained than what Classic rules can express.
* **Repository admins can be held to the rule.** With Classic branch protection, admins bypass by default and see a green **Merge** button on every PR — easy to misclick into a merge that skips the queue. Rulesets flip the default: admins are subject to the rule unless they're explicitly on the bypass list, and even when they are, GitHub displays a red warning that they're circumventing branch protection — much harder to misclick through than a green button.
### Option A — GitHub Rulesets (recommended)
Trunk Merge Queue requires **at least two rulesets** on your protected branch:
* **Ruleset #1** restricts who can update the branch and lists Trunk on its bypass list as **Exempt** so Trunk can push merges through the queue.
* **Ruleset #2** holds your mergeability requirements (required reviews, required status checks, conversation resolution, etc.) and does **not** bypass Trunk. The queue uses these rules to decide when GitHub considers a PR ready, which is what gates [admission into the queue](#how-branch-protection-affects-the-queue).
Splitting them keeps Trunk's bypass scope minimal: GitHub bypass permissions apply to the whole ruleset, so a single combined ruleset would force Trunk to bypass review and status checks too — the opposite of what you want.
**Ruleset #1 — Branch update (Trunk bypasses this).** This ruleset lets the Trunk GitHub App update your protected branch when merging from the queue, while still preventing direct pushes from anyone else.
1. In GitHub, navigate to **Settings** → **Rules** → **Rulesets** and create a new ruleset (e.g., name it `main - force push`).
2. Under **Target branches**, target the protected branch only (e.g., `main`). No exclude pattern is needed *for this ruleset* — Trunk's `trunk-temp/**/*` and `trunk-merge/**/*` branches are not in the include list, so they aren't matched. Other rulesets (especially at the organization level) may still need explicit excludes; see [Exempt Trunk's temporary branches from other rulesets](#exempt-trunk-temporary-branches) below.
3. Under **Rules** → **Branch rules**, enable **Restrict updates** ("Only allow users with bypass permission to update matching refs"). You can optionally co-locate **Restrict deletions** and **Restrict creations** in the same ruleset; the bypass list applies to the entire ruleset.
4. Under **Bypass list**, add the Trunk GitHub App (`trunk-io`) and set its bypass mode to **Exempt**.
5. If you also use [Trunk Sudo](../../setup-and-administration/trunk-sudo-app), add **Trunk Sudo** to the bypass list as **Exempt** as well.
6. Save.
![GitHub ruleset with Restrict updates and Restrict deletions enabled,
Trunk.io and Trunk Sudo on the bypass list as
Exempt]()
**Bypass mode defaults to Always — change it to Exempt.** When you add an
actor to a ruleset's bypass list, GitHub defaults its bypass mode to
**Always**, which sounds permissive but does not cover branch updates from a
GitHub App. Trunk must be set to **Exempt**. If Trunk isn't Exempt, merges
will fail with permission errors on the protected branch.
**Ruleset #2 — Mergeability requirements (Trunk does NOT bypass this).** This ruleset encodes the rules that determine when a PR is ready to merge. Trunk reads these to decide when to admit a PR into the queue.
1. Create a second ruleset (e.g., name it `main - PRs`).
2. Target the same protected branch (e.g., `main`) with the same single-include targeting.
3. Under **Rules** → **Branch rules**, add the rules that gate mergeability — typically **Require a pull request before merging** and **Require status checks to pass**. Add others (signed commits, linear history, etc.) as your team requires.
4. **Do not** add the Trunk GitHub App (`trunk-io`) to the bypass list. The queue relies on GitHub reporting the PR as not-yet-ready until these rules pass.
5. Optionally, add **Trunk Sudo** to the bypass list as **Exempt** if you use [Direct to queue](../using-the-queue/direct-to-queue). See the [Trunk Sudo page](../../setup-and-administration/trunk-sudo-app) for the full guidance.
6. Save.
![GitHub ruleset with Require a pull request before merging and Require status
checks to pass enabled, Trunk.io not on the bypass
list]() See [Required Status Checks](../administration/advanced-settings#required-status-checks) for how the queue uses required status checks while testing PRs already in the queue.
**Exempt Trunk's temporary branches from other rulesets.** The two rulesets above target only your protected branch, so they don't match `trunk-temp/**/*` or `trunk-merge/**/*`. But any **other** Branch ruleset — at the **organization** level or elsewhere on this repository — whose targeting is broader (e.g., **All branches**, or a wildcard include like `**/*`) will match Trunk's temporary branches and block the queue.
See [Required Status Checks](../administration/advanced-settings#required-status-checks) for how the queue uses required status checks while testing PRs already in the queue.
**Exempt Trunk's temporary branches from other rulesets.** The two rulesets above target only your protected branch, so they don't match `trunk-temp/**/*` or `trunk-merge/**/*`. But any **other** Branch ruleset — at the **organization** level or elsewhere on this repository — whose targeting is broader (e.g., **All branches**, or a wildcard include like `**/*`) will match Trunk's temporary branches and block the queue.
**Symptom:** A PR enters the queue and then fails out shortly after testing
starts with a GitHub permission error (e.g., "Permission denied on
trunk-merge/\* branch"). You'll see this on the **Trunk Merge Queue** status
check on the PR, in Trunk's status comment on the PR, and on the PR's detail
page in the [Trunk dashboard](https://app.trunk.io/). This almost always means
a Branch ruleset is preventing Trunk from creating, pushing to, or deleting
`trunk-temp/**/*` or `trunk-merge/**/*`.
**Branch rulesets vs. Push rulesets.** Only **Branch** rulesets need this exemption. Branch vs. Push is a GitHub ruleset type and is unrelated to the [Push-Triggered testing mode](#push-triggered-mode-advanced) above. Push rulesets gate the *content* of pushes (file size limits, secret scanning, restricted file paths, etc.) rather than the branch operations the queue performs, so they can target Trunk's temporary branches without breaking the queue. To tell them apart, open a ruleset's edit page: Branch rulesets have a **Branch targeting criteria** section, while Push rulesets have **Push rules** and target repositories rather than branches. Audit only the Branch rulesets.
**Where to look:**
1. **Organization-level rulesets** — at the organization's **Settings** → **Rules** → **Rulesets** page. These apply across every repository and are the most commonly missed source of conflicts.
2. **Other repository-level Branch rulesets** — any Branch ruleset on this repo other than the two created above.
**How to exempt Trunk's branches:**
For each Branch ruleset whose **Branch targeting criteria** could match `trunk-temp/**/*` or `trunk-merge/**/*` (anything broader than a single protected-branch include):
1. Edit the ruleset.
2. Under **Branch targeting criteria**, click **Add target** → **Exclude by pattern** and add both:
* `trunk-temp/**/*`
* `trunk-merge/**/*`
The trailing `/*` is required. GitHub treats `trunk-temp/**` and
`trunk-temp/**/*` differently, and only the latter actually matches (and
therefore excludes) the branches Trunk creates.
3. Save.
![GitHub Branch targeting criteria with All branches included and trunk-temp/**/* and trunk-merge/**/* listed as exclude patterns]() **Verify your ruleset configuration.** Before submitting your first PR to the queue, confirm:
* Ruleset #1 targets only your protected branch and has the Trunk GitHub App on the bypass list as **Exempt**.
* Ruleset #2 targets only your protected branch and does **not** bypass Trunk.
* Every other Branch ruleset visible at the organization level and on this repository either does not match `trunk-temp/**/*`/`trunk-merge/**/*`, or explicitly excludes both patterns.
* (If using [Trunk Sudo](../../setup-and-administration/trunk-sudo-app)) Trunk Sudo is on Ruleset #1's bypass list as **Exempt**.
* (If using [Trunk Sudo](../../setup-and-administration/trunk-sudo-app) **and** Direct to queue) Trunk Sudo is also on Ruleset #2's bypass list as **Exempt**.
### Migrating from Classic rules to Rulesets
If you already use Classic branch protection, GitHub provides an **Import a ruleset** action on the [Rulesets](https://docs.github.com/en/repositories/configuring-branches-and-merges-in-your-repository/managing-rulesets/about-rulesets) page that converts an existing Classic rule into a single ruleset. Use it as a starting point, then split the imported ruleset into the two-ruleset structure above: move **Restrict updates** into Ruleset #1 with Trunk on the bypass list as Exempt, and leave the rest in Ruleset #2 with no bypass on Trunk.
**Verify your ruleset configuration.** Before submitting your first PR to the queue, confirm:
* Ruleset #1 targets only your protected branch and has the Trunk GitHub App on the bypass list as **Exempt**.
* Ruleset #2 targets only your protected branch and does **not** bypass Trunk.
* Every other Branch ruleset visible at the organization level and on this repository either does not match `trunk-temp/**/*`/`trunk-merge/**/*`, or explicitly excludes both patterns.
* (If using [Trunk Sudo](../../setup-and-administration/trunk-sudo-app)) Trunk Sudo is on Ruleset #1's bypass list as **Exempt**.
* (If using [Trunk Sudo](../../setup-and-administration/trunk-sudo-app) **and** Direct to queue) Trunk Sudo is also on Ruleset #2's bypass list as **Exempt**.
### Migrating from Classic rules to Rulesets
If you already use Classic branch protection, GitHub provides an **Import a ruleset** action on the [Rulesets](https://docs.github.com/en/repositories/configuring-branches-and-merges-in-your-repository/managing-rulesets/about-rulesets) page that converts an existing Classic rule into a single ruleset. Use it as a starting point, then split the imported ruleset into the two-ruleset structure above: move **Restrict updates** into Ruleset #1 with Trunk on the bypass list as Exempt, and leave the rest in Ruleset #2 with no bypass on Trunk.
Don't delete the original Classic rule until both rulesets are saved and
verified — otherwise the branch will be temporarily unprotected.
### Option B — Classic branch protection
Classic branch protection still works with Trunk Merge Queue, but is no longer the recommended path. Some Classic rules (required status checks and "Require branches to be up to date") cannot be bypassed by any GitHub App, which limits features like [Direct to queue](../using-the-queue/direct-to-queue). Use Rulesets when you can.
**Configure push restrictions (required)**
Trunk Merge Queue needs permission to push to your protected branch. Configure these settings using Classic branch protection rules:
![]() 1. Navigate to **Settings** → **Branches** in your repository on GitHub.
2. Edit or create a Classic branch protection rule for your target branch (e.g., `main`).
3. Under "Rules applied to everyone including administrators," select:
* **Restrict who can push to matching branches**
* **Restrict pushes that create matching branches**
4. Add the `trunk-io` bot to the list of allowed actors.
5. Optionally, add Organization admins and repository admins who need emergency merge access.
6. Save your changes.
1. Navigate to **Settings** → **Branches** in your repository on GitHub.
2. Edit or create a Classic branch protection rule for your target branch (e.g., `main`).
3. Under "Rules applied to everyone including administrators," select:
* **Restrict who can push to matching branches**
* **Restrict pushes that create matching branches**
4. Add the `trunk-io` bot to the list of allowed actors.
5. Optionally, add Organization admins and repository admins who need emergency merge access.
6. Save your changes.
**Important:** Regular users should use [pull request
prioritization](../optimizations/priority-merging) with `--priority=urgent` or
`--priority=high` to fast-track pull requests through the queue while
maintaining validation. Direct push access is only needed for rare emergencies
where the queue itself must be bypassed.
**Exclude Trunk's temporary branches (critical)**
Trunk Merge Queue creates temporary branches to test pull requests before merging them:
* `trunk-temp/**/*` — temporary testing branches
* `trunk-merge/**/*` — merge testing branches
**Trunk needs unrestricted access** to create, push to, and delete these
branches. If your branch protection rules apply to these branches, Merge Queue
cannot function.
To verify and fix:
1. Navigate to **Settings** → **Branches** in your repository.
2. Review all Classic branch protection rules.
3. Check for wildcard patterns like `*/*`, `**/*`, or similar that would match `trunk-temp/**/*` or `trunk-merge/**/*`.
4. If you find matching rules, either:
* Remove the wildcard rules and create more specific rules for your actual branches, or
* Add the `trunk-io` bot to the bypass list for those rules.
**Example of a problematic rule:** a branch protection rule with pattern `*/*` would protect all branches including `trunk-temp/**/*` and `trunk-merge/**/*`.
**What happens if these branches are protected:** Merge Queue encounters GitHub permission errors and displays messages like "Permission denied on trunk-merge/\* branch."
**Also check rulesets, even if you only use Classic protection.**
Organization-level Branch rulesets and other repository-level Branch rulesets
apply on top of Classic rules and can match
`trunk-temp/**/*`/`trunk-merge/**/*` independently. See [Exempt Trunk's
temporary branches from other rulesets](#exempt-trunk-temporary-branches) for
how to audit and fix them.
**Using Direct to queue or other bypass-dependent features?** Features like [Force
merge](../using-the-queue/direct-to-queue) require the separate [Trunk Sudo GitHub
App](../../setup-and-administration/trunk-sudo-app), plus additional branch
protection configuration to list Trunk Sudo as a bypass actor. That's
documented on the Trunk Sudo page.
**Verify your Classic configuration.** Before submitting your first PR to the queue, confirm:
* The `trunk-io` GitHub App is in the list of allowed actors for push restrictions on your protected branch.
* No Classic branch protection rule on this repository uses a wildcard pattern that matches `trunk-temp/**/*` or `trunk-merge/**/*` (i.e, **/**/\*)— or, if one does, the `trunk-io` bot is on its bypass list.
* Every Branch ruleset visible at the organization level and on this repository either does not match `trunk-temp/**/*`/`trunk-merge/**/*`, or explicitly excludes both patterns. (Push rulesets do not need this exemption — see [Exempt Trunk's temporary branches from other rulesets](#exempt-trunk-temporary-branches).)
* (If using [Trunk Sudo](/setup-and-administration/trunk-sudo-app)) Trunk Sudo is configured per the Trunk Sudo page.
## Next Steps
→ [**Configure CI status checks**](./configure-ci-status-checks) **-** Configure CI status checks for your branch.
*Having trouble?* See our [Troubleshooting guide](../reference/troubleshooting) for common installation issues.
# Configure CI status checks
Source: https://docs.trunk.io/merge-queue/getting-started/configure-ci-status-checks
Make sure your CI runs whenever Trunk Merge Queue tests a pull request.
This page covers how to make sure your CI checks run on the branches Trunk Merge Queue creates while testing a pull request. What you need to do depends on the testing mode you selected in [Configure branch protection](./configure-branch-protection):
* **Draft PR mode (default)** — no additional CI configuration is required.
* **Push-Triggered mode** — you need to add a CI workflow that triggers on pushes to `trunk-merge/**`.
## Prerequisites
* Completed [Install the GitHub App and create a queue](./install-and-create-your-queue) and [Configure branch protection](./configure-branch-protection)
* The testing mode chosen during branch protection setup (Draft PR or Push-Triggered) — you need to know which path applies
* Write access to your CI provider's workflow configuration (e.g., `.github/workflows/` for GitHub Actions)
### If using Draft PR mode (default)
Your existing pull request-triggered CI workflows will automatically run when Trunk creates draft pull requests to test changes. **No additional configuration is required.**
See GitHub's documentation for configuring required status checks on your protected branch:
* [Classic branch protection rules](https://docs.github.com/en/repositories/configuring-branches-and-merges-in-your-repository/managing-protected-branches/about-protected-branches#require-status-checks-before-merging)
* [Rulesets](https://docs.github.com/en/repositories/configuring-branches-and-merges-in-your-repository/managing-rulesets/about-rulesets)
**You're done!** Skip to the [Verification](./test-your-setup) section.
### If using Push-Triggered mode
Set up your CI provider to run status checks whenever Trunk pushes to `trunk-merge/**` branches.
**Example for GitHub Actions:**
```yaml theme={null}
name: Merge Queue Tests
run-name: Merge Queue Checks for ${{ github.ref_name }}
# Trigger when Trunk Merge Queue tests a pull request
on:
push:
branches:
- trunk-merge/**
jobs:
unit_tests:
runs-on: ubuntu-latest
name: Unit Tests
steps:
- name: Checkout
uses: actions/checkout@v3
- name: Run tests
run: npm test # Your actual test commands
integration_tests:
runs-on: ubuntu-latest
name: Integration Tests
steps:
- name: Checkout
uses: actions/checkout@v3
- name: Run integration tests
run: npm run test:integration # Your actual test commands
```
**For other CI providers:** Configure workflows triggered by pushes to branches matching `trunk-merge/**`.
### Required Checks During Queue Testing
By default, Merge Queue waits on the same required status checks defined in your GitHub branch protection rules while testing a PR. If you want a different set of checks required during queue testing — for example, because you don't use GitHub branch protection, or because the queue should require different checks than PR review — you can override that in the Trunk UI or in `.trunk/trunk.yaml` (`merge.required_statuses`). Both overrides work in either testing mode.
**These checks are what Merge Queue waits on while a PR is already in the queue and testing. They do not control which PRs are admitted into the queue.**
PR admission is governed separately: Trunk waits until GitHub considers the PR ready to merge (driven by your [branch protection rules](./configure-branch-protection#how-branch-protection-affects-the-queue)) before testing begins. If your queue is running in [parallel mode](../optimizations/parallel-queues/index), Trunk additionally waits for the [impacted targets](../optimizations/parallel-queues/index#what-are-impacted-targets) of that PR to be uploaded.
See [Required Status Checks](../administration/advanced-settings#required-status-checks) for the full set of options.
### Next Steps
→ [**Test your setup**](./test-your-setup) - Verify everything is configured correctly before using Merge Queue in production.
*Having trouble?* See our [Troubleshooting guide](../reference/troubleshooting) for common installation issues.
# Getting Started
Source: https://docs.trunk.io/merge-queue/getting-started/index
Set up Trunk Merge Queue for your repository by installing the GitHub App, creating a queue, and configuring branch protection.
This guide walks you through setting up Trunk Merge Queue for your repository. The setup process involves installing the GitHub App, creating a queue, and configuring branch protection rules to allow the merge queue to function properly.
## Prerequisites
* A [Trunk account and organization](../../setup-and-administration/connecting-to-trunk)
* **GitHub admin** on the target repository (required to install the GitHub App and edit branch protection)
* The repository's default branch identified, plus the ability to modify its branch protection rules or rulesets
### Step 1: Install the GitHub App and create a Queue
**The Trunk GitHub App is required for Merge Queue to function.** It grants Trunk Merge Queue the necessary permissions to create test branches, read CI results, and merge PRs in your repository. View [detailed permissions and what Trunk uses them for](../../setup-and-administration/github-app-permissions).
The Trunk GitHub app can be added and removed from repositories within your org as needed.
1. [Sign in to app.trunk.io](https://app.trunk.io/login) and navigate to the **Merge Queue** tab. (First-time users will [create an organization](../../setup-and-administration/connecting-to-trunk) before accessing Merge Queue.)
2. Click the **Create New Queue** button.
If the GitHub App is already installed, step 3 will be skipped automatically.
3. If the Trunk GitHub App is not already installed, you'll be prompted to install it.
**You must be a GitHub admin to complete the following steps.** If you are not a GitHub admin in your organization, navigate to **Settings** → **Organization** → **Team** to invite a GitHub admin to your Trunk organization so they can complete the following.
The GitHub App installation must be initiated from the Trunk web app to properly associate your Trunk organization with the GitHub App. If you have previously installed the Trunk GitHub App directly through GitHub, you'll need to uninstall it first and then reinstall it by starting the installation process from the Trunk web app as described below.
* Click **Install GitHub App** and follow the installation flow:
* Select whether to install on all repositories or only specific ones
* Review and approve the required permissions
* Complete the installation
* After the GitHub App installation is complete, you'll be returned to the Trunk dashboard.
* In the Merge Queue tab click the "New Queue" button.
4. Select a repository from the dropdown and enter the target branch to merge into. Click **Create Queue.**
![]() ### Step 2: Configure Branch Protection
The merge queue needs specific GitHub permissions to function. Follow the [Branch Protection & Required Status Checks](./configure-branch-protection) guide to:
1. **Configure push restrictions** - Allow the `trunk-io` bot to push to your protected branch
2. **Disable “Require branches to be up to date before merging.” -** This setting is one of the most common sources of confusion. Many teams enable it to keep their branch green, but it conflicts with how merge queues work. If this is on, PRs will often sit in the “Queued” state forever because GitHub blocks Trunk from updating them.
3. **Exclude Trunk's temporary branches** - Make sure `trunk-temp/**/*` and `trunk-merge/**/*` branches are not protected by any rulesets. They are created and cleaned up automatically by the queue.
### Step 2: Configure Branch Protection
The merge queue needs specific GitHub permissions to function. Follow the [Branch Protection & Required Status Checks](./configure-branch-protection) guide to:
1. **Configure push restrictions** - Allow the `trunk-io` bot to push to your protected branch
2. **Disable “Require branches to be up to date before merging.” -** This setting is one of the most common sources of confusion. Many teams enable it to keep their branch green, but it conflicts with how merge queues work. If this is on, PRs will often sit in the “Queued” state forever because GitHub blocks Trunk from updating them.
3. **Exclude Trunk's temporary branches** - Make sure `trunk-temp/**/*` and `trunk-merge/**/*` branches are not protected by any rulesets. They are created and cleaned up automatically by the queue.
**Without proper branch protection configuration, the merge queue will not
work.** You may see errors like "Permission denied on `trunk-merge/**/*`
branch" or PRs will remain stuck in "Queued" state.
**Optional: enforce Merge Queue-only merges.** If you want your organization to merge *exclusively* through the merge queue:
* Restrict who can push to your protected branch (e.g., main).
* Then allow the Trunk GitHub App as the only actor permitted to push to that branch.
This setup makes sure all merges flow through the queue and prevents developers from bypassing it accidentally.
### Step 3: Test your setup
Now that branch protection is configured, test that the merge queue works correctly:
1. Create a test pull request in your repository
2. Submit it to the merge queue using one of these methods:
* **Checking the box** in the Trunk bot comment on your PR, or
* **Commenting** `/trunk merge` on the pull request
![]()
You can submit a PR to the merge queue at any time, even before CI checks pass
or code review is complete. The PR will remain in "**Queued**" state until all
required conditions are met, then automatically begin testing.
3. You can check the PR in the [Trunk Dashboard](https://app.trunk.io/) - once your PR passes all required checks, it will move from 'Queued' to 'Testing'. The merge queue will then test it again with changes ahead of it in the queue. When those tests pass, it will automatically merge.
**Troubleshooting common issues.**
Visit [Trunk Support](../../setup-and-administration/support) for additional
assistance or to contact the support team.
If your test PR doesn't merge automatically:
* **Check the status comments for the PR in** the [Trunk Dashboard](https://app.trunk.io/) to see what it's waiting for
* **Stuck in "Queued"**: Usually means branch protection rules haven't passed (missing required status checks or code review) or there are merge conflicts. If the status looks correct but the PR still won't enter the queue, try [removing](../using-the-queue/reference#submitting-and-cancelling-pull-requests) and re-adding by commenting `/trunk merge` again on the PR.
* **Fails when attempting to merge**: Check that the [merge method](/merge-queue/administration/advanced-settings#merge-method) your queue is configured to use (squash by default) is enabled for your repository in GitHub settings (`Settings > General`).
* **"Permission denied" errors**: Review the [Branch Protection](./configure-branch-protection) guide to make sure `trunk-temp/*` and `trunk-merge/*` branches aren't protected by wildcard rules like `*/*`.
* **Status checks not running**: Verify your CI is configured to run on draft PRs (or `trunk-merge/**` branches if using push-triggered mode). See the [Branch Protection](./configure-branch-protection) guide for details.
### Step 4: Configure advanced features
Once the basic merge queue is working, you can enable optimizations to improve performance, such as [batching](../optimizations/batching) PRs together or [allowing failed pull requests to merge](../using-the-queue/handle-failed-pull-requests) if others are passing.
# Install and create your queue
Source: https://docs.trunk.io/merge-queue/getting-started/install-and-create-your-queue
Install the Trunk GitHub App, connect your repository, and create your first merge queue.
This guide walks you through setting up Trunk Merge Queue for your repository. The setup process involves installing the GitHub App, creating a queue, and configuring branch protection rules to allow the merge queue to function properly.
## Prerequisites
Before you begin, make sure you have:
* Admin access to your GitHub organization
* A repository you want to protect with Merge Queue
**You must be a GitHub admin to complete the following steps.** If you are not a GitHub admin in your organization, navigate to **Settings** → **Organization** → **Team** to invite a GitHub admin to your Trunk organization so they can complete the following.
The GitHub App installation must be initiated from the Trunk web app to properly associate your Trunk organization with the GitHub App. If you have previously installed the Trunk GitHub App directly through GitHub, you'll need to uninstall it first and then reinstall it by starting the installation process from the Trunk web app as described below.
## Install the Trunk GitHub App
1. [Sign in to app.trunk.io](https://app.trunk.io/login) and navigate to the **Merge Queue** tab. (First-time users will [create an organization](../../setup-and-administration/connecting-to-trunk) before accessing Merge Queue.)
2. Click the **Create New Queue** button at the top right corner of the window.
**The Trunk GitHub App is required for Merge Queue to function.** It grants Trunk Merge Queue the necessary permissions to create test branches, read CI results, and merge PRs in your repository. View [detailed permissions and what Trunk uses them for](../../setup-and-administration/github-app-permissions).
If the GitHub App is already installed, step 3 will be skipped automatically.
3. If the Trunk GitHub App is not already installed, you'll be prompted to install it.
1. Click **Install GitHub App** and follow the installation flow:
1. Select whether to install on all repositories or only specific ones
2. Review and approve the required permissions
3. Complete the installation
4. After the GitHub App installation is complete, you'll be returned to the Trunk dashboard.
## Create your first queue
**Only Trunk organization admins can create a merge queue.** The **New Queue** button is visible only to admins. Non-admins who navigate to the create page see the **Create Queue** button in a disabled state with a tooltip: "Only organization admins can create a merge queue." To grant admin access, visit `Settings > Team Members` in the Trunk web app.
4. In the **Merge Queue** tab, click the **New Queue** button at the top right corner of the window.
5. Select a repository from the dropdown and enter the target branch to merge into. Click **Create Queue.**
![]() ## What you just did
You've installed the Trunk GitHub App on your organization and created your first merge queue for the specified branch (`main` in the example above). Trunk is now connected to your repository and ready to be configured. Your queue won't start processing pull requests until you complete the branch protection setup in the next step.
## What you just did
You've installed the Trunk GitHub App on your organization and created your first merge queue for the specified branch (`main` in the example above). Trunk is now connected to your repository and ready to be configured. Your queue won't start processing pull requests until you complete the branch protection setup in the next step.
**Need multiple queues?** You can create additional queues for the same repository targeting different branches (e.g., `staging`, `release/v2`). Each queue operates independently with its own settings. See [Multiple queues per repository](../administration/advanced-settings#multiple-queues-per-repository) for details.
## Next steps
→ [**Configure branch protection**](./configure-branch-protection) - Set up GitHub rules so Trunk can safely manage your merges
*Having trouble?* See our [Troubleshooting guide](../reference/troubleshooting) for common installation issues.
# Test your setup
Source: https://docs.trunk.io/merge-queue/getting-started/test-your-setup
Verify your Trunk Merge Queue installation by submitting a test PR and confirming it merges automatically.
## Prerequisites
After completing configuration, verify your setup:
* `trunk-io` bot is added to push restrictions for your protected branch
* No branch protection rules apply to `trunk-temp/*` or `trunk-merge/*` branches
* If using Draft PR mode: Required status checks are configured in GitHub branch protection
* If using Push-triggered mode:
* CI workflows trigger on `trunk-merge/**` branches
* `merge.required_statuses` is defined in `trunk.yaml`
### **Test your configuration**
1. Create a test pull request
2. Comment `/trunk merge` on the pull request
3. Check the [Trunk Dashboard](https://app.trunk.io/) to monitor your pull request status
4. The pull request should appear in the queue as "Queued" until all checks complete
5. Click on the pull request in the dashboard to see detailed status of what it's waiting for
6. You'll also see status updates in the comments on your pull request
**Expected behavior:** Your pull request should progress through testing and merge automatically once all required checks pass.
## Next Steps
**Congratulations!** Your Merge Queue is working. You're ready to use it with your team.
### Start using Merge Queue
→ [**Submit and cancel pull requests**](../using-the-queue/reference) - Learn how to use the queue day-to-day
### Optimize your queue
Ready to make it even better? Explore these optimizations
→ [**Predictive Testing**](../optimizations/predictive-testing) - Prevent queue collapse and increase throughput
→ [**Batching**](../optimizations/batching) - Merge multiple PRs together for faster processing
→ [**Priority merging**](../optimizations/priority-merging) - Fast-track urgent PRs
→ [**Anti-flake protection**](../optimizations/anti-flake-protection) - Handle flaky tests automatically
### Configure integrations
→ [**Integration for Slack**](../integration-for-slack) - Get notifications in Slack
→ [**Metrics and monitoring**](../administration/metrics) - Track your queue's performance
*Having trouble?* See our [Troubleshooting guide](../reference/troubleshooting) for common installation issues.
# Integration for Slack
Source: https://docs.trunk.io/merge-queue/integration-for-slack
Send merge queue updates to multiple Slack channels and receive personal DM notifications — all powered by the Trunk Slack app.
Trunk Merge Queue integrates with Slack to send real-time notifications about queue activity and pull request state changes. You can route notifications to **multiple Slack channels** per repository, each with its own set of enabled topics, and receive **personal DMs** about your own PRs directly in Slack.
For details on how Trunk collects, manages, and stores your data, see our [Security and Privacy](../setup-and-administration/security) page.
![]() ## Installing the Trunk Slack App
Before you can set up channel notifications or personal DMs, a Slack workspace admin must install the Trunk Slack app for your organization. This is a one-time setup that enables all Slack integration features.
### Steps to Install
1. In the Trunk web app, navigate to **Settings** → **Organization** → **Slack**.
2. Click **Add to Slack**.
3. Review and approve the requested permissions on the Slack OAuth screen.
4. You'll be redirected back to Trunk. The page will show your workspace as **Connected** along with the workspace name.
## Installing the Trunk Slack App
Before you can set up channel notifications or personal DMs, a Slack workspace admin must install the Trunk Slack app for your organization. This is a one-time setup that enables all Slack integration features.
### Steps to Install
1. In the Trunk web app, navigate to **Settings** → **Organization** → **Slack**.
2. Click **Add to Slack**.
3. Review and approve the requested permissions on the Slack OAuth screen.
4. You'll be redirected back to Trunk. The page will show your workspace as **Connected** along with the workspace name.
![]()
![]()
![]() ### Managing the Connection
Once connected, you can **Reconnect** (to reauthorize) or **Disconnect** the workspace from the same settings page.
### Managing the Connection
Once connected, you can **Reconnect** (to reauthorize) or **Disconnect** the workspace from the same settings page.
**Migrating from legacy Slack integration?** If your organization previously connected Slack through the per-repo "Connect with Slack" flow, you still need to complete this new workspace-level installation to access multi-channel notifications and the new personal DM features. After installing, you can set up channel connections and personal notifications using the new workflows described below.
## Channel Notifications
Send merge queue updates to one or more shared Slack channels to keep your team informed about queue activity. Each channel can have its own set of enabled notification topics.
### Connecting Slack Channels
**Prerequisite:** The Trunk Slack app must be [installed for your organization](./integration-for-slack#installing-the-trunk-slack-app) before you can connect channels.
1. Navigate to **Merge Queue** → **\[your repository]** → **Settings**.
2. Under **Slack Notifications**, click **Add Channel**.
3. In the **Add Slack Channel** modal, paste your Slack channel link. To get the link: right-click the channel name in Slack and select **Copy link**. Trunk looks up the channel and displays its name when found.
4. Toggle the notification topics you want enabled for that channel.
5. Click **Connect**.
You can connect **multiple channels**, each with a different set of enabled topics. For example, you might send all notifications to a `#merge-notifications` channel while only sending failure alerts to a `#merge-queue-failures` channel.
![]() The channel list displays each connected channel along with a summary of how many notification topics are enabled (e.g., "6/9 enabled"). To remove an individual channel, click the trash icon next to it. To remove all channel connections for the repository, click **Disconnect**.
### Managing Channel Notification Preferences
Each connected channel has its own independent set of notification topics. You can expand any channel in the list to view and toggle its topics on or off. Changes take effect immediately.
See [Available Notification Topics](./integration-for-slack#available-notification-topics) below for descriptions of each notification type.
The channel list displays each connected channel along with a summary of how many notification topics are enabled (e.g., "6/9 enabled"). To remove an individual channel, click the trash icon next to it. To remove all channel connections for the repository, click **Disconnect**.
### Managing Channel Notification Preferences
Each connected channel has its own independent set of notification topics. You can expand any channel in the list to view and toggle its topics on or off. Changes take effect immediately.
See [Available Notification Topics](./integration-for-slack#available-notification-topics) below for descriptions of each notification type.
Want to receive notifications about your own PRs as personal DMs instead of in a shared channel? Check out the [Personal Slack Notifications](./integration-for-slack#personal-slack-notifications) setup guide.
## Personal Slack Notifications
Get direct messages in Slack about your PRs as they move through the merge queue — queued, testing, merged, failed, and more — without adding noise to team channels.
### Setting up Personal Notifications
**Prerequisite:** The Trunk Slack app must be [installed for your organization](./integration-for-slack#installing-the-trunk-slack-app) before personal notifications can be configured. If the app hasn't been installed yet, the Home tab will display a warning directing a Slack admin to complete the installation.
Personal notification setup is done from the **Trunk Slack app's Home tab** in Slack:
1. Open the **Trunk** app in Slack. If you don't see it in your sidebar, add it via **Apps** → **Manage** → **Browse Apps** and search for "Trunk."
2. Open the **Home** tab.
3. Click **Link Account** to connect your Trunk account to Slack.
4. Connect your **GitHub account** from the Home tab. This is required for PR tracking and most notifications.
5. Configure your notification preferences using the toggles on the Home tab.
![]() ### Using the Trunk Web UI
You can also start setup from the Trunk web app, which will redirect you to Slack to complete the process:
1. Navigate to **Settings** → **Account** → **Notifications** in Trunk.
2. Under **Connect your Slack workspace**, verify your workspace is connected. If not, click **Go to Slack settings** to install the app first.
3. Click **Open in Slack** to jump to the Trunk app's Home tab, where you'll link your account and configure notifications.
### Using the Trunk Web UI
You can also start setup from the Trunk web app, which will redirect you to Slack to complete the process:
1. Navigate to **Settings** → **Account** → **Notifications** in Trunk.
2. Under **Connect your Slack workspace**, verify your workspace is connected. If not, click **Go to Slack settings** to install the app first.
3. Click **Open in Slack** to jump to the Trunk app's Home tab, where you'll link your account and configure notifications.
![]()
Want to send notifications to a shared team channel instead? Check out the [Channel Notifications](./integration-for-slack#channel-notifications) setup guide.
## Slack App Home Dashboard
The Trunk Slack app's **Home** tab provides a personal merge queue dashboard directly in Slack. Open the Trunk app in Slack and click the **Home** tab to see an overview of your merge queue activity across all repositories.
### What You'll See
The Home tab displays the following sections:
* **Refresh** — A button at the top of the Home tab to update the view with the latest queue data, along with a "Last refreshed" timestamp.
* **Account connection status** — Shows your connected identity (e.g., "Connected as **Your Name**"), an **Unlink Account** button, and your GitHub account connection status. You can connect your GitHub account directly from the Home tab if it isn't linked yet.
* **Not Ready** — PRs you've submitted that are waiting for prerequisites (e.g., GitHub mergeability) before entering the queue.
* **PRs in Queue** — Your PRs that are currently in the queue, with real-time status indicators (e.g., "Testing").
* **Recently Merged PRs** — Your most recently merged PRs, with merge dates.
* **Failed PRs** — Your PRs that failed in the queue.
* **Notification Preferences** — Toggle buttons for all notification topics. You can enable or disable individual notifications directly from Slack without visiting the web UI.
All PR sections are grouped by repository and branch. Each PR entry shows the title, PR number, and a link to the GitHub PR. Data is shown across **all merge queues** you submit to, scoped to your PRs via your linked GitHub account.
### Linking Your Account
To use the Home tab, you need to link your Trunk and GitHub accounts. Follow the steps in [Setting up Personal Notifications](./integration-for-slack#setting-up-personal-notifications) — the same account linking process powers both the dashboard and personal DMs.
### Managing Notification Preferences
You can toggle notification topics on or off directly from the Home tab — no need to visit the Trunk web UI. Changes take effect immediately. The available topics are the same as those listed in [Available Notification Topics](./integration-for-slack#available-notification-topics).
## Frequently Asked Questions
Yes, both connections are required. Link your Trunk account from the Slack app's **Home** tab to establish the Slack connection, then connect your GitHub account from the same tab to link your PRs to your Trunk profile.
[Personal notifications](./integration-for-slack#personal-slack-notifications) are sent directly to you via Slack DM and only include updates about your own PRs. They are set up from the Trunk Slack app's Home tab.
[Channel notifications](./integration-for-slack#channel-notifications) are sent to one or more shared team channels and include updates about all PRs in the merge queue. You can connect multiple channels per repository, each with different notification topics.
You can use both simultaneously to stay informed personally while keeping your team updated.
Yes. For personal notifications, toggle topics on or off from the Trunk Slack app's **Home** tab. For channel notifications, configure topics per channel under **Merge Queue** → **\[your repository]** → **Settings** → **Slack Notifications** in the Trunk web app.
You can unlink your account from the Trunk Slack app's Home tab using the **Unlink Account** button. Disconnecting stops personal Slack notifications. You can reconnect at any time by returning to the Home tab and clicking **Link Account**.
The Trunk app must first be [installed at the organization level](./integration-for-slack#installing-the-trunk-slack-app) by a Slack workspace admin. After that, individual users can add it to their sidebar: in Slack, navigate to **Apps** → **Manage** → **Browse Apps**, search for "Trunk," and click **Add**.
## Available Notification Topics
Both channel and personal Slack notifications support the same notification topics. You can customize which events trigger notifications for each channel or for your personal DMs.
![]() | Notification | Description |
| --------------------------------------------------------------------------- | ------------------------------------------------------------------------------------------------------------------------------------------------------------------------------------------------------------------------------------------------------------------------------------------------------------------------------------------------------------------------------------------------------------------------------------------------------------------------------------------- |
| Merge is updated | The merge queue's configuration was changed. This covers anything that changes how the queue acts, including: pausing or draining the queue, changing its mode, changing testing concurrency, and so on. |
| Pull request is submitted for merging | A pull request has been [submitted to the queue](/merge-queue/getting-started#submit-pull-requests) |
| Pull request is admitted to the queue and is waiting to be tested | A pull request has been admitted to the queue and will begin testing as soon as it can |
| Pull request is testing | Trunk merge has begun testing a pull request |
| Pull request has passed tests | Testing has passed on a pull request. The PR will be merged when it reaches the top of the queue |
| Pull request is merged | A pull request submitted to the queue has successfully been merged into its target branch |
| Pull request fails | Testing failed on a pull request and it was removed from the queue or Trunk failed to merge the PR into its target branch |
| Pull request is canceled | A pull request has been canceled, either manually or due to it [reaching a configured testing timeout](/merge-queue/administration/advanced-settings#timeout-for-tests-to-complete) |
| Pull request failed and is waiting for PRs in front of it to finish testing |
| Notification | Description |
| --------------------------------------------------------------------------- | ------------------------------------------------------------------------------------------------------------------------------------------------------------------------------------------------------------------------------------------------------------------------------------------------------------------------------------------------------------------------------------------------------------------------------------------------------------------------------------------- |
| Merge is updated | The merge queue's configuration was changed. This covers anything that changes how the queue acts, including: pausing or draining the queue, changing its mode, changing testing concurrency, and so on. |
| Pull request is submitted for merging | A pull request has been [submitted to the queue](/merge-queue/getting-started#submit-pull-requests) |
| Pull request is admitted to the queue and is waiting to be tested | A pull request has been admitted to the queue and will begin testing as soon as it can |
| Pull request is testing | Trunk merge has begun testing a pull request |
| Pull request has passed tests | Testing has passed on a pull request. The PR will be merged when it reaches the top of the queue |
| Pull request is merged | A pull request submitted to the queue has successfully been merged into its target branch |
| Pull request fails | Testing failed on a pull request and it was removed from the queue or Trunk failed to merge the PR into its target branch |
| Pull request is canceled | A pull request has been canceled, either manually or due to it [reaching a configured testing timeout](/merge-queue/administration/advanced-settings#timeout-for-tests-to-complete) |
| Pull request failed and is waiting for PRs in front of it to finish testing | A pull request failed testing, but the pull request is currently waiting before being kicked. This can happen for one of two reasons:
1. The pull request is not at the head of the queue, so it is waiting to determine if it is the source of the failure or if a PR it depends on is the cause
2. Pending Failure Depth is enabled and the PR is waiting for other PRs below it to finish testing
|
# Overview
Source: https://docs.trunk.io/merge-queue/merge-queue
Trunk Merge Queue runs unrelated PRs in independent test lanes instead of one serial line, keeps merging when a flaky test would stall the queue, and batches changes to cut CI runs.
A merge queue sits between your developers and your protected branch. Instead of letting PRs merge as soon as their own CI passes, the queue tests each PR against the head of `main` plus every PR ahead of it — so what merges is what was actually tested, even when ten PRs land in the same hour. That predictive testing model is shared across most modern merge queues.
Trunk Merge Queue runs on four mechanics. Predictive testing is the correctness baseline; the other three are how Trunk makes it fast and resilient.
Test against everything ahead.
Lanes for unrelated PRs.
CI gets a second chance.
Test many PRs in one CI run.
## When does this make sense?
* Monorepo with lanes of work that don't overlap → parallel queues
* Flaky tests blocking real merges → anti-flake protection
* 50+ PRs/day, CI bill climbing → batching
* Single-track GitHub Merge Queue choking → all three
## More to dial in
Other optimizations worth knowing about:
* [**Priority merging**](./optimizations/priority-merging) — fast-track urgent PRs (hotfixes, incident response) to the front of the queue without bypassing it
* [**Predictive testing internals**](./optimizations/predictive-testing) — how the foundational mechanic actually works
* [**Testing concurrency**](./administration/advanced-settings#testing-concurrency) — how many PRs the queue tests at once
* [**Direct merge to main**](./optimizations/direct-merge-to-main) — skip retesting when a PR is already up to date with `main` and the queue is empty
→ Full list in [Optimizations](./optimizations/).
## Set it up
1. Install the Trunk GitHub App (5 minutes)
2. Create your first queue (2 minutes)
3. Submit a test PR
→ [Get started](./getting-started/).
# Migrate from GitHub Merge Queue
Source: https://docs.trunk.io/merge-queue/migrating-from-github-merge-queue
Switch from GitHub's native merge queue to Trunk Merge Queue with minimal disruption to your workflow.
For teams switching from [GitHub Merge Queues](https://docs.github.com/en/pull-requests/collaborating-with-pull-requests/incorporating-changes-from-a-pull-request/merging-a-pull-request-with-a-merge-queue) to Trunk Merge Queue, the process is straight forward.
Looking for a more detailed comparison between Trunk and GitHub's Merge Queues? [Learn more](https://trunk.io/trunk-vs-github-merge-queue)
***
## Turn off GitHub Merge Queue
To start, you will need to disable the existing merge queue for the target repository. This can be done by navigating to the repository and opening **Settings** → **Branches** → **\[branch rule]** → toggle **Require merge queue** off. Be sure to click **Save changes** to confirm the settings.
Note that only users with admin permissions can manage merge queues for pull requests targeting selected branches of a repository. More information on [manage merge queues](https://docs.github.com/en/repositories/configuring-branches-and-merges-in-your-repository/managing-protected-branches/managing-a-branch-protection-rule#creating-a-branch-protection-rule) can be found in the GitHub documentation.
***
## Enable Trunk Merge Queue
Follow the [Getting Started](./getting-started/) to setup your repo with Trunk Merge Queue and configure the [settings](./administration/advanced-settings) for your repository.
***
## Running both merge queues simultaneously
Many teams prefer a gradual migration approach where Trunk Merge Queue runs alongside GitHub Merge Queue before fully switching over. This is a common path for teams migrating from GitHub's merge queue to Trunk and works well for several reasons:
### No Disruption to Existing Workflows
Enabling Trunk Merge Queue does not stop or prevent your current merging flow. GitHub's merge queue will continue to function normally and merge PRs as it always has. Your team can continue using their familiar workflow while you evaluate Trunk Merge Queue.
### Disable Comments During Evaluation
To prevent confusion for developers who aren't yet aware of the migration, you can disable the comments Trunk leaves on PRs. This way, developers won't see unfamiliar comments about Trunk Merge Queue while you're still evaluating.
This setting is found under the **Merge Queue** tab → **\[repository]** → **Settings** → **GitHub** → toggle **GitHub Comments** off.
### Trunk Handles External Merges Gracefully
Trunk Merge Queue understands when a PR is merged outside of its queue (for example, through GitHub's merge queue):
* **If the PR is also in Trunk's queue**: Trunk will automatically mark it as merged on its side.
* **If the PR is not in Trunk's queue**: Trunk will restart any PRs currently in its queue so they can test on top of the new commit.
This ensures that Trunk always tests against the latest state of your target branch, regardless of how PRs are merged.
***
## Pre-migration
Before migrating fully, it may be useful to evaluate the workflows quietly and confirm settings before converting your repository to an entirely new workflow.
Here are some useful steps to get you familiar with the Trunk Merge Queue workflow without disrupting engineers.
### Enable Trunk Merge for testing but with the automatic comments disabled
While evaluating and testing Trunk Merge Queue for your team, we suggest disabling automatic comments on PRs. This can be done by toggling off GitHub Comments in the Trunk web app.
This setting is found under the **Merge Queue** tab → **\[repository]** → **Settings** → **GitHub** → toggle **GitHub Comments** off.
### Make the switch
Once you have [configured settings](./administration/advanced-settings) and tested out the workflow quietly, turn off other merge tools (like [GitHub merge queue](./migrating-from-github-merge-queue#turn-off-github-merge-queue)), re-enable GitHub comments in the Trunk web app under the **Merge Queue** tab → **\[repository]** → **Settings** → **GitHub** → toggle **GitHub Comments** on
It is important that a repository is configured to use ONLY Trunk Merge Queue and no other merge queue tools for best results.
### Share the news
Now that you have migrated to Trunk Merge Queue, be sure to share the workflow with your team, [using-the-queue](./using-the-queue/)as a great place to start.
***
## Getting help
If you or your team are running into issues, contact [support@trunk.io](mailto:support@trunk.io) for assistance.
# Anti-flake protection
Source: https://docs.trunk.io/merge-queue/optimizations/anti-flake-protection
Combine optimistic merging and pending failure depth to prevent flaky test failures from blocking the merge queue.
## What it is
Some CI jobs fail for reasons unrelated to a PR's code change, such as due to [flaky tests](https://trunk.io/blog/the-ultimate-guide-to-flaky-tests) or a CI runner disconnecting. These failures are usually cleared when the CI job is rerun. If a second PR that depends on the first **does** pass, it is very likely that the first PR was good and experienced a transient failure.
Trunk Merge Queue can use the combination of [**Optimistic Merging** ](./optimistic-merging)and [**Pending Failure Depth**](./pending-failure-depth) to merge pull requests that would otherwise be rejected from the queue.
If you have a lot of flaky tests in your projects, you should track and fix them with [Trunk Flaky Tests](../../flaky-tests/overview). Anti-flake protection helps reduce the impact of flaky tests but doesn't help you detect, track, and eliminate them.
In the video below, you can see an example of this anti-flake protection:
what's happening? queue A, B, C begin predictive testing main \<- A \<- B+a \<- C+baB fails testing main \<- A \<- B+a \<- C+bapredictive failure depth keeps B from being evicted while C tests main \<- A \<- B+a (hold) \<- C+baC passes main \<- A \<- B+a \<- C+baoptimistic merging allows A, B, C to merge merge A B C
Optimistic Merging only works when the [Pending Failure Depth](./pending-failure-depth) is set to **a value greater than zero**. When zero or disabled, Merge will not hold any failed tests in the queue.
## Why use it
* **Eliminate false negatives** - Flaky tests frequently cause PR failures unrelated to actual code changes. Anti-flake protection helps get these under control, so developers don't waste time investigating non-issues.
* **Maintain developer confidence** - When the queue rejects PRs for real reasons (not flaky tests), developers trust the system. Reduces "it's probably just flaky" dismissiveness of real failures.
* **Reduce manual retries** - Developers don't need to manually resubmit PRs or click "retry" when tests flake. Trunk handles it automatically, saving time and frustration.
* **Keep queue moving** - Flaky tests don't stall the queue. PRs that would have been blocked by transient failures merge successfully, increasing overall throughput.
## How to enable
Anti Flake Protection is active when [**Optimistic Merge Queue**](./optimistic-merging) is **On** and [**Pending Failure Depth**](./pending-failure-depth) is **set to a value greater than zero**
Enable Optimistic merging in **Merge Queue** → **\[your repository]** → **Settings** → toggle **Optimistic Merge Queue** on.
Configure Pending Failure Depth in **Merge Queue** → **\[your repository]** → **Settings** → select a value from the **Pending Failure Depth** dropdown.
## Tradeoffs and considerations
### What you gain
* **80-90% reduction in flaky test blocks** - Most flaky failures are caught and handled automatically
* **Developer time saved** - No manual retries or investigation of flaky failures
* **Higher queue throughput** - Flaky tests don't stall the queue
* **Better developer experience** - Less frustration with non-deterministic failures
### What you give up or risk
* **Increased CI cost** - Retrying tests costs additional CI resources (typically 10-20% increase)
* **Slightly longer merge times** - PRs that fail then retry take longer than PRs that pass first time
* **Potential false positives** - Occasionally a legitimate failure might be retried (though Trunk is conservative)
* **Masks underlying problems** - Flaky tests indicate test quality issues; retrying treats symptom, not cause
### When NOT to use anti-flake protection
Don't enable anti-flake protection if:
* **Your tests are not flaky (\< 2% flake rate)** - No benefit, only cost
* **CI resources are extremely limited** - Retries double test costs for flaky PRs
* **You're actively fixing flaky tests** - Better to fix than to mask
* **Flaky tests indicate real issues** - Sometimes "flaky" failures reveal race conditions or timing issues in your code
### When to use anti-flake protection
Do enable anti-flake protection when:
* **Flaky tests are blocking PRs (5-15% flake rate)** - Clear benefit outweighs cost
* **Fixing flaky tests will take time** - Use this as interim solution while improving test quality
* **Infrastructure flakiness** - Network timeouts, resource contention you can't control
* **Third-party dependencies are flaky** - External APIs or services cause transient failures
### The right long-term solution
️ **Anti-flake protection is a band-aid, not a cure.**
**The right approach:**
1. **Enable anti-flake protection** - Unblock your team immediately
2. **Identify flaky tests** - Use CI analytics to find which tests flake most
3. **Fix the root causes** - Make tests deterministic, add retries at test level, improve infrastructure
4. **Reduce flake rate over time** - Goal should be \< 2% flake rate
5. **Consider disabling** - Once tests are stable, anti-flake protection becomes unnecessary
**Red flags indicating systemic issues:**
* Flake rate > 20% (your tests are broken)
* Same tests flake repeatedly (specific tests need fixing)
* All flakes are in one area (infrastructure or test framework issue)
### Common misconceptions
* **Misconception:** "Anti-flake protection lets me ignore flaky tests"
* **Reality:** NO! This is a temporary solution. Flaky tests are a code/test quality problem that must be fixed. Anti-flake protection buys you time to fix them properly.
* **Misconception:** "It retries all failures automatically"
* **Reality:** Trunk is selective. Only failures that match flaky patterns are retried. Legitimate failures still block PRs immediately.
* **Misconception:** "Anti-flake protection wastes tons of CI resources"
* **Reality:** Typical cost increase is 10-20% for teams with moderate flake rates. This is far less than the developer time wasted investigating flaky failures.
* **Misconception:** "I should set retry limit to 10 to catch all flakes"
* **Reality:** If you need 10 retries, your tests are catastrophically broken. Fix the tests! Retry limit should be 1-3 max.
## Next Steps
If you have a lot of flaky tests in your projects, you should track and fix them with [Trunk Flaky Tests](../../flaky-tests/overview). Anti-flake protection helps reduce the impact of flaky tests but doesn't help you detect, track, and eliminate them.
# Batching
Source: https://docs.trunk.io/merge-queue/optimizations/batching
Test multiple PRs together as a single unit to increase merge throughput and reduce CI costs.
## What it is
Batching allows Trunk Merge Queue to test multiple pull requests together as a single unit, rather than testing them one at a time.
When batching is enabled, Trunk intelligently groups compatible PRs and runs your test suite once for the entire batch. If the batch passes, all PRs in the batch merge together, dramatically reducing total test time.
## Why use it
* **Reduce total test time by 60-80%** - Instead of running your full test suite 10 times for 10 PRs, you run it 2-3 times for the same PRs grouped into batches. More PRs merged with less CI time.
* **Increase merge throughput** - Process 3-5x more PRs per hour compared to testing individually. A queue that handled 20 PRs/hour can now handle 60-100 PRs/hour with batching.
* **Lower CI costs** - Fewer test runs means lower CI/CD infrastructure costs. Teams report 50-70% reduction in CI minutes consumed by merge queue testing.
* **Faster time-to-production** - PRs spend less time waiting in queue. What used to take hours can now take minutes, getting features and fixes to production faster.
## How to enable
Batching is **disabled by default** and must be explicitly enabled.
Batching is enabled in the Merge Settings of your repo at **Merge Queue** → **\[your repository]** → **Settings** → **Batching**, then toggle batching **On**.
### Configuration options
With Batching enabled, you can configure two options:
* **Maximum wait time** - The maximum amount of time the Merge Queue should wait to fill the target batch size before beginning testing. A higher maximum wait time will cause the Time-In-Queue metric to increase but have the net effect of reducing CI costs per pull request.
* **Target batch size** - The largest number of entries in the queue that will be tested in a single batch. A larger target batch size will help reduce CI cost per pull request but require more work to be performed when progressive failures necessitate bisection.
A good place to start is with the defaults, Maximum wait time set to 5 (minutes) and Target batch size set to 4 (PRs).
## Excluding PRs from Batching
Sometimes you need a specific PR to test in isolation, even when batching is enabled for your queue. You can prevent individual PRs from batching without changing your overall batching configuration.
### When to use this
* **High-risk changes** — Infrastructure updates, database migrations, or changes that could affect other PRs in unpredictable ways
* **Debugging batch failures** — Isolate a suspected problematic PR to confirm it tests correctly on its own
* **Critical hotfixes** — Make sure a time-sensitive fix isn't delayed or affected by other PRs in a batch
* **Flaky PR isolation** — Test a PR with known flaky behavior separately to avoid impacting other PRs
### How to exclude a PR from batching
**Option 1: Using the `/trunk merge` command**
Add the `--no-batch` flag when submitting your PR:
```
/trunk merge --no-batch
```
**Option 2: Using the API**
Set `noBatch: true` when calling the [`/submitPullRequest`](../reference/merge#post-submitpullrequest) endpoint:
```bash theme={null}
curl -X POST https://api.trunk.io/v1/submitPullRequest \
-H "Content-Type: application/json" \
-H "x-api-token: $TRUNK_API_TOKEN" \
-d '{
"repo": {
"host": "github.com",
"owner": "my-org",
"name": "my-repo"
},
"targetBranch": "main",
"pr": {
"number": 123
},
"noBatch": true
}'
```
### How it works
When a PR is submitted with no-batch:
* **Queue position is unchanged** — The PR maintains its position in the queue based on when it was submitted
* **No restarts triggered** — Submitting a no-batch PR doesn't restart testing for other PRs already in the queue
* **Tests in isolation** — The PR is guaranteed to test by itself, not grouped with other PRs
* **Other PRs unaffected** — Batching continues normally for all other PRs in the queue
Excluding a PR from batching only affects that specific PR. Your queue's batching settings and other PRs remain unaffected.
## Bisection Concurrency
When a batch fails, Trunk automatically splits it apart (bisects) to identify which PR caused the failure. You can configure a separate, higher concurrency limit specifically for these bisection tests to isolate failures faster without impacting your main queue.
![]() ### Why separate bisection concurrency?
By default, bisection tests use the same concurrency limit as your main queue. This means:
* Bisection can slow down other PRs waiting to merge
* Developers wait longer to learn which PR broke the batch
* Your main queue's throughput decreases during failure investigation
With independent bisection concurrency, you can:
* **Speed up failure isolation** - Run bisection tests at higher concurrency to identify problems faster
* **Maintain queue throughput** - Keep your main queue running at optimal capacity during bisection
* **Optimize each workflow independently** - Be aggressive about isolating failures without impacting successful PR flow
### How it works
When you set a higher bisection concurrency:
1. **Main queue concurrency** controls how many PRs test simultaneously in the normal queue
2. **Bisection concurrency** controls how many PRs test simultaneously during failure isolation
3. Both run independently - bisection tests don't count against your main queue limit
### Why separate bisection concurrency?
By default, bisection tests use the same concurrency limit as your main queue. This means:
* Bisection can slow down other PRs waiting to merge
* Developers wait longer to learn which PR broke the batch
* Your main queue's throughput decreases during failure investigation
With independent bisection concurrency, you can:
* **Speed up failure isolation** - Run bisection tests at higher concurrency to identify problems faster
* **Maintain queue throughput** - Keep your main queue running at optimal capacity during bisection
* **Optimize each workflow independently** - Be aggressive about isolating failures without impacting successful PR flow
### How it works
When you set a higher bisection concurrency:
1. **Main queue concurrency** controls how many PRs test simultaneously in the normal queue
2. **Bisection concurrency** controls how many PRs test simultaneously during failure isolation
3. Both run independently - bisection tests don't count against your main queue limit
* Main queue concurrency: 5
* Bisection concurrency: 15
* Batch `ABCD` fails and needs to be split
The bisection process can spin up 15 test runners to quickly isolate which PR failed, while your main queue continues processing 5 PRs normally. Developers get faster feedback about failures without slowing down successful merges.
### Configuring bisection concurrency
Navigate to **Merge Queue** → **\[your repository]** → **Settings** → **Batching**:
1. Enable **Batching** (if not already enabled)
2. Find the **Bisection Concurrency** setting
3. Set a value higher than your main **Testing Concurrency** for faster failure isolation
4. Monitor your CI resource usage and adjust as needed
### Recommended settings
* Main queue concurrency: 5
* Bisection concurrency: 10
* Good for: Teams managing CI costs carefully
* Main queue concurrency: 10
* Bisection concurrency: 25
* Good for: Teams with moderate CI capacity
* Main queue concurrency: 25
* Bisection concurrency: 50
* Good for: Teams prioritizing fast feedback over CI costs
### When to use higher bisection concurrency
Consider increasing bisection concurrency if:
* Developers frequently wait for bisection results to know what to fix
* Your CI system has spare capacity during failure investigation
* Large batches fail and take a long time to isolate the culprit
* Fast feedback on failures is critical to your workflow
### Monitoring and optimization
Track these metrics to optimize your bisection concurrency:
* **Time to isolate failures** - How long it takes to identify which PR broke a batch
* **CI resource usage during bisection** - Are you maxing out your runners?
* **Developer wait time** - How long developers wait for failure feedback
* **Main queue throughput during bisection** - Is bisection slowing down other PRs?
Start with bisection concurrency 2x your main queue concurrency, monitor the impact, and adjust based on your team's priorities and CI capacity.
### Best practices
* Set bisection concurrency higher than main queue - This is the whole point of the feature
* Monitor CI costs - Higher bisection concurrency means more runners during failures
* Start conservative - Begin with 2x main concurrency and increase gradually
* Combine with other optimizations - Works best alongside Pending Failure Depth and Anti-flake Protection
* **Don't** set too high - Extremely high bisection concurrency can overwhelm CI systems
* **Don't** set lower than main queue - This defeats the purpose and slows down bisection
## Test Caching During Bisection
When a batch fails and Trunk splits it apart to identify the failing PR, the merge queue intelligently reuses test results it has already collected during the bisection process. This avoids redundant CI runs and speeds up failure isolation.
### How it works
During bisection, Trunk maintains a cache of test results as it progressively splits the failed batch. If the queue knows with certainty that a particular combination of PRs will fail (because it already tested that exact combination earlier in the bisection process), it skips running the test again and reuses the previous result.
1. Batch `ABCD` fails testing (main ← ABCD)
2. Trunk splits the batch: `AB` and `CD`
3. Tests `AB` (passes) and `CD` (fails)
4. Now Trunk needs to split `CD` further: `C` and `D`
5. Before testing, Trunk checks: "Have I already tested `C` or `D` individually?"
6. If `main ← ABCD` failed and `main ← AB` passed, Trunk knows `CD` contains the failure
7. When testing `main ← AB ← C`, if this combination was already tested earlier, reuse that result
8. Skip redundant CI runs and identify the failing PR faster
### Benefits
**Faster failure isolation**: Skip tests you've already run during bisection, reducing time to identify the culprit PR
**Significant CI cost savings**: Especially important for large batches or expensive test suites where redundant tests would waste substantial resources
**Quicker developer feedback**: Developers learn which PR broke the batch sooner, allowing them to fix issues faster
**Automatic optimization**: No configuration required - the merge queue automatically detects and reuses applicable test results
### When test caching applies
Test caching only applies during the bisection process when:
1. **Batching is enabled** - This is a batching-specific optimization
2. **A batch has failed** and is being split to identify the failure
3. **The merge queue has already tested** a specific combination of PRs during the current bisection
4. **The test result is definitive** - The queue has high confidence the result would be the same
Test caching does **not** apply to:
* Initial batch testing (before any failures)
* PRs in the main queue that aren't undergoing bisection
* Tests that haven't been run yet in the current bisection process
### Example scenario
**Without test caching:**
* Batch `ABCDEF` (6 PRs) fails
* First bisection: Test `ABC` and `DEF` (2 CI runs)
* `DEF` fails, need to split further
* Second bisection: Test `DE` and `F` (2 CI runs)
* `DE` fails, need to split further
* Third bisection: Test `D` and `E` (2 CI runs)
* Total: 6 CI runs to isolate the failure
**With test caching:**
* Batch `ABCDEF` fails - we know `ABCDEF` combination fails
* First bisection: Test `ABC` (passes) and identify `DEF` fails (no new test needed - we know from original batch)
* Second bisection: Test `DE` - if we've already tested this combination, reuse result
* Third bisection: Test `D` or `E` - reuse any already-known results
* Total: 2-4 CI runs instead of 6
The exact savings depend on your batch size, bisection pattern, and which combinations have already been tested.
### Best practices
* Use with larger batch sizes - More PRs in a batch means more opportunities to cache results
* Combine with bisection concurrency - Fast bisection + test caching = maximum efficiency
* Enable batching - This feature only works when batching is enabled
* Monitor your metrics - Track CI spend and bisection time to see the impact
* **Don't** try to configure it - Test caching is automatic and always enabled when batching
* **Don't** rely on it for flaky tests - Caching assumes consistent test behavior; flaky tests may bypass caching for safety
### How this works with other features
Test caching complements other batching optimizations:
* **Bisection Concurrency** - Run bisection tests faster AND skip redundant ones
* **Pending Failure Depth** - Keep more PRs in queue during failure recovery
* **Optimistic Merging** - Merge successful batches while bisection runs in background
Together, these features create a highly efficient batch failure recovery system that minimizes both time and CI cost.
**Note:** Test caching for batch failure isolation is automatically enabled for all repositories using batching mode. No configuration is required.
## Fine tuning batch sizes
**Signs your batch size is too large:**
* Batches frequently fail and need to be split
* Long wait times to form full batches
* Test suite times out or becomes unstable
**Signs your batch size is too small:**
* Not seeing significant throughput improvement
* Batches form immediately (could handle more PRs)
* Still consuming lots of CI resources
**Optimal batch size depends on:**
* Test suite speed (faster tests = larger batches)
* Test stability (more flaky tests = smaller batches)
* PR submission rate (more PRs = larger batches)
## Tradeoffs and considerations
The downsides here are very limited. Since batching combines multiple pull requests into one, you essentially give up the proof that every pull request in complete isolation can safely be merged into your protected branch.
In the unlikely case that you have to revert a change from your protected branch or do a rollback, you will need to retest that revert or submit it to the queue to make sure nothing has broken. In practice, this re-testing is required in almost any case, regardless of how it was originally merged, and the downsides are fairly limited.
### Common misconceptions
* **Misconception:** "Batching merges multiple PRs into a single commit"
* **Reality:** No! Each PR is still merged as a separate commit. Batching only affects testing, not merging.
* **Misconception:** "If a batch fails, all PRs in the batch fail"
* **Reality:** Trunk automatically splits the batch and retests to identify only the failing PR(s). Passing PRs still merge.
* **Misconception:** "Batching always makes the queue faster"
* **Reality:** Batching is most effective with stable tests and high PR volume. For low-traffic repos or flaky tests, the overhead may outweigh benefits.
## Related features
Batching works exceptionally well with these optimizations:
**Predictive testing** - Batching builds on predictive testing. Batches are tested against the projected future state of main, just like individual PRs. These features complement each other perfectly.
**Optimistic merging** - While a batch is testing, the next batch can begin forming and testing optimistically. Combining batching with optimistic merging provides maximum throughput. Configure both for best results.
**Pending failure depth** - When a batch fails, [pending failure depth](./pending-failure-depth) controls how many successor test runs the system waits on before transitioning the failed batch. Combined with optimistic merging, this can prevent premature bisection of a batch that only failed due to a transient issue.
**Anti-flake protection** - Essential companion to batching. Reduces false batch failures caused by flaky tests, making batching more reliable and efficient.
## How batching interacts with parallel queues and PFD
Batching, [parallel queues](./parallel-queues), [pending failure depth](./pending-failure-depth), and [optimistic merging](./optimistic-merging) each shape the queue independently — but they also interact in ways that are easy to miss when reading each page in isolation. This section covers the cross-feature behaviors customers most often ask about.
### Batching is another form of lane
It's tempting to think of batching as something that happens *within* a parallel-queue lane. It's clearer to think of a batch as **itself another form of lane**: a temporary testing-lane shape that groups PRs together for a single test run.
Parallel queues split the queue into lanes based on impacted targets. Batching groups PRs into a single test unit. Both produce a "thing the queue tests as one." The two are orthogonal — you can run batching inside a parallel-queue setup, and the graph view shows the resulting lane shapes.
Use the merge queue graph view to see how batches and parallel-queue lanes overlap for your queue's current state.
### PR batch eligibility
Trunk groups PRs into a batch based on:
* **FIFO order** — PRs are considered for batching in the order they were submitted to the queue.
* **Target overlap** — In parallel mode, PRs only batch together if they share enough impacted-target overlap to belong to the same lane. PRs with disjoint target sets stay in separate lanes and don't batch with each other.
* **Maximum wait time and target batch size** — A batch forms when either the target batch size fills, or the maximum wait time elapses with at least one PR present.
* **`--no-batch` flag** — PRs submitted with `--no-batch` (or `noBatch: true` via API) test in isolation, regardless of the batching configuration.
If a PR ahead in the queue declares it impacts ALL targets, every PR queued behind it is serialized behind it — see the next section.
### An ALL-impacting PR serializes every downstream PR
A PR that impacts ALL targets becomes a prerequisite of *every* PR queued behind it. Even a downstream PR that shares no targets with it is serialized behind it and cannot test in parallel until the ALL-impacting PR resolves. Declaring ALL impact means the PR could affect anything, so Trunk cannot safely test anything queued after it in parallel.
Concretely: if PR-A impacts ALL targets and PR-B impacts only `docs`, PR-B cannot test in parallel behind PR-A. PR-B waits until PR-A finishes. No parallel optimization is possible past an ALL-impacting PR.
ALL impact is a serialization point: every PR behind it depends on it regardless of target overlap, so parallel queues collapse to a single lane until the ALL-impacting PR clears.
### Transitive dependents are usually captured by impacted targets
A common worry: "PR-1 changes target X, PR-2 introduces a feature that depends on X's old behavior. Will they merge in parallel and break main?"
If the two PRs share zero impacted targets, the queue treats them as parallel-safe. In practice this is rare: most impact-detection tools (Bazel, Nx, and similar) include transitive dependents when computing impacted targets. PR-2 would typically list target X as well, putting them in the same lane.
If your impact-detection setup misses transitive dependents, you'll see false-parallel merges. That's a signal to widen your impact graph, not to disable parallel mode.
### Bisection splits in half, not one-by-one
When a batch fails and the queue needs to find the culprit, it **splits the batch in half** rather than peeling off individual PRs.
A batch of 5 doesn't bisect into 5 isolated tests. It bisects into 2 sub-batches, retests, and recurses on whichever sub-batch failed. Your **Bisection Concurrency** is the concurrency limit for those sub-batch test runs — not the number of individual PRs being retested at once.
This matters when you size bisection concurrency: setting it equal to your batch size is more than you need. The bisection process is logarithmic in batch size.
### PFD's downstream-PR delay
Pending failure depth waits for **predecessor** groups to finish (always) and **successor** groups to finish (up to the configured depth). One consequence customers hit:
> **Example.** PFD is set to 1. PR-A fails. PR-B is testing behind it. A new PR-C arrives that shares impacted targets with PR-A. The queue will wait for PR-C to finish testing before it transitions PR-A out of Pending Failure — even though PR-C wasn't in the queue when PR-A failed.
This is by design. PFD's correctness signal depends on observing how successor PRs that include the failed group's changes behave. A newly-arrived overlapping PR is a valid successor test — its result is informative about whether PR-A's failure was a flake or a real failure. Waiting for it produces a stronger signal.
The trade-off: high PFD values combined with frequent new submissions can extend the time before a known-failed PR is kicked from the queue.
If you need an upper bound on how many successor *conclusions* (not just queue positions) PFD waits on, that's an active area of design — share your use case with support.
### Disabling optimistic merge causes batch-removal restarts
[Optimistic merging](./optimistic-merging) lets downstream batches keep testing against a projected future state of main while an upstream batch is still being resolved. If you disable optimistic merging, the queue can no longer reuse those downstream test results when the upstream batch changes shape.
So if a batch ahead of yours is removed (for example, because it failed bisection and one PR was kicked), your batch may need to **re-test from scratch** — even if it had already passed. Customers who disabled optimistic merging have reported PRs going from "ready to merge" back to "testing" specifically because of this restart behavior.
If you're seeing unexplained re-tests of already-passing batches, check whether optimistic merging is disabled.
### MQ-only failures aren't yet flakiness signals
A test that fails in the merge queue but passes on main isn't currently fed into [Trunk Flaky Tests](../../flaky-tests/overview) as a flakiness signal. Similarly, bisection test runs aren't surfaced as flakiness data today.
In practice, the queue's anti-flake protection (optimistic merging + PFD) catches a lot of these transient failures without needing a separate flakiness signal. But if you're trying to understand why an MQ-only flake doesn't show up in your flaky-test dashboard, that's why.
### Event-side view
For the webhook lifecycle of these batch events — including the `pending_failure` event that fires when a batch enters the hold state — see the [webhooks reference](../webhooks).
## Batching + Optimistic Merging and Pending Failure Depth
Enabling batching along with Pending Failure Depth and Optimistic Merging can help you realize the major cost savings of batching while still reaping the [anti-flake](./anti-flake-protection) protection of optimistic merging and pending failure depth.
event queue Enqueue A, B, C, D, E, F, G main \<- ABC \<- DEF +abcBatch ABC fails main \<- ABCpending failure depth keeps ABC from being evicted while DEF main \<- ABC (hold) \<- DEF+abcDEF passes main \<- ABC \<- DEF+abcoptimistic merging allows ABC and DEF to merge merge ABC, DEF
Combined, Pending Failure Depth, Optimistic Merging, and Batching can greatly improve your CI performance because now Merge can optimistically merge whole batches of PRs with far less wasted testing.
## Next steps
**Start with batching:**
1. Enable batching with conservative settings (batch size: 3-5)
2. Monitor for a few days and observe behavior
3. Gradually increase batch size as you gain confidence
4. Check [Metrics and monitoring](../administration/metrics) to measure impact
**Optimize further:**
* [Optimistic merging](./optimistic-merging) - Combine with batching for maximum throughput
* [Anti-flake protection](./anti-flake-protection) - Reduce false batch failures
* [Pending failure depth](./pending-failure-depth) - Tune behavior during batch failures
**Monitor performance:**
* [Metrics and monitoring](../administration/metrics) - Track throughput improvements and CI cost savings
* Watch batch failure rate (should be \<10%)
* Measure time-to-merge improvements
**Troubleshoot issues:**
* If batches fail frequently → Lower batch size or enable [Anti-flake protection](./anti-flake-protection)
* If not seeing improvements → Check PR volume and test stability
* For detailed help → [Troubleshooting](../reference/troubleshooting)
# Direct merge to main
Source: https://docs.trunk.io/merge-queue/optimizations/direct-merge-to-main
Skip redundant retesting and merge PRs directly when they are already tested against the current tip of main.
## Overview
Direct Merge to Main is an optimization that allows PRs to merge immediately without waiting in the queue when retesting would provide no value.
The merge queue's purpose is to test your PR against the latest version of main and all PRs ahead of it in the queue. However, if your PR is already based on the tip of main AND the queue is empty, running tests again provides no additional confidence—you've already tested against the exact state your PR will merge into.
With Direct Merge to Main enabled, Trunk recognizes this situation and merges your PR immediately, skipping the redundant test run and eliminating unnecessary wait time.
### How It Works
**Without Direct Merge to Main:**
1. PR enters the queue based on tip of main
2. Queue creates a test branch
3. Tests run (even though they just passed on the same code)
4. After tests pass, PR merges
5. Total time: Test duration + queue overhead
**With Direct Merge to Main:**
1. PR enters the queue based on tip of main
2. Queue recognizes: PR is up-to-date AND queue is empty
3. PR merges immediately
4. Total time: \~seconds
### When Direct Merge Happens
Direct Merge to Main only activates when **ALL** of these conditions are met:
* **PR is based on the tip of main** - The PR's base commit matches the current HEAD of your main branch
* **Queue is empty** - No other PRs are currently in the queue waiting to test or merge
* **PR's tests have passed** - The PR's CI checks passed on GitHub (before entering the queue)
* **Direct Merge is enabled** - The setting is turned on in your merge queue configuration
If any of these conditions are not met, the PR enters the queue normally and tests predictively as usual.
**Scenario 1: Perfect candidate for Direct Merge**
* Developer updates their PR to tip of main using "Update branch" on GitHub
* All CI checks pass on the PR
* Developer submits to merge queue
* Queue is currently empty
* **Result:** PR merges immediately (seconds instead of minutes)
**Scenario 2: PR not up-to-date**
* PR was created yesterday and main has advanced
* Developer submits to merge queue
* Queue is empty
* **Result:** PR enters queue normally, tests against current main
**Scenario 3: Queue has other PRs**
* PR is based on tip of main
* Another PR is already in the queue
* **Result:** PR enters queue normally behind existing PR, tests predictively
**Scenario 4: Tests haven't passed yet**
* PR is based on tip of main
* Queue is empty
* But CI checks are still running or failed
* **Result:** PR cannot enter queue until checks pass
## When to Enable
**Enable Direct Merge to Main if:**
* You enforce "branch must be up-to-date with main" GitHub protection
* Developers frequently update PRs to latest main before merging
* Your test suite takes 5+ minutes to run
* You have good test coverage and trust your main branch tests
**Don't enable if:**
* You rarely keep PRs up-to-date with main (feature won't trigger often)
* You want every PR to test in the queue regardless (for additional validation)
* Your tests are very fast (\< 1 minute) and the optimization is negligible
## Configuration
### Enable Direct Merge to Main
1. Navigate to **Merge Queue** → **\[your repository]** → **Settings**
2. Locate the **Direct Merge Mode** toggle
3. Enable the setting
4. Changes take effect immediately
![]() ### Verify It's Working
When a PR is directly merged, you'll see different timeline messages and notifications:
**In Trunk Dashboard:**
> "Merged to main without going through the queue, as it was up-to-date with main and the queue was empty"
**In GitHub comments:**
> "This PR was merged directly to main because it was already up-to-date and the queue was empty."
**In** [**Slack notifications**](../integration-for-slack) **(if configured):**
> "✅ PR #123 merged directly (was up-to-date, queue empty)"
These messages confirm that the optimization triggered and your PR skipped the queue.
## How This Works with Other Features
Direct Merge to Main complements other optimizations:
[**Predictive Testing**](./predictive-testing)
* When direct merge doesn't trigger, predictive testing takes over
* PRs not at tip of main test against predicted future state
* Both features work together: direct merge handles the tip, predictive testing handles the rest
[**Optimistic Merging**](./optimistic-merging)
* Optimistic merging handles PRs deeper in queue
* Direct merge handles the special case at the front
* Both reduce unnecessary waiting
[**Batching**](./batching)
* If queue has batching enabled and isn't empty, direct merge won't trigger
* Batching takes priority when multiple PRs are present
* Direct merge is for the empty queue case
[**Parallel Queues**](./parallel-queues/)
* Works in both Single and Parallel mode
* In parallel mode, checks if PR's specific lane is empty
* Provides benefit across all queue configurations
## Troubleshooting
### Verify It's Working
When a PR is directly merged, you'll see different timeline messages and notifications:
**In Trunk Dashboard:**
> "Merged to main without going through the queue, as it was up-to-date with main and the queue was empty"
**In GitHub comments:**
> "This PR was merged directly to main because it was already up-to-date and the queue was empty."
**In** [**Slack notifications**](../integration-for-slack) **(if configured):**
> "✅ PR #123 merged directly (was up-to-date, queue empty)"
These messages confirm that the optimization triggered and your PR skipped the queue.
## How This Works with Other Features
Direct Merge to Main complements other optimizations:
[**Predictive Testing**](./predictive-testing)
* When direct merge doesn't trigger, predictive testing takes over
* PRs not at tip of main test against predicted future state
* Both features work together: direct merge handles the tip, predictive testing handles the rest
[**Optimistic Merging**](./optimistic-merging)
* Optimistic merging handles PRs deeper in queue
* Direct merge handles the special case at the front
* Both reduce unnecessary waiting
[**Batching**](./batching)
* If queue has batching enabled and isn't empty, direct merge won't trigger
* Batching takes priority when multiple PRs are present
* Direct merge is for the empty queue case
[**Parallel Queues**](./parallel-queues/)
* Works in both Single and Parallel mode
* In parallel mode, checks if PR's specific lane is empty
* Provides benefit across all queue configurations
## Troubleshooting
Check these conditions:
1. Was your PR based on the tip of main? (Check GitHub branch status)
2. Was the queue completely empty when you submitted? (Check queue dashboard)
3. Had your PR's tests passed? (Check GitHub status checks)
4. Is Direct Merge to Main enabled? (Check Merge Queue settings)
If all conditions were met but direct merge didn't happen, contact support with the PR number.
No. Direct merge only skips the queue testing step. Your PR must still:
* Pass all required status checks on GitHub
* Meet all branch protection requirements
* Have the necessary approvals
* Be based on the latest main branch
No. Direct merge only happens when the queue is empty, so there are no other PRs to slow down. When other PRs are present, direct merge doesn't trigger and the queue operates normally.
Direct merge relies on the tests that ran on your PR branch (before entering the queue). If those tests are flaky and gave a false positive, the issue existed before direct merge. Focus on fixing flaky tests rather than disabling the optimization.
# Optimizations
Source: https://docs.trunk.io/merge-queue/optimizations/index
Advanced features that increase merge throughput, handle flaky tests, and prioritize critical PRs in Trunk Merge Queue.
The core concept of any merge queue is [**Predictive Testing**](./predictive-testing): testing your pull request against the head of the `main` branch, including all pull requests ahead of it in the queue.
While this is the foundation, achieving the scale necessary to merge thousands of PRs per day requires more advanced strategies. Trunk Merge Queue introduces a set of features designed to maximize throughput and maintain velocity, even in complex, high-traffic repositories. In fact, hitting a high scale is nearly impossible without features like optimistic merging, pending failure depth, and batching.
This section explains each of these key concepts:
## Throughput and speed
* [**Batching**](./batching): Groups multiple compatible pull requests together into a single test run. This significantly increases merge throughput and can dramatically reduce CI costs by validating an entire batch with a single test run instead of one for each individual pull request. It is an essential feature for achieving high throughput.
* [**Parallel Queues**](./parallel-queues/): Allows for the creation of multiple independent queues that test and merge PRs in parallel. This feature is necessary for large monorepos and transforms the queue from a simple "line" into a more complex and efficient "graph".
* [**Testing Concurrency**](../administration/advanced-settings#testing-concurrency): A setting that defines the maximum number of pull requests that can be tested simultaneously. Fine-tuning this number maximizes merge velocity. It keeps a continuous flow of validated pull requests moving by keeping your CI runners fully utilized.
## Resilience and flake handling
* [**Optimistic Merging**](./optimistic-merging): Increases merge speed by using test results from pull requests that are later in the queue. When a pull request (e.g., pull request 'c') passes testing, its success also verifies the changes from the pull requests ahead of it ('a' and 'b'). This allows the entire group of pull requests to be safely merged at once.
* [**Pending Failure Depth**](./pending-failure-depth): When a group fails testing, it enters a Pending Failure state and waits for successor test runs to complete before transitioning. When combined with Optimistic Merging, a passing successor can retroactively clear the failure, enabling automated recovery from transient (flaky) failures without evicting the group from the queue.
* [**Anti-Flake Protection**](./anti-flake-protection): Combining Optimistic Merging and Pending Failure Depth makes the queue more resilient to flaky tests. This inherent outcome allows the successful test of a later pull request to retroactively validate an earlier one that failed due to a transient issue.
**Note on flaky tests**
While Anti-Flake Protection provides resilience to flaky tests through queue mechanics, they still delay merges. Trunk Flaky Tests addresses the root cause by automatically [detecting](../../flaky-tests/detection/index) and [quarantining](../../flaky-tests/quarantining/) flaky tests at runtime while maintaining test visibility. For maximum throughput, [integrate Flaky Tests](../../flaky-tests/get-started/) to work alongside Anti-Flake Protection.
* [**Flaky Tests Quarantining**](../../flaky-tests/quarantining/index) (via [Flaky Tests](../../flaky-tests/overview)): Automatically detects and quarantines flaky tests to prevent their failures from blocking the merge queue. Quarantined tests continue running and uploading results for visibility, allowing your team to identify and fix them while eliminating false-negative blockages. This foundation of clean test signals is essential for achieving maximum queue throughput.
## Prioritization
* [**Priority Merging**](./priority-merging): Provides the ability to prioritize certain pull requests, allowing urgent changes or hotfixes to bypass the standard queue order and be tested and merged more quickly.
# Optimistic merging
Source: https://docs.trunk.io/merge-queue/optimizations/optimistic-merging
Merge PRs faster by using passing test results from later PRs in the queue to validate earlier ones.
## What it is
Optimistic merging allows pull requests that fail tests to still get merged if pull requests behind them in the queue pass *their* tests. The assumption is that the queue has proof that while one specific PR might fail tests, it passes them when combined with a pull request that is going to merge soon behind it.
The foundation of our merge queue starts with [predictive testing](/merge-queue/optimizations/predictive-testing). When a predictive test is being run, concurrent tests sometimes finish before the work ahead of it. This creates a situation where the system knows that all code ahead of it collectively `passes` tests, and it is safe to merge all those changes into your protected branch (`main)`.\
\
With optimistic merging enabled, the queue uses results from pull requests later in the queue to merge faster. In the illustration below you can see that pull request 'c' includes the verified testing results of pull requests 'b' and 'a'. As soon as 'c' passes testing, we can safely merge 'a', 'b', and 'c' and know they will all work correctly together.
## Why use it
* **Eliminate idle time** - The queue doesn't sit idle waiting for merges to complete. As soon as a PR enters the "merging" phase, the next PR begins testing. Result: 20-30% reduction in average PR wait time.
* **Increase throughput** - More PRs can be in-flight simultaneously. Queues using optimistic merging process 1.5-2x more PRs per hour compared to sequential testing.
* **Faster time-to-production** - PRs merge faster because they don't wait for the previous PR to fully complete. What used to take 30 minutes might now take 20 minutes.
* **Better resource utilization** - Your CI infrastructure isn't sitting idle between tests. Continuous testing means more efficient use of your CI capacity.
## How to enable
Optimistic merging is **disabled by default** and should be enabled after you're confident in your basic queue setup.
Enable Optimistic merging in **Merge Queue** → **\[your repository]** → **Settings** → toggle **Optimistic Merge Queue** on.
### Verify it's working
After enabling, watch your queue:
* Multiple PRs should show "Testing" status simultaneously
* New PR starts testing before previous PR shows "Merged"
* In your CI, you'll see overlapping test runs
**Start conservative:** Enable optimistic merging after you've validated basic queue functionality. Don't enable it on day one.
## Tradeoffs and considerations
The downsides here are very limited. You essentially give up the proof that every pull request in complete isolation can safely be merged into your protected branch.
In the unlikely case that you have to revert a change from your protected branch, you will need to retest that revert or submit it to the queue to make sure nothing has broken. In practice, this re-testing is required in almost any case, regardless of how it was originally merged, and the downsides are fairly limited.
### What you gain
* **faster average merge time** - Less idle time between tests
* **higher throughput** - More PRs processing simultaneously
* **Better CI utilization** - Continuous testing instead of start-stop
* **Faster incident response** - Critical PRs merge quicker
### What you give up or risk
* **Wasted CI on retests (rare)** - If an optimistically-tested PR needs to retest, you've used some CI resources unnecessarily
* **More complex queue state** - Multiple PRs in "testing" can be confusing initially
* **Requires stable tests** - Flaky tests cause more retests with optimistic merging
### When NOT to use optimistic merging
Don't enable optimistic merging if:
* **Your tests are highly flaky (>5% flake rate)** - Retests will negate the benefits
* **Your queue is rarely busy** - If you only have 1-2 PRs per hour, there's nothing to optimize
* **You're still learning the queue** - Get comfortable with basic functionality first
* **Your merges frequently fail** - If PRs often fail during merge (not testing), optimistic assumptions will be wrong often
### Best practices
**Start without it:** Use Trunk Merge Queue for a week or two before enabling optimistic merging. Understand normal flow first.
**Enable when stable:** Once your queue is working reliably and you have consistent PR volume, optimistic merging provides significant benefits.
**Combine with other optimizations:** Optimistic merging works best alongside:
* [Batching](./batching) - Test batches optimistically
* [Predictive testing](./predictive-testing) - Required foundation for optimistic merging
* [Anti-flake protection](/merge-queue/optimizations/anti-flake-protection) - Reduces unnecessary retests
### Common misconceptions
* **Misconception:** "Optimistic merging is risky - it might merge broken code"
* **Reality:** No! Trunk still requires all tests to pass. Optimistic merging only affects *when* testing starts, not *whether* testing happens. Safety is never compromised.
* **Misconception:** "Optimistic merging causes lots of wasted retests"
* **Reality:** Retests are rare (\< 5% of PRs in typical queues). The throughput gains far outweigh the occasional retest cost.
* **Misconception:** "I should enable every optimization immediately"
* **Reality:** Start with just predictive testing. Add batching once stable. Add optimistic merging last. Build confidence in each layer.
## Next Steps
**Before enabling optimistic merging:**
1. Make sure basic queue is working well
2. Verify test stability (\< 5% flake rate recommended)
3. Enable [Anti-flake protection](./anti-flake-protection) first
4. Check that you have consistent PR volume
**After enabling:**
* [Metrics and monitoring](../administration/metrics) - Track throughput improvements
* Watch for retest rate (should be \< 5%)
* Measure time-to-merge improvements
**Optimize further:**
* [Batching](./batching) - Combine with optimistic merging for maximum effect
* [Pending failure depth](./pending-failure-depth) - Fine-tune simultaneous testing behavior
**Troubleshooting:**
* If seeing frequent retests → Check test stability or disable temporarily
* If not seeing improvements → Check PR volume and queue activity
* For detailed help → [Troubleshooting](../reference/troubleshooting)
# API
Source: https://docs.trunk.io/merge-queue/optimizations/parallel-queues/api
Upload impacted targets, read testing details, and handle the common gotchas
## Uploading impacted targets
Impacted Targets should be computed for every PR. The list of impacted targets should be computed by comparing two different SHAs: the **head of the target branch**, and the **merge commit of the pr**.
Our [reference implementation](https://github.com/trunk-io/bazel-action/tree/main/src/scripts) may be useful in guiding your implementation.
**POST** the list of impacted targets here:`https://api.trunk.io:443/v1/setImpactedTargets`.
```ssml theme={null}
HEADERS:
Content-Type: application/json,
x-api-token: ,
x-forked-workflow-run-id: ${{github.run_id}},
BODY: {
repo: {
host: "github.com",
owner: ,
name: ,
},
pr: {
number: ,
sha: ,
},
targetBranch: ,
impactedTargets: ["target-1", "target-2", ...] OR "ALL"
}
```
`impactedTargets` allows specifying either an array of strings representing the impacted targets from the PR or the string "ALL" (note that this is explicitly not in an array and is just the string "ALL"). Specifying "ALL" is the equivalent of saying that everything that comes into the graph after this PR should be based on this one, which is useful when your PR contains changes that affect the whole repo (such as editing `trunk.yaml` or a GitHub workflow).
### Handling forked pull requests
The HTTP POST must contain the `x-api-token` to prove that it is a valid request from a workflow your org controls. *Workflows that come from forked PRs most likely will not have access to the Trunk org token* required for the HTTP POST above. In this case, you should provide the **run ID** of the workflow as the `x-forked-workflow-run-id` header in place of the `x-api-token`. This ID can be obtained from [the GitHub context](https://docs.github.com/en/actions/learn-github-actions/contexts#github-context) as . Trunk Merge Queue will verify that the ID belongs to a currently running workflow originating from a forked PR with a SHA that matches the one provided in the request and allow it through.
We do not recommend using an event trigger like `pull_request_target.` This would allow workflows from forked PRs to get secrets, which is a security risk and would open your repo to attackers making forks, adding malicious code, and then running it against your repo to exfiltrate information. (see[ Keeping your GitHub Actions and workflows secure](https://securitylab.github.com/research/github-actions-preventing-pwn-requests/)).
## Reading testing details with `/getMergeQueueTestingDetails`
Once a PR is in the queue, `/getMergeQueueTestingDetails` returns the testing batch
that contains it, including the impacted targets being tested. Two response fields
describe targets, and they are not interchangeable:
* `impactedTargetsForTestedPrs` — the union of impacted targets for **only the PRs in
this test run**. This is the batch being predictively tested together.
* `impactedTargets` — `impactedTargetsForTestedPrs` **plus** the impacted targets of
every PR ahead of this batch in the queue. Use this when you need to know everything
that the predictive build is implicitly built on top of.
If you're driving a CI job that should only run the targets owned by the current batch,
read `impactedTargetsForTestedPrs`. If you need the full set of targets the predictive
build state covers (for example, to decide whether to skip a cache rebuild), read
`impactedTargets`.
## Deriving `testRunId` from the merge branch name
Trunk Merge Queue creates a branch per predictive test run with the shape
`trunk-merge/pr-/`. The trailing UUID **is** the `testRunId`
used by the API. CI jobs running against a `trunk-merge/*` branch can parse it directly
from `GITHUB_REF` (or the equivalent ref variable on other CI providers) without an
extra API call.
```bash theme={null}
# trunk-merge/pr-1234/9c3a5b1e-7f02-4b6a-9d11-3a5e8f0c4d22
TEST_RUN_ID="${GITHUB_REF##*/}"
```
## Recipes and gotchas
### "ALL" does not short-circuit the rest of the queue
Uploading `"ALL"` for a PR signals that the PR is impacting every target, so any other
PR in the queue should be considered to overlap with it. It does **not** override or
replace the impacted targets that other PRs upload. If PR A uploads `"ALL"` and PR B
uploads `["frontend"]`, B's frontend targets still matter — A simply joins every lane
B (and every other PR) lives on.
Use `"ALL"` for PRs that genuinely touch the whole graph (editing `trunk.yaml`, a
shared GitHub workflow, or a root-level config). Don't use it as a shortcut for "I
don't want to compute targets for this PR" — you will serialize the queue.
### Last upload wins per head SHA
If you upload impacted targets multiple times for the same PR head SHA, the most
recent upload replaces the earlier ones. There is no merge or union performed
server-side. If your CI recomputes targets after an amend or a force-push, the new
upload is authoritative.
### Reuse `bazel-diff` output between PR and MQ jobs
The `bazel-diff` result that produces your impacted-targets list for a PR build is
the same artifact you'd recompute inside the merge queue's test job. Most Bazel orgs
reuse it: compute once on PR open, upload it to `/setImpactedTargets`, and have the
`trunk-merge/*` CI job pull the same artifact (via `actions/upload-artifact` /
`download-artifact`, an artifact store, or an S3 cache) rather than recomputing.
### Request body size limit
The request body limit is 20 MB. If your target list exceeds the limit, send `"ALL"` as the `impactedTargets` value instead of a full list.
# Bazel
Source: https://docs.trunk.io/merge-queue/optimizations/parallel-queues/bazel
Instructions for enabling dynamic parallel queues powered by your bazel graph
Leveraging [parallel mode](../../merge-queue#single-mode-vs.-parallel-mode) for Trunk Merge Queue is easy for Bazel-enabled repos because Bazel already knows the structure of your code and can automatically generate a dependency graph. Merge can use this information in parallel mode to create dynamic parallel queues enabling your pull requests to run through your Merge Queue faster.\
\
**How do we create parallel queues?**\
By understanding which Bazel targets a pull request affects, we can build a real-time graph and detect intersection points and where distinct non-overlapping graphs exist. This information is essentially a list of unique target names, which can then be used in real time to understand along which targets pull requests might overlap.
**Calculating impacted targets in GitHub Actions**\
Trunk ships a [GitHub action](https://github.com/trunk-io/bazel-action) that will generate the list of impacted targets for a pull request and post that information to the Trunk Merge Queue service.
```yaml theme={null}
name: Upload and Test Impacted Targets
on: pull_request
jobs:
impacted_targets:
name: Impacted Targets
runs-on: ubuntu-latest
steps:
- name: Checkout
uses: actions/checkout@v3
- name: Upload and Test Impacted Targets
uses: trunk-io/bazel-action@v1
with:
upload-targets: "true"
### store your trunk api token to authenticate with merge service
trunk-token: ${{ secrets.TRUNK_API_TOKEN }}
### (optional if your bazel setup is not in the root of your repo)
# bazel-workspace-path: {your bazel workspace path}
```
The above sample GitHub action code will calculate the impacted targets of your pull request and post that information to the trunk merge service. That data will be used to run your trunk merge queue in parallel mode.
# Parallel queues
Source: https://docs.trunk.io/merge-queue/optimizations/parallel-queues/index
Create dynamic parallel queues to reduce queue time
Normally, a merge queue behaves by enqueueing all submitted pull requests into a single line. Under this mode of operation, every pull request is [predictively tested ](/merge-queue/optimizations/predictive-testing)against the pull requests ahead of it. While this guarantees the correctness of the protected branch at all times, under a high submission load, the wait time for an item in the queue can be negatively impacted.
A regular merge queue operates like a grocery store with only a single checkout lane. When a lot of folks are trying to checkout at the same time - the line will grow (sometimes intolerably). With a dynamic parallel queue, trunk merge creates additional checkout lanes in real-time while still guaranteeing that the protected branch doesn't break.
For example, the following four pull requests:
* PR A with impacted target list `[ frontend ]`
* PR B with impacted target list `[ backend ]`
* PR C with impacted target list `[ frontend, backend ]`
* PR D with impacted target list `[ docs ]`
Without parallelization, the PRs **A**, **B**, **C**, and **D** would all be tested in a single predictive path **A** \<- **B** \<- **C** \<- **D**. Using the impacted target information we can instead build three dynamically provisioned queues and the predictive testing can yield higher throughput - which means your pull request spends less time in the queue stuck testing with unrelated code changes.
![Animated diagram of three dynamic parallel queues split by impacted target. The front PRs A, B and D test at the same time across the frontend, backend and docs lanes, each finishing with a green check, then PR C tests in both the frontend and backend lanes because it includes the changes from A and B.]() ## How does it work?
To run in parallel mode, each pull request needs to be inspected for its impacted targets. This is a fancy way of saying that each pull request needs to report what parts of the codebase are changing.
In the example above, the pull requests **A**, **B**, and **D** can be tested in isolation since they affect distinct targets - `backend`, `frontend` and `docs`. The **C** pull request affects both `frontend` and `backend` and would be tested predictively with the changes in both **A** and **B**.
To understand the interactions or dependent changes between pull requests, Trunk Merge Queue provides an API for posting the list of **impacted targets** that result from code changes in every PR. When Trunk Merge Queue is running in parallel mode, pull requests will not be processed until the list of impacted targets are uploaded.
## What are Impacted Targets?
Impacted targets are metadata that describe the logical changes of a pull request. An impacted target is a string that can be as expressive as a Bazel target or the name of a file folder. Calculating impacted targets with a purpose-built build system will provide absolute correctness for the merge queue, but more lightweight glob or folder-based approaches can also work with fewer guarantees around correctness.
## Posting impacted targets from your pull requests
We ship several pre-built solutions for popular build systems to automatically calculate and post the impacted targets of a pull request. If you are using another build system, we would be happy to work with you to add support for your specific build system.
## How does it work?
To run in parallel mode, each pull request needs to be inspected for its impacted targets. This is a fancy way of saying that each pull request needs to report what parts of the codebase are changing.
In the example above, the pull requests **A**, **B**, and **D** can be tested in isolation since they affect distinct targets - `backend`, `frontend` and `docs`. The **C** pull request affects both `frontend` and `backend` and would be tested predictively with the changes in both **A** and **B**.
To understand the interactions or dependent changes between pull requests, Trunk Merge Queue provides an API for posting the list of **impacted targets** that result from code changes in every PR. When Trunk Merge Queue is running in parallel mode, pull requests will not be processed until the list of impacted targets are uploaded.
## What are Impacted Targets?
Impacted targets are metadata that describe the logical changes of a pull request. An impacted target is a string that can be as expressive as a Bazel target or the name of a file folder. Calculating impacted targets with a purpose-built build system will provide absolute correctness for the merge queue, but more lightweight glob or folder-based approaches can also work with fewer guarantees around correctness.
## Posting impacted targets from your pull requests
We ship several pre-built solutions for popular build systems to automatically calculate and post the impacted targets of a pull request. If you are using another build system, we would be happy to work with you to add support for your specific build system.
**Enable Parallel Modes**\
Merge can be swapped between `Single` and `Parallel` mode at any time. If there are no PRs in the merge queue when switching, the switch will be immediate. If there are PRs in the queue, then Merge will go into the `Switching Modes` state, where it'll wait for all currently testing PRs to merge before switching modes. During this time, PRs will not be able to enter the queue.
Switching modes can be done from the `Merge Queue Mode` section of your queue's `Settings` tab (open `Merge Queue`, select your queue, then `Settings`).
![Enabling parallel mode in the Merge Queue Mode settings]()
![Enabling parallel mode in the Merge Queue Mode settings]() ## Monitoring Parallel Queue Performance
Once you've enabled parallel mode and configured impacted targets, you can analyze how well the parallel workflow performs for different parts of your codebase.
The Health dashboard allows you to filter all metrics by impacted targets, so you can:
* Compare merge times between different targets (e.g., frontend vs backend)
* Identify which targets experience the most failures
* Optimize queue configuration for your highest-priority code paths
* Demonstrate the value of parallel mode to engineering leadership
## Monitoring Parallel Queue Performance
Once you've enabled parallel mode and configured impacted targets, you can analyze how well the parallel workflow performs for different parts of your codebase.
The Health dashboard allows you to filter all metrics by impacted targets, so you can:
* Compare merge times between different targets (e.g., frontend vs backend)
* Identify which targets experience the most failures
* Optimize queue configuration for your highest-priority code paths
* Demonstrate the value of parallel mode to engineering leadership
See [Filter Metrics by Impacted Targets ](../../administration/metrics#filter-metrics-by-impacted-targets)for detailed guidance on using this feature.
### Related
* [How batching interacts with parallel queues and PFD](../batching#how-batching-interacts-with-parallel-queues-and-pfd) — including PR batch eligibility, the ALL keyword, and transitive dependents.
# Nx
Source: https://docs.trunk.io/merge-queue/optimizations/parallel-queues/nx
Instructions for enabling dynamic parallel queues powered by your Nx graph
Leveraging [parallel mode](../../merge-queue#single-mode-vs.-parallel-mode) for Trunk Merge Queue is easy for Nx-enabled repos because Nx already knows the structure of your code and can automatically generate a dependency graph. Merge can use this information in parallel mode to create dynamic parallel queues enabling your pull requests to run through your Merge Queue faster.\
\
**How do we create parallel queues?**\
By understanding which Nx targets a pull request affects, we can build a real-time graph and detect intersection points and where distinct non-overlapping graphs exist. This information is essentially a list of unique target names, which can then be used in real time to understand along which targets pull requests might overlap.
**Calculating impacted targets in GitHub Actions**\
Trunk ships a [GitHub action](https://github.com/trunk-io/nx-action) that will generate the list of impacted targets for a pull request and post that information to the Trunk Merge Queue service.
```yaml theme={null}
name: Upload and Test Impacted Targets
on: pull_request
jobs:
impacted_targets:
name: Impacted Targets
runs-on: ubuntu-latest
steps:
- name: Checkout
uses: actions/checkout@v3
- name: compute impacted targets
uses: trunk-io/nx-action@v1
with:
### store your trunk api token to authenticate with merge service
trunk-token: ${{ secrets.TRUNK_API_TOKEN }}
```
The above sample GitHub action code will calculate the impacted targets of your pull request and post that information to the trunk merge service. That data will be used to run your trunk merge queue in parallel mode.
# Pending failure depth
Source: https://docs.trunk.io/merge-queue/optimizations/pending-failure-depth
Keep failed PRs in the queue while successor PRs test, giving transient failures a chance to pass.
## What it is
When a group's test run fails in the merge queue, it doesn't immediately get evicted. Instead, it enters a **Pending Failure** state — a holding state where the system hasn't yet decided whether to mark the group as failed or, if [batching](./batching) is enabled, to bisect the batch to isolate the culprit.
Throughout this page, "group" means either a batch of PRs (when [batching](./batching) is enabled) or an individual PR (when it's not).
![A predictive waterfall where PR b fails and is held, not evicted, while successors keep testing with b's changes included; when a successor passes, b is cleared and a, b, c, d merge.]() ### Waiting for Predecessors
A group in Pending Failure always waits for predecessor groups (the PRs ahead of it in the queue) to finish testing. This is how the system determines root cause:
* If a predecessor also failed, the current group's failure may have been caused by the predecessor. The current group will be retested once the bad predecessor is removed.
* If all predecessors passed, the failure is attributable to the current group itself.
This predecessor-waiting happens regardless of the Pending Failure Depth setting.
### Waiting for Successors (Controlled by Pending Failure Depth)
**Pending Failure Depth** is a configuration value (integer, default 0) that controls how many levels of **successor** test runs (PRs behind the failed group in the queue) the system also waits on before transitioning the group out of the Pending Failure state.
* **When set to 0 (default):** The successor check is skipped. The group transitions as soon as the predecessor condition is met.
* **When set to a value greater than 0:** The system additionally waits for successor groups within that many hops to finish testing before transitioning.
### Why Wait for Successors?
The value of waiting for successors depends on whether [optimistic merging](./optimistic-merging) is enabled:
* **With optimistic merging (primary use case):** If the failure was caused by a flake rather than a real code problem, a successor further down the queue may pass its tests. Because that successor's test run includes the failed group's changes, a passing result is proof that those changes work. Optimistic merging uses this to retroactively clear the failed group and merge it. The Pending Failure Depth window gives those successors time to finish testing before the system prematurely fails or bisects the group. This is the automated [anti-flake protection](./anti-flake-protection) path.
* **Without optimistic merging:** The hold window gives you time to manually inspect the failure and restart the test run if it looks transient, before the system auto-transitions the group to Failed (or bisection, if [batching](./batching) is enabled). This is the only benefit without optimistic merging.
### Waiting for Predecessors
A group in Pending Failure always waits for predecessor groups (the PRs ahead of it in the queue) to finish testing. This is how the system determines root cause:
* If a predecessor also failed, the current group's failure may have been caused by the predecessor. The current group will be retested once the bad predecessor is removed.
* If all predecessors passed, the failure is attributable to the current group itself.
This predecessor-waiting happens regardless of the Pending Failure Depth setting.
### Waiting for Successors (Controlled by Pending Failure Depth)
**Pending Failure Depth** is a configuration value (integer, default 0) that controls how many levels of **successor** test runs (PRs behind the failed group in the queue) the system also waits on before transitioning the group out of the Pending Failure state.
* **When set to 0 (default):** The successor check is skipped. The group transitions as soon as the predecessor condition is met.
* **When set to a value greater than 0:** The system additionally waits for successor groups within that many hops to finish testing before transitioning.
### Why Wait for Successors?
The value of waiting for successors depends on whether [optimistic merging](./optimistic-merging) is enabled:
* **With optimistic merging (primary use case):** If the failure was caused by a flake rather than a real code problem, a successor further down the queue may pass its tests. Because that successor's test run includes the failed group's changes, a passing result is proof that those changes work. Optimistic merging uses this to retroactively clear the failed group and merge it. The Pending Failure Depth window gives those successors time to finish testing before the system prematurely fails or bisects the group. This is the automated [anti-flake protection](./anti-flake-protection) path.
* **Without optimistic merging:** The hold window gives you time to manually inspect the failure and restart the test run if it looks transient, before the system auto-transitions the group to Failed (or bisection, if [batching](./batching) is enabled). This is the only benefit without optimistic merging.
Pending Failure Depth only helps with transient (flaky) failures. For legitimate failures that propagate to successors, those successors will also fail, and the hold window expires without clearing the failure.
### Example: Anti-Flake Protection in Action
This example shows how Pending Failure Depth works together with optimistic merging to automatically recover from a flaky failure:
What's Happening? Queue