Access the Merge Queue dashboard
The Trunk Merge Queue dashboard gives you real-time visibility into your queue’s activity. Access the dashboard:- Navigate to Trunk: https://app.trunk.io
- Select your organization (if you’re in multiple)
- Click the Merge Queue tab in the upper left
- Select your repository from the selector in the page header
- Trunk bot comments include dashboard links
- Click any link in bot comments to go directly to that PR’s status
GitHub status check
When enabled, Trunk posts a check on your PR that reflects the current queue state. The check is namedTrunk Merge Queue (<branch>), for example Trunk Merge Queue (main) for a queue on main. A repository with multiple queues will have a separate check for each branch.
The check is posted once the PR is admitted to the queue and updates in place as it moves through:
- Queued - PR has been admitted to the queue and is waiting to test
- Testing - PR is actively being tested
- Merged - Successfully merged into the base branch
- Cancelled - PR was removed from the queue without merging
- Failed - Tests failed and the PR could not merge
Repository selector
The selector in the page header lets you switch between merge queues without leaving the dashboard. Starred repositories: Click the star icon next to a repository in the selector list to star it. Starred repositories always appear at the top of the list, regardless of organization. Organization grouping: Unstarred repositories are grouped by GitHub organization. Repositories not associated with a GitHub organization appear under Other repositories. Search: Type to filter the repository list by name. Search also matches branch names, making it easy to find the right queue when multiple repositories share a branch.Queue overview
The main dashboard shows a high-level view of your merge queue activity.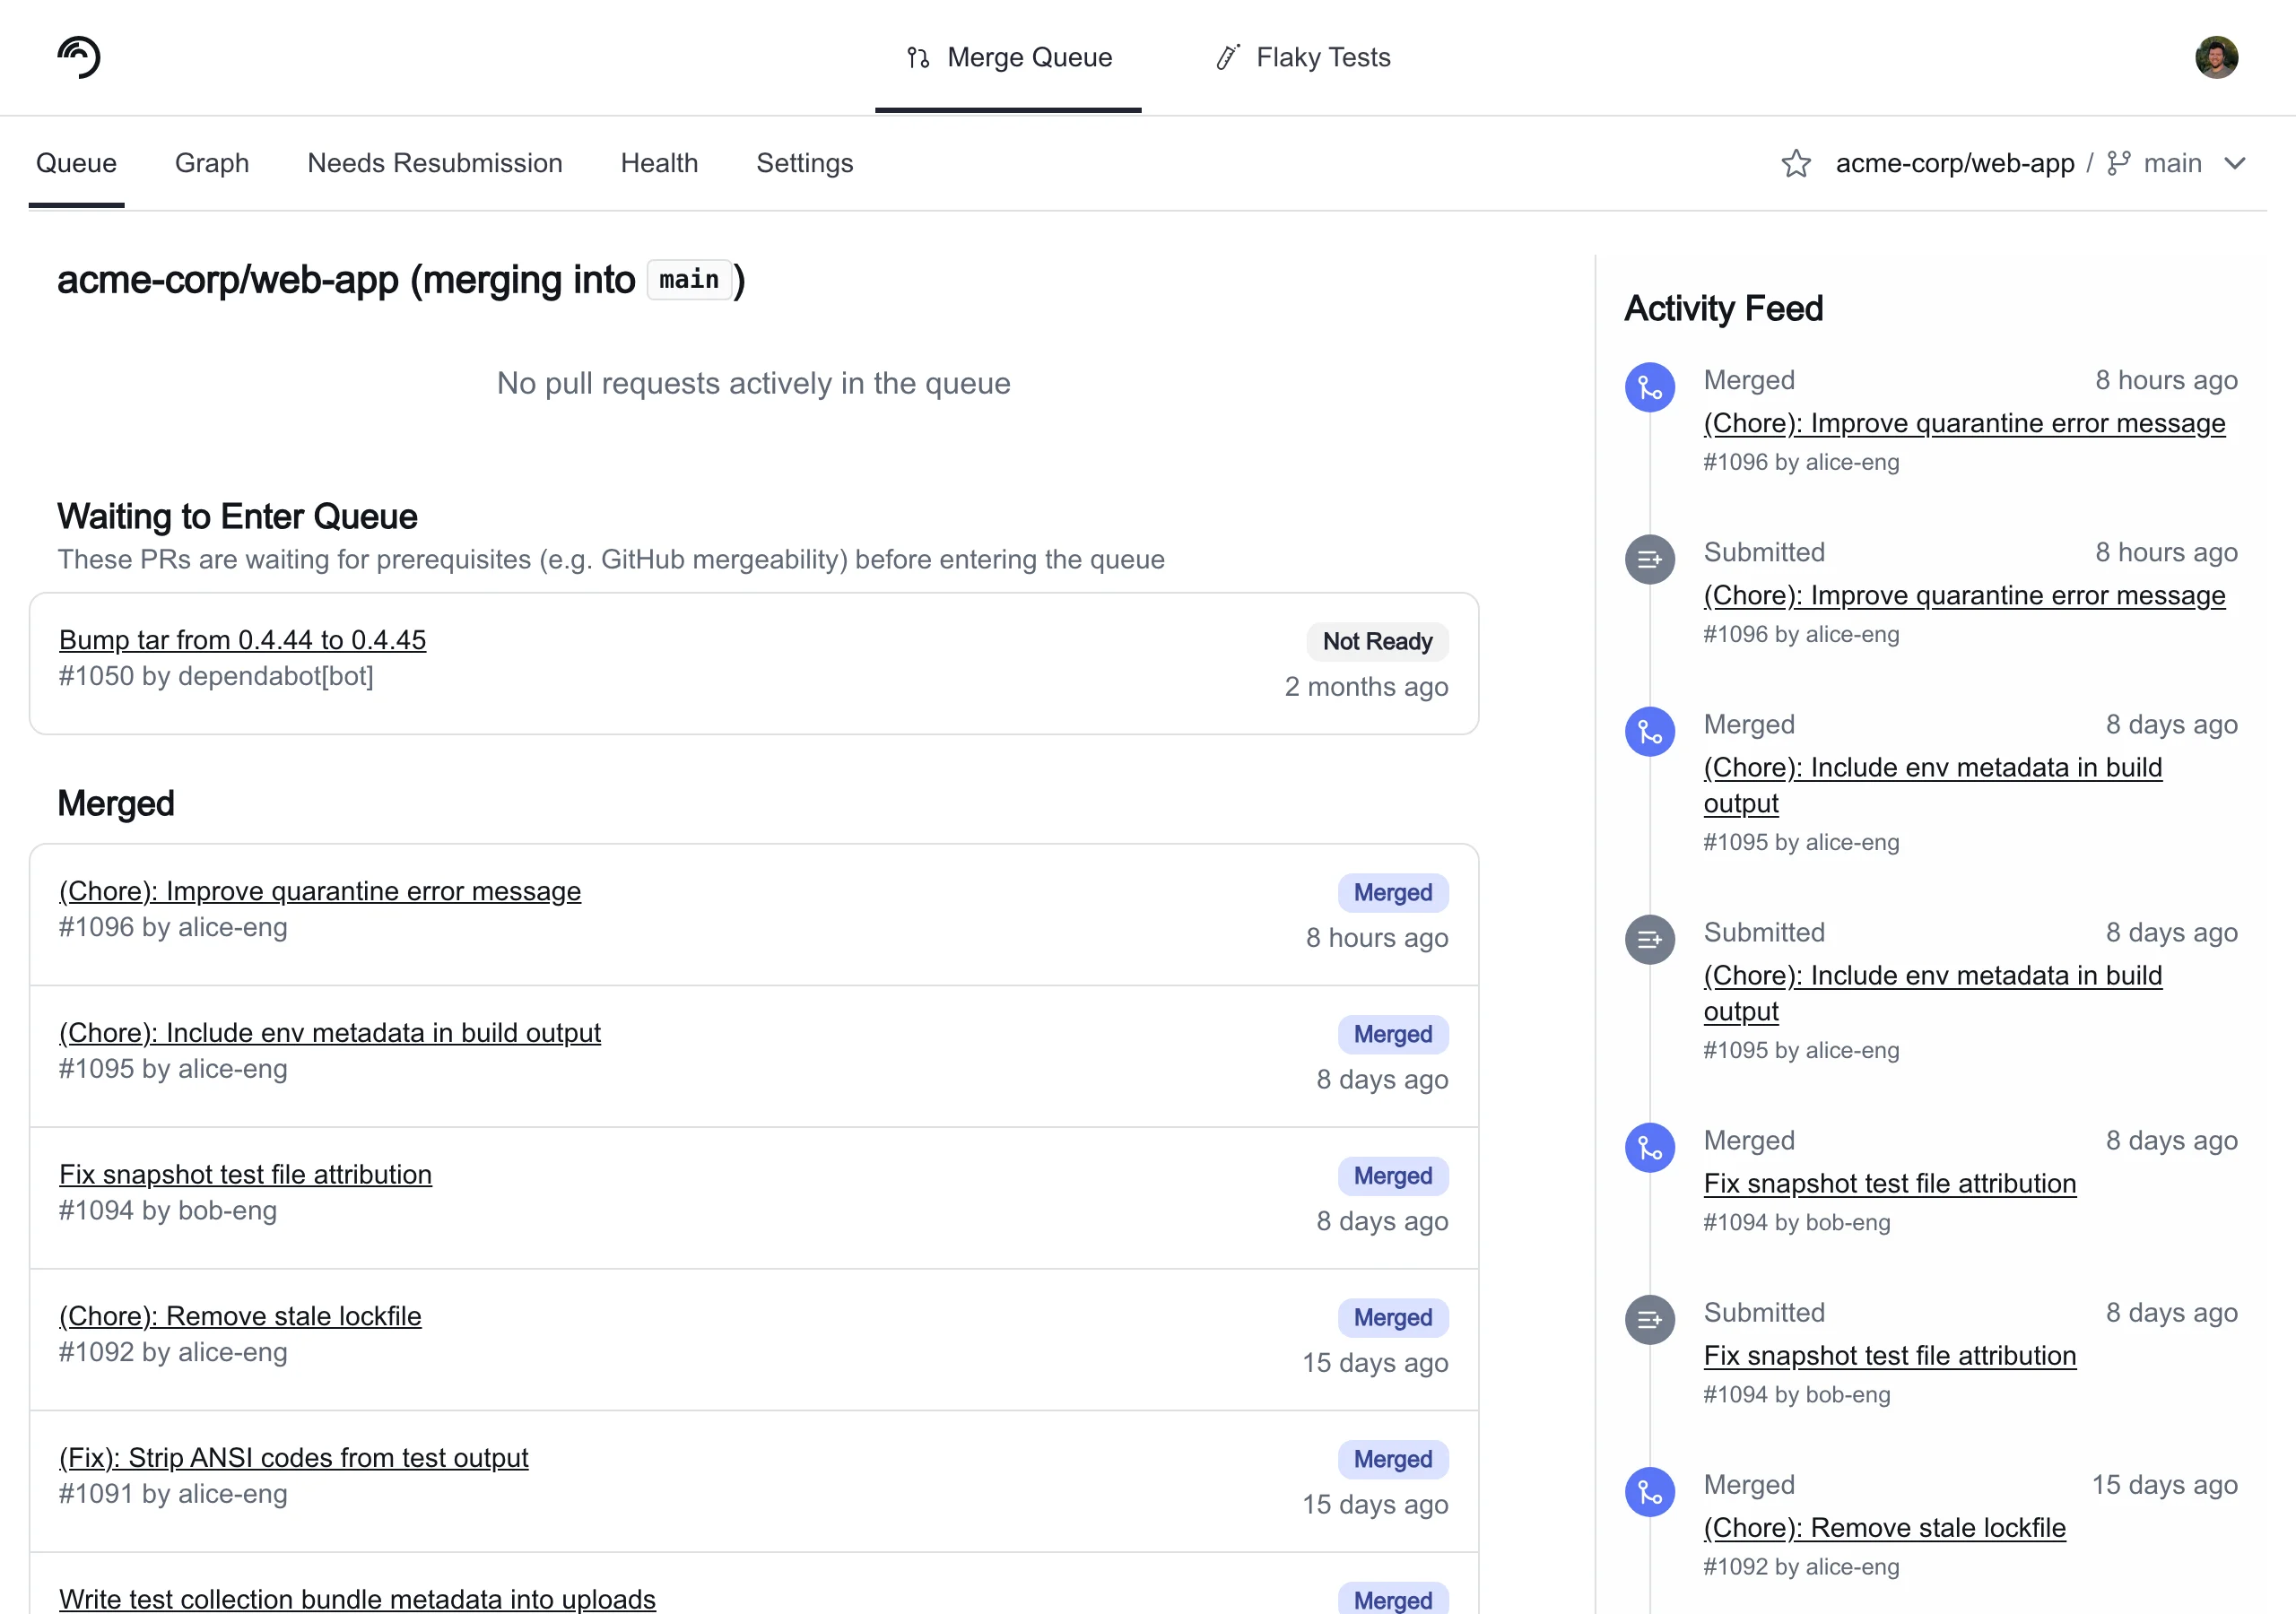
Clicking on a queue item navigates you to the details page.
Queue view
View status of the queue and recent activity in the Queue tabActive queue status
- Currently testing: Which PR is running tests right now
- Queued PRs: How many PRs are waiting
- Merged: List of previously merged PRs
Activity feed
- PRs merged in the last 24 hours
- Success rate (percentage of PRs that passed tests)
- Average merge time
- Failed PRs requiring attention
Graph view
The graph view shows all PRs currently being tested by Trunk Merge Queue and their relationships. Each node represents a pull request, and each edge indicates that the PR is testing with the item above and depends on it. All edges point towards the target branch; as items merge, the affected queues restructure. If running inSingle mode, this will be a single line showing the testing and merging process.
Reading the graph
- Merged items appear in the green section at the top of the graph
- Batched items display batching information directly on each node. Clicking a batched node takes you to the draft PR created for that batch
- Hover over any node to highlight its path to the root, making it easy to trace dependencies
- Bisection activity appears in a side tab when a batch is being bisected to isolate a failure
- A legend explains the node states and visual indicators
Navigation
- Click any node to navigate to the PR’s detail page
- A link at the top of the graph view lets you switch to the legacy graph layout if needed
Priority badges
PR nodes in the graph view display a priority badge when the PR was queued with a non-default priority:- Urgent — a red pulsing badge labeled URGENT. Indicates the PR is interrupting in-progress testing.
- High — an orange badge labeled HIGH. The PR is fast-tracked ahead of normal-priority items.
Impacted targets in the graph
When running in Parallel mode, the graph view surfaces impacted targets data to help you understand why PRs are grouped or ordered the way they are.- Per-PR tooltips: Hover over a PR node to see which targets that PR impacts.
- Overlapping targets on edges: Use the Show targets on hover toggle to display which targets overlap between connected PRs. Overlapping targets explain why PRs are in the same testing sequence: PRs with shared targets must be tested together.
Health view
Select a period of time to inspect using the Period dropdown (default 7 days) and a Granularity (defaults to daily) of queue metricsConclusion counts
A Bar chart of PRs and their statuses. More Green = More Merges!Time in queue
View statical trends of PR time in queue, default p50 view is useful for an “Average time in queue” evaluation.Pull request details
The PR details show information about a PR, including a link to the PR in GitHub, the history of the PR within Trunk Merge Queue, and what must be done before a PR can be admitted to the queue for PRs that have not entered the queue yet. When a PR has not been admitted to the queue yet, Trunk Merge Queue waits for:- Impacted targets to be uploaded for the PRs current SHA (
Parallelmode only) - The PR to be mergeable according to GitHub. If the PR is not mergeable yet, this most likely means that the PR is not meeting all branch protection rules you have set (for example, not all required status checks have passed yet) or has a merge conflict with the target branch
- The target branch of the pull request to match the branch that merge queue merges into
.png?fit=max&auto=format&n=_uqom5T5LPXKKAze&q=85&s=35a1bc7c548d64cf729c917d7f130589)
PR readiness details for a PR that has been submitted but has not yet entered the merge queue.
View impacted targets
In Parallel mode, the PR detail page includes a View Impacted Targets button when targets have been uploaded for the PR. The modal shows one of three states:IMPACTS_ALL: The PR depends on everything in the queue, and every PR submitted after this one will depend on it. No parallel optimization is possible.- Specific targets: A list of each target the PR impacts.
- None (empty list): An empty list of targets was uploaded. The PR will not depend on anything, and nothing will depend on it.